
Key takeaways
ICT Forex Scout Sniper Basic Field Guide Volume 5 teaches discretionary range finding and price targeting with EUR/USD, CAD/JPY, AUD/JPY and USD/JPY examples, combining higher-time-frame market structure and order blocks with a 62% to 79% Fibonacci optimal trade entry zone.
Read the full summary
ICT Forex Scout Sniper Basic Field Guide Volume 5 teaches discretionary range finding and price targeting with EUR/USD, CAD/JPY, AUD/JPY and USD/JPY examples, combining higher-time-frame market structure and order blocks with a 62% to 79% Fibonacci optimal trade entry zone. The hidden optimal trade entry method anchors a range to a nearby full figure, mid-figure or ICT institutional level that may not yet have traded, then measures toward the highest high of a consolidation near a higher-time-frame order block and seeks lower-time-frame confirmation rather than an automatic entry. The process is to establish directional bias, mark the expected revisit area, identify psychological references, measure the range, monitor the 62% to 79% zone and define invalidation in advance. Beginning at 56 minutes 53 seconds, ICT stresses predetermined exits to prevent open profit from becoming breakeven or a loss. From 1 hour 6 minutes 10 seconds, a broken swing high or low becomes a fulcrum and the preceding range is projected beyond it, with 1.27 and 1.62 Fibonacci extensions preferred as objectives and 2.00 treated as a more ambitious equal measured move. The historical examples illustrate chart-marking mechanics but provide no controlled testing, independently verified fills or performance record, so ICT advises chart study and the article recommends recording anchors and swing choices before revealing later candles, including failed setups to reduce hindsight bias.
How we researched this article
BestProps used document-based research from primary firm sources, checked September 25, 2026. The complete source list, scope, limitations, and commercial-state record appear near the end of this article.
ICT Volume 5 Range Finding Lessons
In ICT Forex Scout Sniper Basic Field Guide – Vol. 5, the speaker introduces the lesson as “range finding.” He first reviews the earlier assignment of locating higher-time-frame reference points and order blocks, then demonstrates how he combines those areas with Fibonacci retracements. The latter portion shifts from finding entries to identifying predetermined profit objectives from price swings.
The presentation uses EUR/USD, CAD/JPY, AUD/JPY and USD/JPY examples. These are historical chart illustrations selected by ICT; the transcript alone cannot independently establish trade fills, unseen chart details or the subsequent performance of any setup.
ICT Forex Order Blocks and Price Ranges
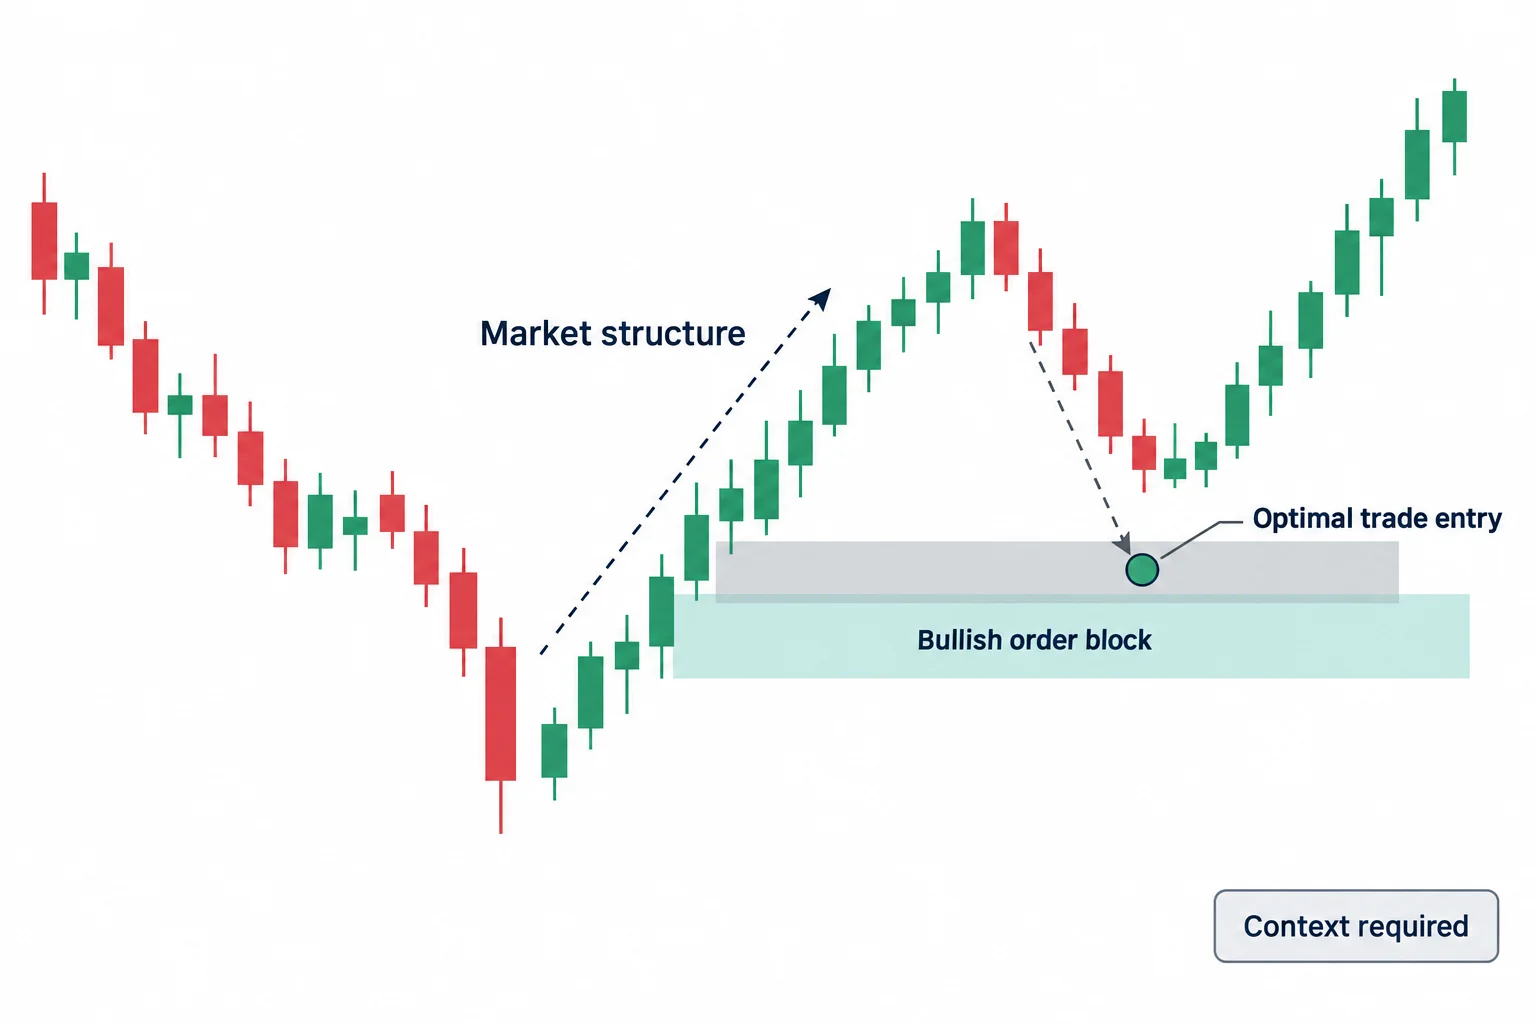
ICT begins the chart work with a EUR/USD daily and four-hour review at 3:41. His process starts with a directional reading of market structure. In a bullish setting, he marks a prior down candle or consolidation associated with an advance as a prospective bullish order block. He then measures a relevant price swing and watches the deeper retracement region that he calls an optimal trade entry, generally between the 62% and 79% retracement levels.
The important point is that ICT does not present a candlestick shape as sufficient by itself. During the EUR/USD discussion, he says that a hammer has little meaning in isolation and instead interprets it in the context of an order block and retracement area. He later reverses the logic for a bearish example: after a significant low is broken, a rally into what he identifies as a bearish order block becomes the area of interest.
This is a discretionary framework. Selecting the relevant swing, deciding whether structure is bullish or bearish, and defining an order block all require judgment. A Fibonacci reading therefore does not operate independently of the analyst’s prior choices.
ICT Forex Hidden Optimal Trade Entries
Beginning with CAD/JPY, ICT attempts to show that his framework is not limited to the major currency pairs he says he usually follows. The five-minute CAD/JPY explanation at 24:04 introduces what he calls a hidden optimal trade entry.
Instead of anchoring the Fibonacci tool only to two completed swing extremes, ICT uses a nearby psychological price reference (such as a full figure, mid-figure or one of his “institutional levels”) as an anchor. He measures from that reference to the highest high of a consolidation while price is approaching a higher-time-frame order block. In this construction, the lower anchor may be a price that has not traded yet. The 62%–79% retracement zone is then treated as a possible reaction area before price reaches that anchor.
ICT explicitly acknowledges that price can trade through the area or fail to produce the desired pattern. He tells viewers to investigate the construction through their own chart study rather than accept it immediately. The transcript contains strong claims by ICT about the pattern’s accuracy and originality, but it provides no controlled test or independently verified performance record.
How ICT Organizes the Trade Setup
- Begin with a directional premise on a higher time frame.
- Mark the order block or reference area that ICT expects price to revisit.
- Note nearby full figures, mid-figures or the levels ICT labels institutional.
- Measure the proposed range and identify the 62%–79% retracement region.
- Move to a smaller time frame and look for a corresponding price pattern rather than treating the level as an automatic entry.
- Recognize in advance where the premise would be weakened or invalidated.
The AUD/JPY examples beginning at 40:03 repeat this sequence with four-hour reference areas and lower-time-frame retracements. ICT also comments that the active session may matter for a pair’s intraday highs and lows, although those observations are presented as his interpretation rather than a statistical study.
ICT Price Targets and Predetermined Exits
At 56:53, the lesson turns toward profit-taking discipline. ICT describes the temptation to hold for the entire projected move and explains that this can turn a strong open profit into a smaller result, breakeven or a loss. His central behavioral lesson is to choose an exit objective before entering and to avoid judging a planned exit as a failure merely because price later continues farther.
This section is more broadly applicable than the specific chart terminology: a predetermined exit creates a rule that can be reviewed, whereas continually moving a target introduces hindsight and emotion. It does not ensure a profitable outcome, but it makes the decision process more explicit.
ICT Price Targets From Fibonacci Swings
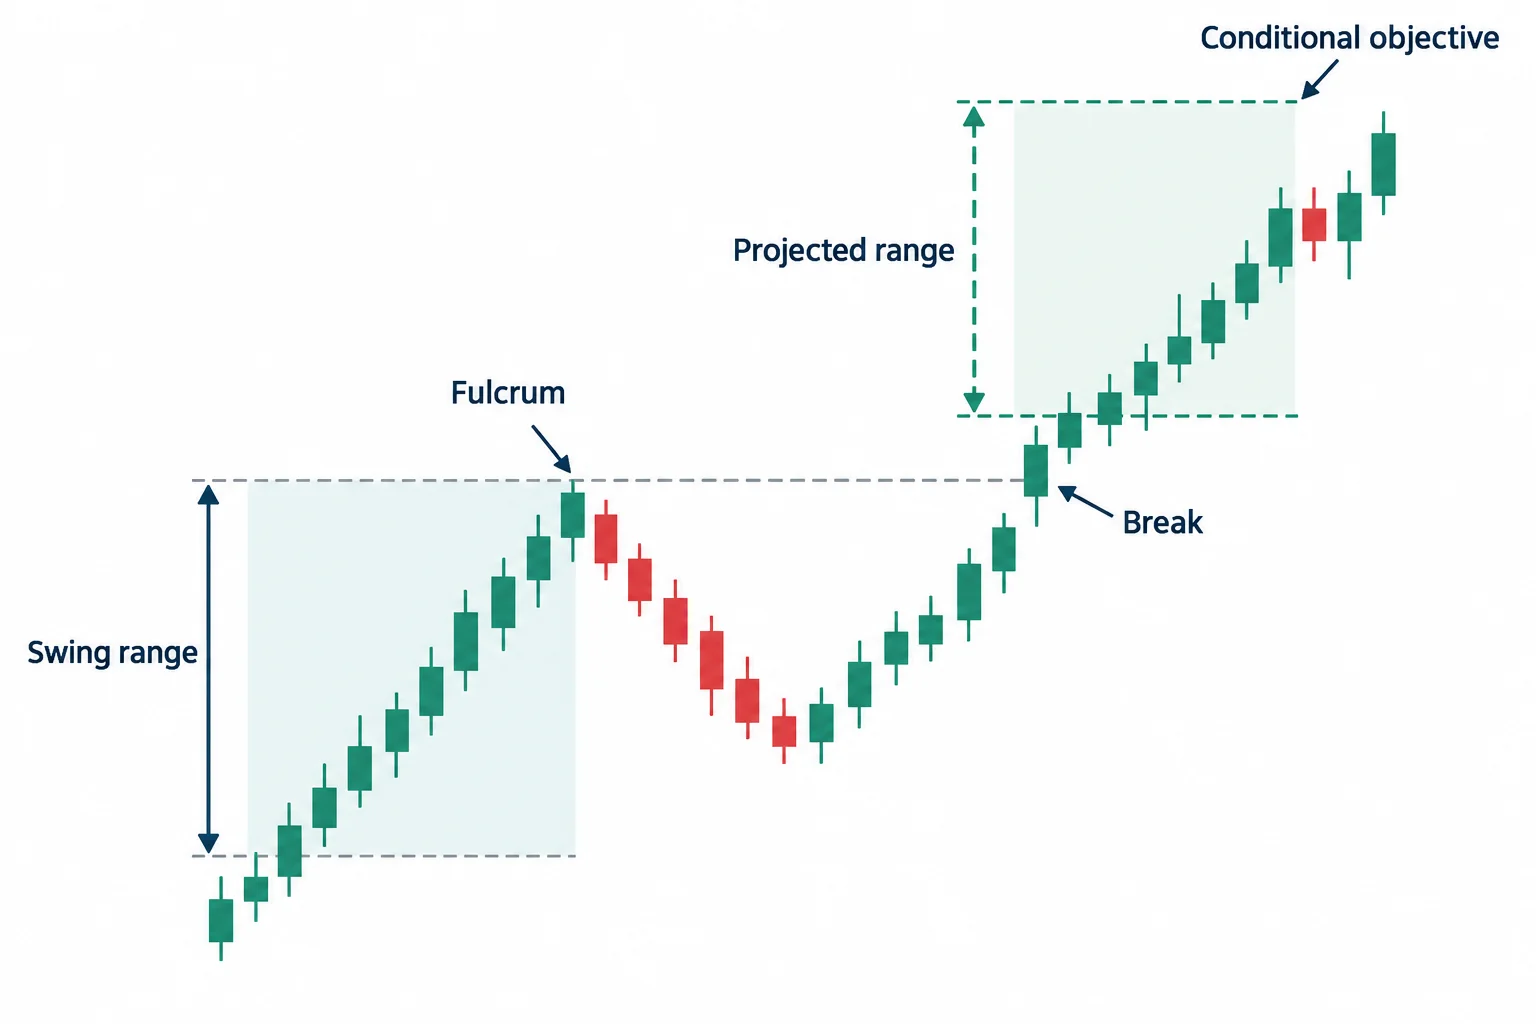
The technical target-selection lesson starts around 1:06:10. ICT describes swings nested inside larger swings and introduces a measured-move concept. Once a significant swing high or low is broken, the preceding swing range can be projected beyond that point. He calls the broken reference a fulcrum.
For bullish projections, ICT reverses the Fibonacci drawing direction across the relevant pullback so the tool displays extension objectives above the prior high. For bearish projections, he applies the converse construction below the prior low. He emphasizes the 1.27 and 1.62 extensions as preferred objectives and treats a 2.00 extension (an equal measured move) as a more ambitious target rather than something to expect every time.
The chart examples at 1:24:54 apply those projections to bullish EUR/USD swings, followed by bearish USD/JPY illustrations. These examples explain ICT’s chart-marking method, but selected historical examples do not demonstrate how frequently the projected levels work across markets or conditions.
ICT Volume 5 Field Guide Takeaways
Volume 5 connects three layers of ICT’s framework: higher-time-frame context, a retracement-based area of interest, and a predetermined target derived from a prior swing. The most practical study exercise is to mark these elements on historical charts without assuming the result, record the swing and anchor choices before revealing later candles, and note failed as well as favorable examples. That approach helps separate a repeatable rule from an explanation influenced by hindsight.
This summary is educational commentary on ICT’s presentation, not investment advice or a promise that the described methods will be profitable.




