
Key takeaways
ICT Forex Scout Sniper Basic Field Guide Volume 4 is a long-form YouTube lesson using historical EUR/USD charts to combine daily directional bias, market structure, 62% to 79% Fibonacci retracements, institutional order blocks and London or New York session timing.
Read the full summary
ICT Forex Scout Sniper Basic Field Guide Volume 4 is a long-form YouTube lesson using historical EUR/USD charts to combine daily directional bias, market structure, 62% to 79% Fibonacci retracements, institutional order blocks and London or New York session timing. The basic daily filter uses 9-period and 18-period exponential moving averages, focusing on bullish pullbacks when the 9 EMA is above the 18 EMA and bearish rallies when it is below, then requiring a break of a prior swing high or low. The preferred retracement range is 62% to 79%, with 70.5% called the sweet spot. An order block is identified as the final down candle before bullish expansion or final up candle before bearish expansion, with price expected to return toward that point of origin. The hierarchy is direction first, structure second, location third and timing last, applied across daily, four-hour, hourly and 15-minute charts. Kill zones are only activity windows, not standalone signals, and the lesson warns against chasing moves, treating EMA crossovers as guarantees or assuming candle patterns reveal actual institutional positions, instead recommending observation, paper trading and acceptance of losses.
How we researched this article
BestProps used document-based research from primary firm sources, checked September 25, 2026. The complete source list, scope, limitations, and commercial-state record appear near the end of this article.
ICT Forex Scout Sniper Basic Field Guide – Vol. 4 is a long-form lesson about combining higher-time-frame direction, selected trading sessions, market structure, retracements and what ICT calls institutional order blocks. The presentation uses historical EUR/USD charts and frames the material as a selective process rather than a reason to trade every market movement.
Primary source: Watch ICT Forex Scout Sniper Basic Field Guide – Vol. 4 on YouTube. The video was uploaded on December 25, 2017, although the chart discussion refers to examples beginning in September 2013.
What ICT Forex Volume 4 Covers
ICT opens with an extensive agenda: reviewing the previous “stalking in the kill zone” assignment, defining directional bias, examining higher-time-frame structure, discussing consolidations and introducing institutional order blocks and a “return to the point of origin” (00:27).
The first major example revisits a bullish EUR/USD thesis. ICT attributes that historical bias partly to rising yields and explains the inverse relationship between Treasury futures prices and yields (05:02). This is ICT’s interpretation of the market backdrop, not an independently validated rule. His practical point is that a directional thesis should determine which side receives the trader’s attention; it does not mean every countertrend signal is impossible.
ICT Forex Volume 4 Kill Zone Filters
On a 15-minute EUR/USD chart, ICT marks London and New York time windows and looks for pullbacks that agree with the bullish higher-time-frame premise (10:43). He repeatedly measures recent price swings and focuses on retracements in what he calls the optimal trade entry region, generally between the 62% and 79% Fibonacci levels, with 70.5% described as the “sweet spot.”
Importantly, he cautions that these windows do not identify every high or low. Around 16:02, he explains that the session times shown are deliberately generic and may differ from those used in his own trading. Later, he states that kill zones merely highlight periods when notable activity often occurs; without directional and structural context, he considers them insufficient (42:19).
Basic ICT Forex Directional Bias
ICT defines a “high probability” setup as one aligned with the higher-time-frame trend and prevailing market conditions (48:45). That language reflects his framework and should not be read as a measured probability or guarantee.
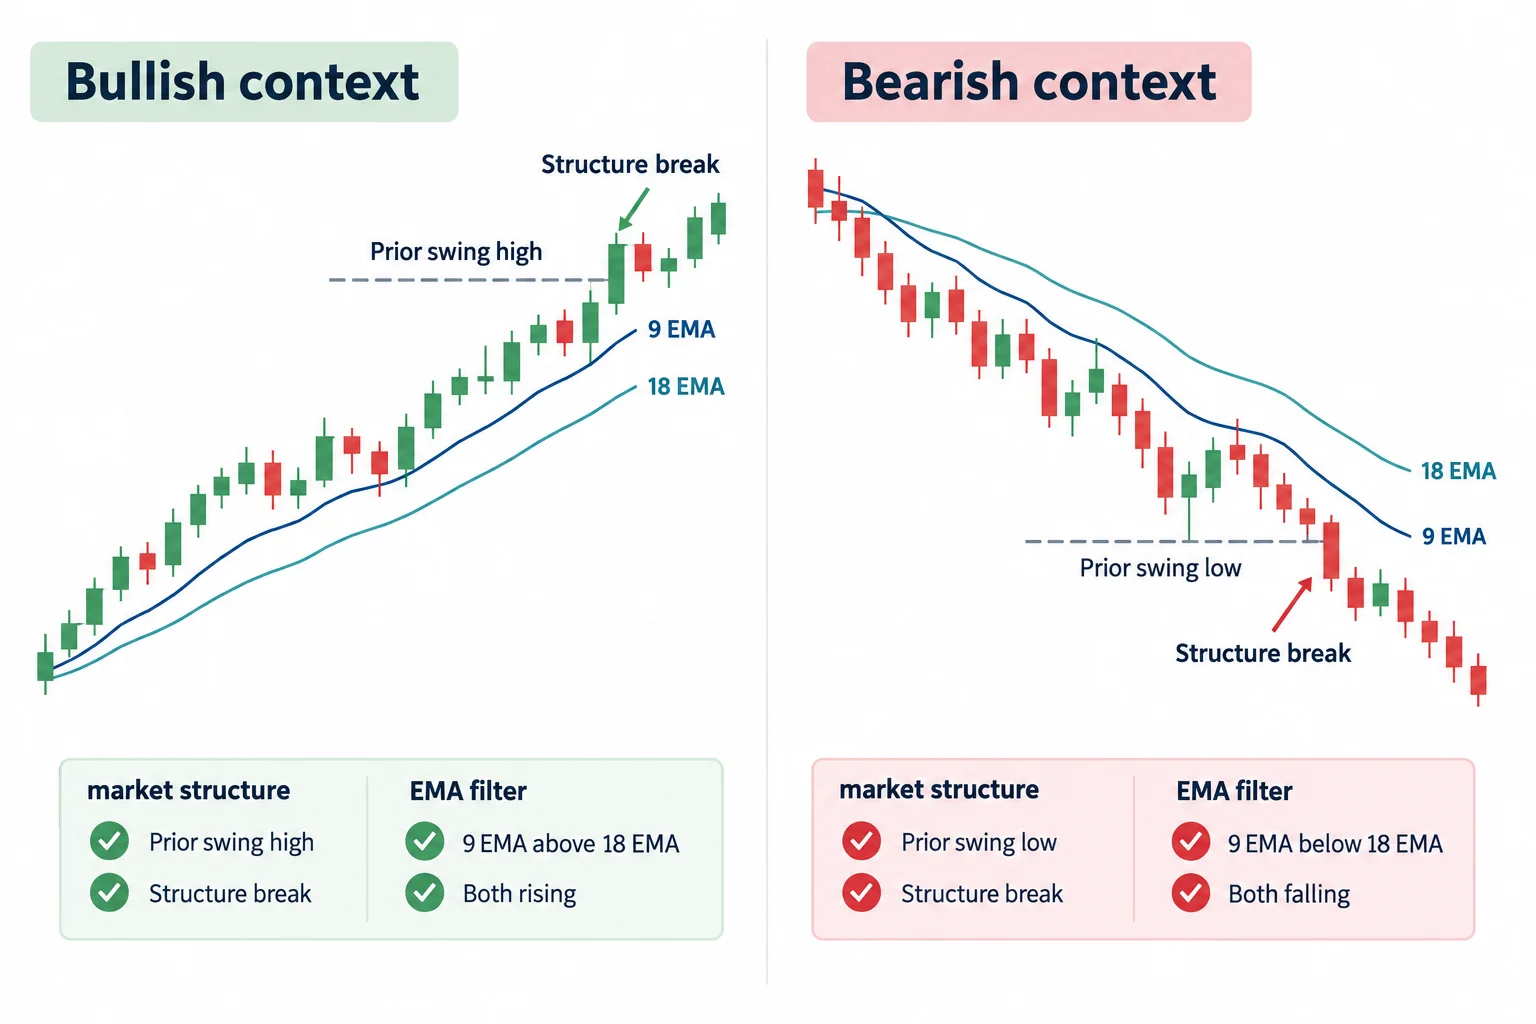
Beginning at 1:02:10, he introduces a basic daily-chart filter:
- Add 9-period and 18-period exponential moving averages.
- When the 9 EMA is above the 18 EMA, concentrate on pullbacks that could support a bullish scenario.
- When the 9 EMA is below the 18 EMA, concentrate on rallies that could support a bearish scenario.
- Do not use the crossover as a promise that a trade will succeed or as a tool for selecting exact tops and bottoms.
He then adds market structure. In the bullish case, a break above a prior swing high supports the directional framework; in the bearish case, a break below a swing low supports it. The moving averages provide a broad filter, while swing breaks and subsequent retracements refine the setup. ICT also acknowledges that losses remain possible and argues for accepting them rather than immediately forcing another trade.
ICT Forex Sniper Consolidations and Order Blocks
The lesson turns to consolidations at 2:22:42. ICT interprets a consolidation following a forceful move as a possible area of institutional accumulation or distribution. He calls the relevant area an institutional order block and often identifies it using the final down candle before a bullish expansion, or (by reversal of the logic) the final up candle before a bearish expansion.
These labels are ICT’s reading of price action. A price chart alone does not disclose the identities, intentions or exact positions of market participants. The educationally useful part is the repeatable chart procedure he proposes:
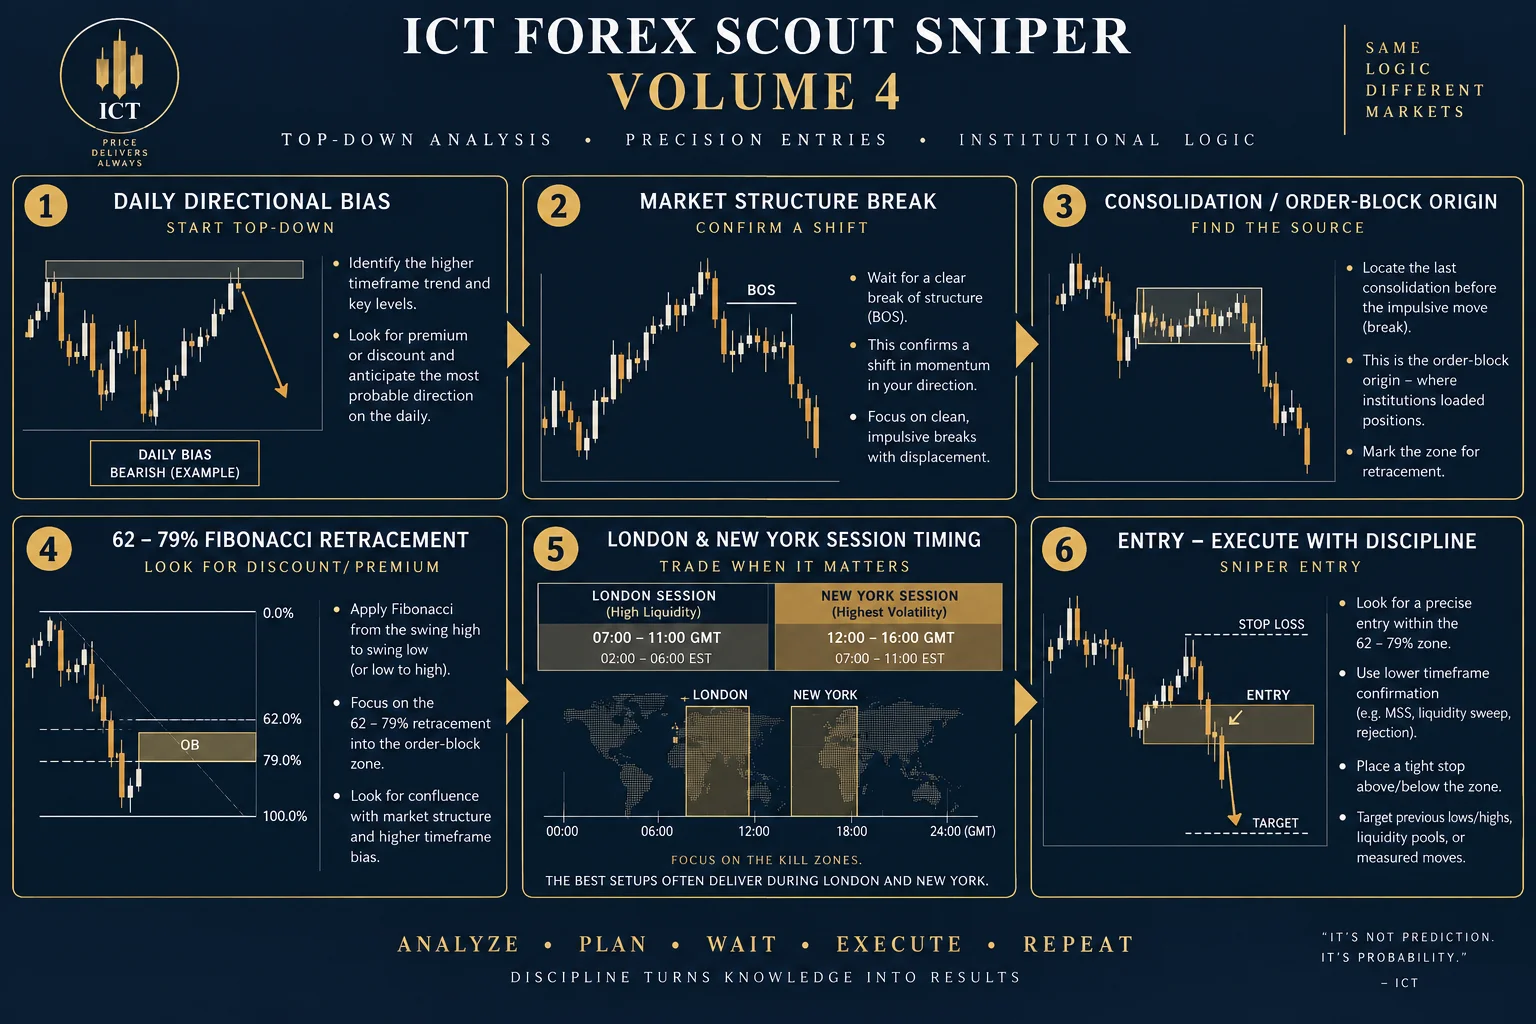
- Establish direction on the daily chart.
- Identify a meaningful swing break in that direction.
- Mark the apparent origin of the expansion.
- Wait for price to retrace toward that area instead of chasing the initial move.
- Look for confluence with a measured retracement and a preferred session window.
ICT Forex Scout Returns to the Point of Origin
ICT demonstrates the same idea across daily, four-hour, hourly and 15-minute charts. At 1:59:26, he moves to a four-hour example: after price breaks a swing high, he waits for a return to the down candle associated with the move’s origin. He combines that area with a 62%–79% retracement rather than treating either component as sufficient alone.
The concluding diagram summarizes the bullish version clearly (2:38:41): start from higher-time-frame support, require a bullish structure break, measure the resulting swing, and look for a retracement into the origin area during London or New York timing. The bearish model is presented as the inverse.
Basic ICT Forex Field Guide Takeaways
The most transferable lesson is not any single Fibonacci level or candle label. It is the hierarchy of analysis: broad direction first, structure second, location third and timing last. ICT repeatedly discourages chasing every movement and recommends observation or paper trading while learning. For independent study, each element should be documented separately so that hindsight does not turn every historical pullback into an apparently obvious setup.
This summary is educational commentary on ICT’s presentation, not investment advice. Historical chart illustrations and speaker-reported trades do not establish future results.





