
Key takeaways
ICT Forex Scout Sniper Basic Field Guide Volume 2 is a historical EUR/USD chart-study lesson that builds directional context on daily and four-hour charts, optionally refines it on the hourly chart, and only then examines 15-minute setups rather than retroactively justifying lower-time-frame patterns.
Read the full summary
ICT Forex Scout Sniper Basic Field Guide Volume 2 is a historical EUR/USD chart-study lesson that builds directional context on daily and four-hour charts, optionally refines it on the hourly chart, and only then examines 15-minute setups rather than retroactively justifying lower-time-frame patterns. ICT maps old highs, old lows, candle bodies, wicks, consolidations, swing points, round and half-figure prices, and inversion zones where support becomes resistance and can later revert to support. His weekly timing model claims a bearish-market high often forms by Tuesday’s London open, with the inverse applying in bullish markets, and cites 70% without supplying test data while acknowledging Wednesday exceptions. Session study covers Asian, Frankfurt, London, New York, and London-close kill zones, with an assignment to record Asian, London, and New York session highs and lows on a five-minute chart. The optimal trade entry uses a 62% to 79% Fibonacci retracement with 70.5% preferred, combined with directional bias, old highs or lows, round numbers, and session timing. ICT’s market maker business model progresses through consolidation, an upward phase with pauses, failure near the top, and a two-stage decline, while his institutional order-flow explanations characterize retracements as opportunities for large sellers and stops around prior swings as liquidity. These participant and probability claims lack independent order-book or statistical evidence, and ICT emphasizes historical study, demo practice, patience, risk controls, and no certainty rather than presenting a mechanical or proven profitable strategy.
How we researched this article
BestProps used document-based research from primary firm sources, checked September 25, 2026. The complete source list, scope, limitations, and commercial-state record appear near the end of this article.
ICT Forex Scout Sniper Basic Field Guide – Vol. 2 is a chart-study lesson built around historical EUR/USD examples. ICT calls this installment “boot camp” and uses it to connect higher-time-frame support and resistance, trading sessions, weekly timing, round-number levels, Fibonacci retracements, and his interpretation of institutional order flow.
This article summarizes the concepts presented in the primary video. The institutional explanations and probability claims are ICT’s interpretations, not independently established findings or guarantees.
What ICT Forex Volume 2 Covers
At 0:31, ICT outlines an ambitious agenda: review the prior assignment, examine time of day and day of week, discuss paired orders and a “market maker business model,” study price swings through time and price, introduce fractals, and assign further chart work.
The central workflow is top-down. ICT begins with a daily EUR/USD chart, identifies levels he considers significant, and then moves to a 15-minute chart to study how price behaved around them. His repeated warning is that a lower-time-frame pattern should not be used first and then retroactively justified with a higher-time-frame level.
ICT Forex Higher Time Frame Levels
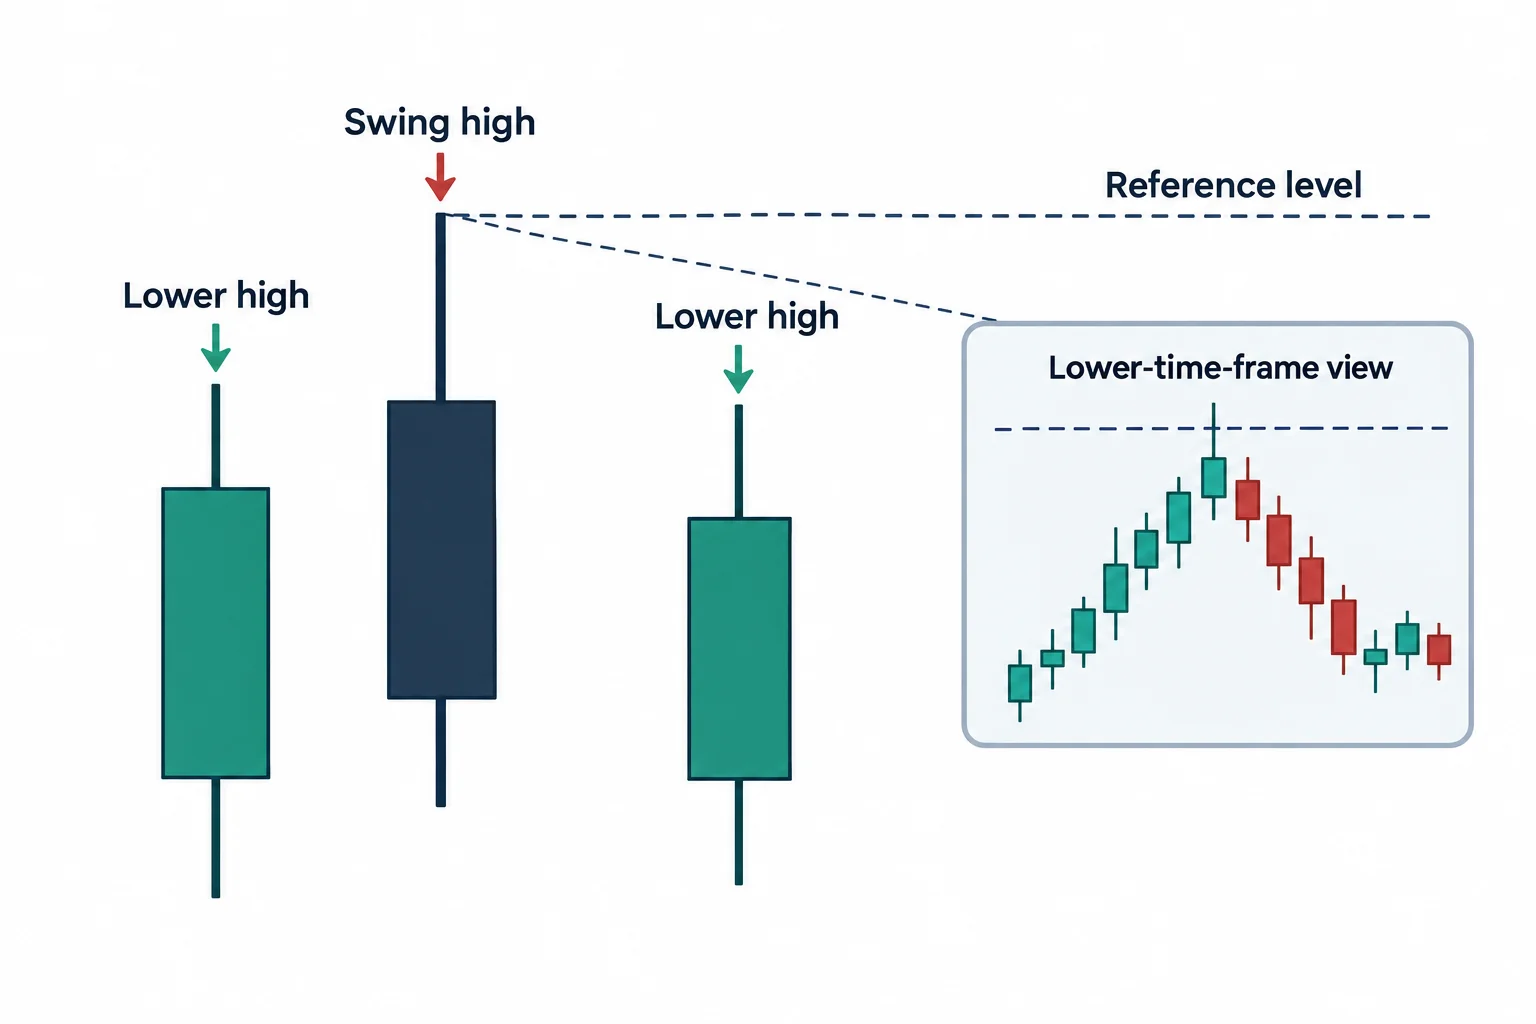
Beginning around 4:54, ICT reviews old highs, old lows, candle bodies, wicks, consolidations, and swing points on the daily chart. He treats these as potential areas where a later move might pause or react. He also defines a swing high as a high with lower highs on both sides.
Round numbers are added to this framework. In the example, ICT adjusts a chart level toward what the captions render as “13060,” arguing that large participants tend to work orders around round or half-figure prices rather than unusually precise quotations. Because the presentation depends on an unseen chart and generated captions, the exact formatting of several quoted EUR/USD levels is uncertain.
At 15:45, ICT explains how he maps a bearish path: if price moves through one set of old lows, the next lower group becomes another area to monitor. He recommends concentrating analysis on daily and four-hour charts, using the hourly chart when additional detail is needed. This is presented as a way to establish directional context before examining intraday setups.
ICT Forex Support and Resistance
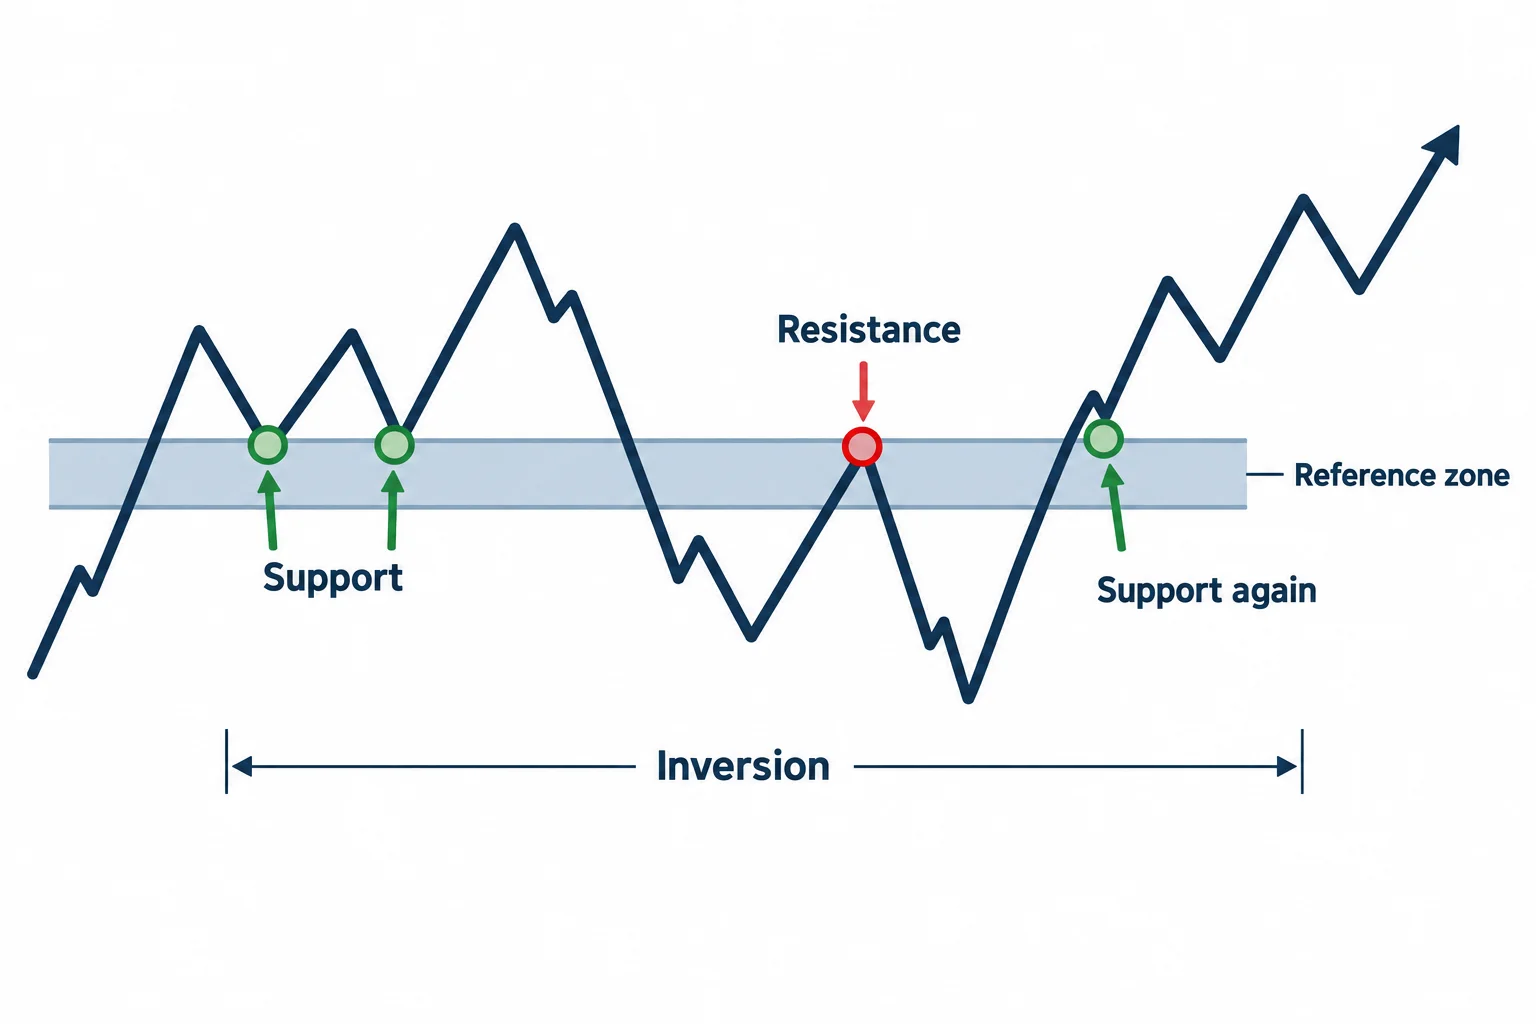
A recurring concept is “inversion.” Around 27:22, ICT describes a level that first acts as support, later becomes resistance after price crosses it, and then resumes a support role when price moves back above it. In conventional educational language, this is support-resistance role reversal.
ICT stresses that these areas are zones rather than perfectly exact prices. Wicks may penetrate a level while candle bodies remain near it. The lesson therefore does not present precision to a single pip as a requirement. It instead asks students to observe repeated reactions around a broader reference point.
ICT Forex Institutional Order Interpretation
From 33:00, ICT uses a swimming-pool analogy. Retail activity is compared with small splashes, while a large institution is compared with an elephant displacing water. He argues that large orders must be worked in pieces and leave visible “footprints” through repeated reactions and displacement.
He then interprets rallies in a bearish move as opportunities for large sellers to add orders and portrays stops beyond prior highs or lows as liquidity for the opposite side. These are ICT’s readings of the displayed price action. The transcript does not provide order-book evidence identifying actual participants, their positions, or their motives.
ICT Forex Trading Times and Weekdays
ICT introduces weekly timing at 46:20. He claims that, in a bearish higher-time-frame market, the weekly high often forms by Tuesday’s London open; he reverses the idea for bullish conditions and looks for an early-week low. He states a 70% figure, but the video does not show a dataset or test methodology supporting that percentage. He also acknowledges exceptions, including Wednesday moves.
At 57:50, he compares several turning points with Asian, Frankfurt, London, New York, and London-close periods. He calls selected session windows “kill zones,” explaining that the phrase belongs to his sharpshooter teaching metaphor rather than literal violence.
A practical study suggestion appears at 1:16:56: record the highest high and lowest low of the Asian, London, and New York sessions, preferably on a five-minute chart, and compare those session ranges with higher-time-frame levels.
ICT Forex Fractals Retracements and Confluence
The fractal discussion begins at 1:02:09. ICT’s point is that similar swing structures and support-resistance behavior appear across time frames, while each time frame also creates its own local levels.
He briefly introduces what he calls the “optimal trade entry”: a Fibonacci retracement between 62% and 79%, with 70.5% as his preferred intermediate level. In the examples, he combines a retracement with a round number, an old high or low, session timing, and directional bias. The educational principle is confluence, requiring several contextual observations rather than treating a Fibonacci percentage as a standalone signal.
ICT Forex Market Maker Model
At 1:25:20, ICT sketches his “market maker business model”: consolidation, an upward phase with pauses or retracements, a failure near the top, and a two-stage decline. He then shows a comparable repeating structure in another segment and warns that the phases will not be perfectly symmetrical.
The main takeaway is not a mechanical entry rule. ICT asks viewers to combine market structure, higher-time-frame barriers, session timing, day-of-week tendencies, round numbers, and retracements. He repeatedly emphasizes patience, historical chart study, demo practice, risk controls, and the absence of certainty. The transcript does not establish trade fills, subsequent results, or profitability, so the material is best treated as a framework to examine critically rather than a proven edge.




