
Key takeaways
ICT’s Forex Weekly Bias framework organizes a forex trading week around its Sunday opening price.
Read the full summary
ICT’s Forex Weekly Bias framework organizes a forex trading week around its Sunday opening price. For a bullish week, he anticipates an early-week low (often Tuesday London through Wednesday New York) followed by expansion above the open; for a bearish week, he looks for an early-week high above the open followed by downward expansion. The weekly open serves as a contextual fair-value level defined jointly by monthly and weekly directional analysis. Wednesday functions as a decision boundary—once price moves substantially above the open on or after Wednesday, a bullish profile should not return to it. Specific pip examples (30-pip entries, 150-pip stops, 150–300-pip objectives) are ICT’s hypothetical teaching parameters, not validated trading recommendations. The model is presented as a chart-review hypothesis with illustrative USD/CAD examples, not a statistically proven system.
How we researched this article
BestProps used document-based research from primary firm sources, checked September 25, 2026. The complete source list, scope, limitations, and commercial-state record appear near the end of this article.
What ICT teaches in “The Weekly Bias”
In ICT Forex – The Weekly Bias – Excellence In Short Term Trading, ICT presents a framework for organizing a forex trading week around its opening price. The lesson focuses on two conditional profiles: anticipating an early-week low when the higher-time-frame outlook is bullish, and anticipating an early-week high when that outlook is bearish.
This is ICT’s interpretation of recurring weekly price behavior, not proof that a market must follow the profile. The transcript contains historical examples and personal claims, but it does not provide a controlled test of the model or reveal every detail visible on the original charts.
The weekly opening price as a reference
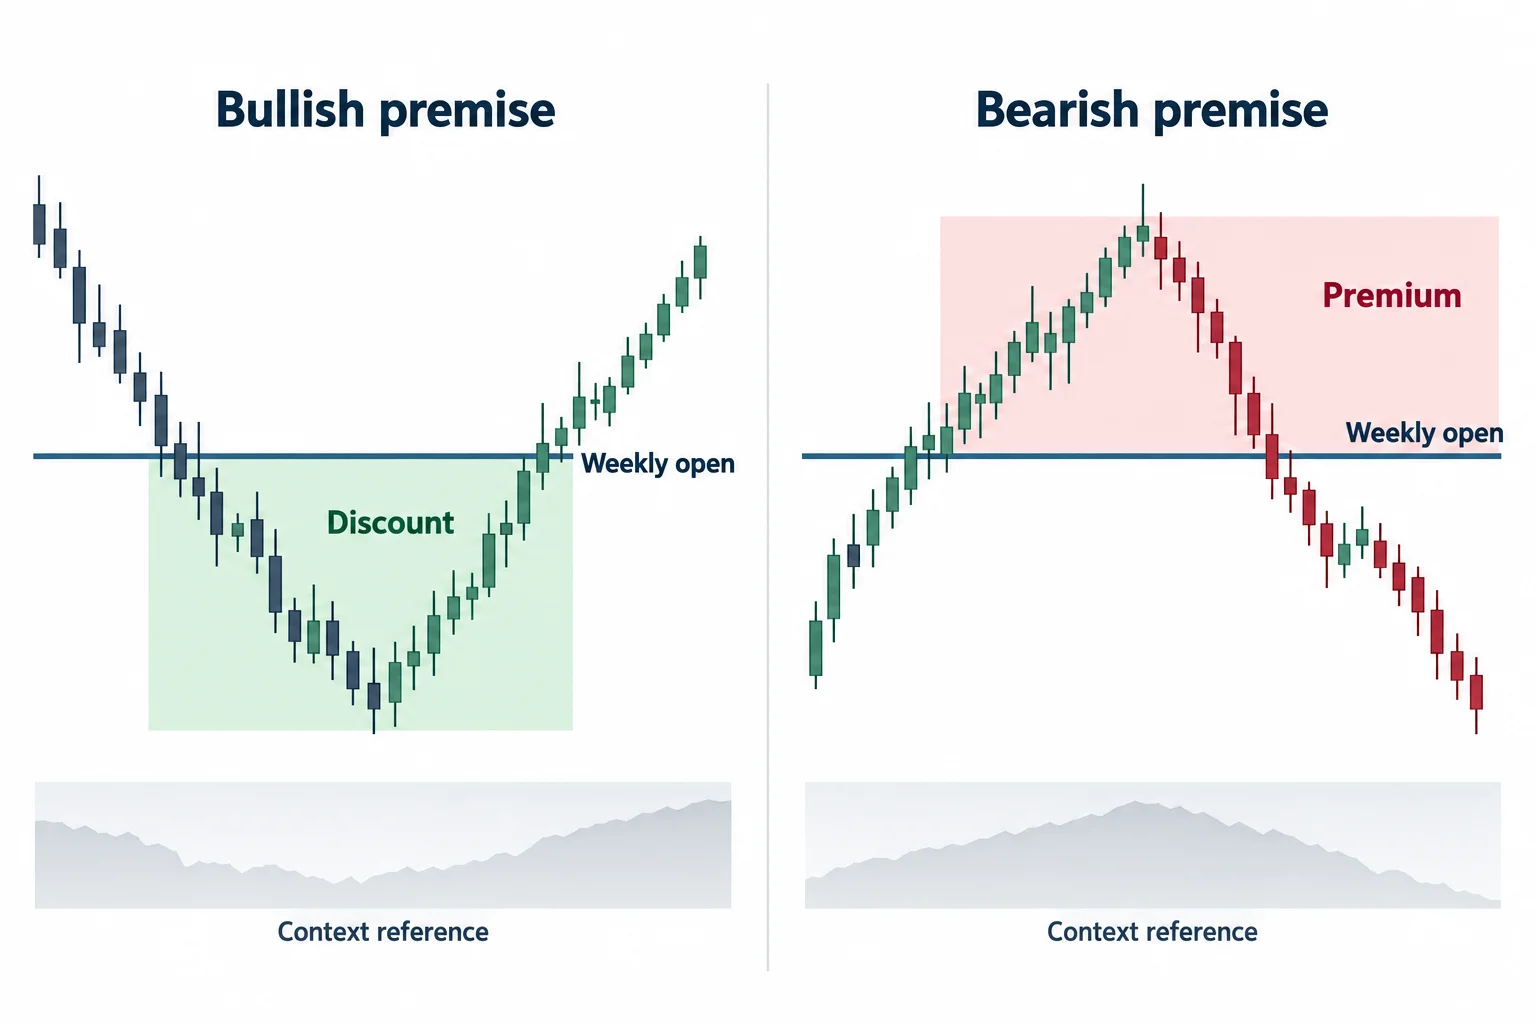
ICT begins the main explanation by marking the opening price associated with Sunday’s forex trading and extending that level across the week. He says that traders whose platforms do not display a Sunday candle may need to obtain the opening price from another market-data source. A Monday opening can be substituted, but he considers it a less precise representation of the complete weekly range.
At 1:40, he connects this reference level to a directional opinion derived from monthly and weekly charts. Under his framework:
- If the higher-time-frame premise is bullish, movement below the weekly open is treated as a potential discount relative to that premise.
- If the premise is bearish, movement above the weekly open is treated as a potential premium.
- The opening price is a contextual reference, not a standalone signal. Directional bias is supposed to be established first.
ICT calls the resulting sequence a weekly “Power of Three” formation. In the bullish version, price first moves below the open and later expands higher. The bearish profile reverses that sequence. Terms such as “Power of Three,” “smart money” and “Judas swing” are ICT’s labels for the behavior he describes; the video does not independently validate an underlying mechanism.
Bullish weekly profile
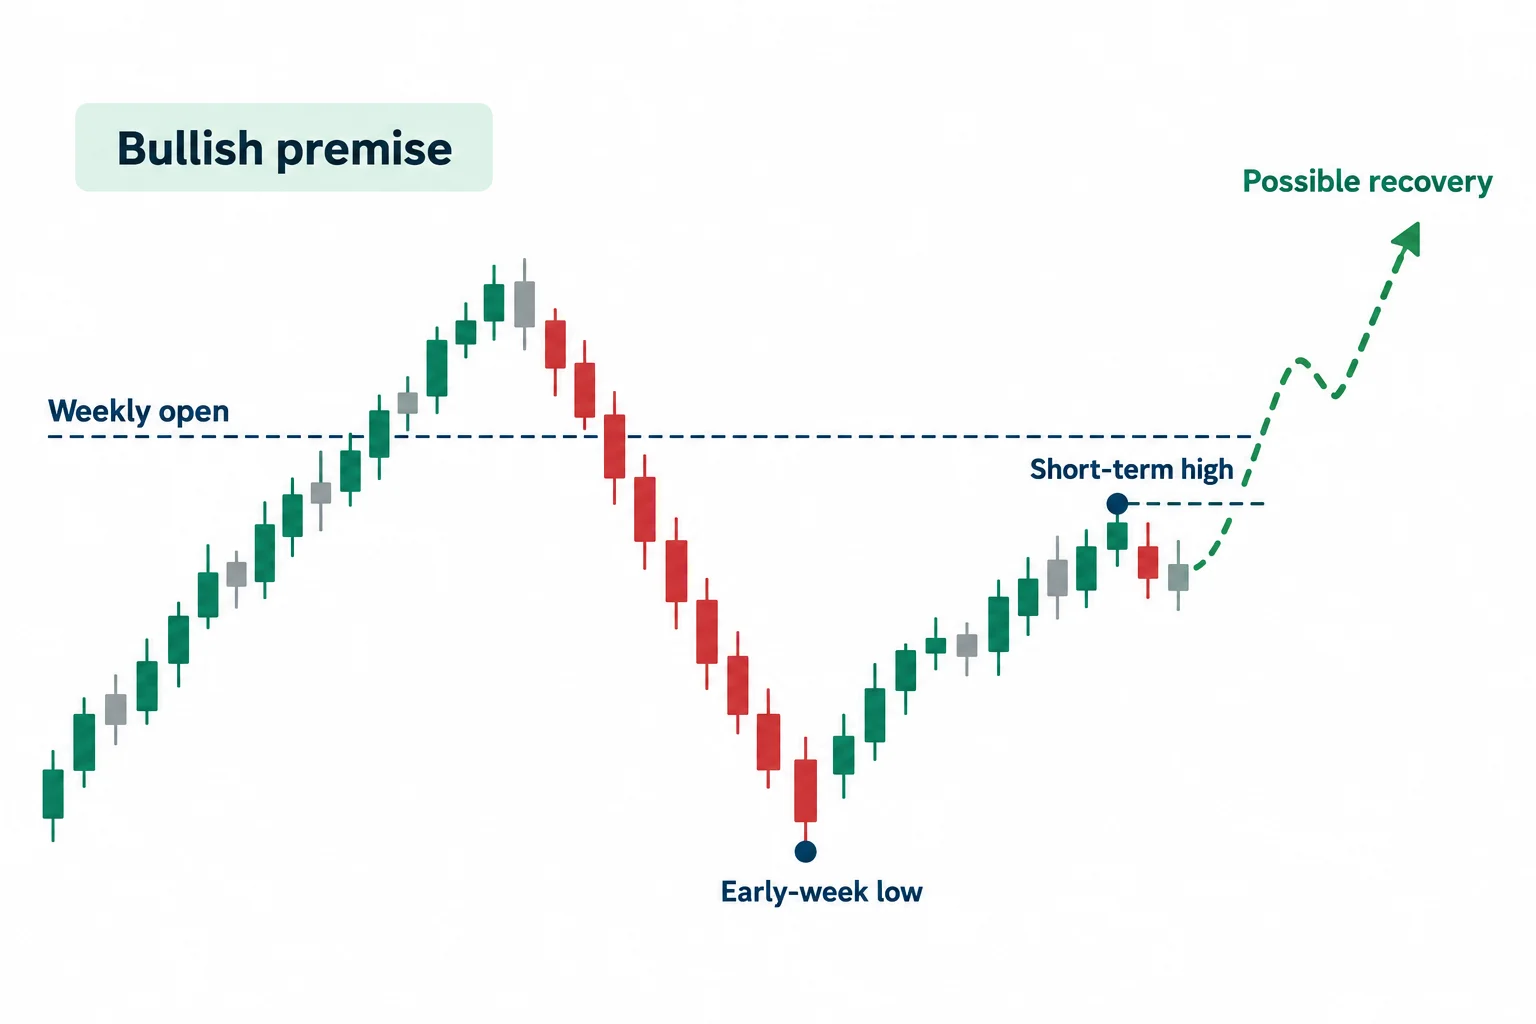
The bullish model is introduced at 1:03. ICT says he looks for the weekly low to form between the Sunday opening and Wednesday morning in New York, with particular attention on the period from Tuesday’s London session into Wednesday’s New York session.
Once a bullish higher-time-frame premise exists, ICT is not interested in immediately chasing an advance above the open. He instead waits for price to move below that reference. At 8:43, he explains that the decline is considered “oversold” only in relation to the bullish premise and weekly opening price—not because an oscillator says so.
Confirmation through short-term structure
For traders uncomfortable buying as price makes a new weekly low, ICT outlines a retracement-based alternative. Beginning around 14:37, the sequence is:
- Wait for a lower low to form during the preferred early-week window.
- Identify the short-term high immediately preceding that low.
- Wait for price to break above the short-term high.
- Look for a retracement into what ICT calls an “optimal trade entry.”
The captions indicate that ICT demonstrates a Fibonacci placement using candle bodies around the most forceful part of the move. Because the chart itself is not encoded in the transcript, the precise anchors and resulting level cannot be reconstructed reliably from captions alone.
ICT also supplies an invalidation rule. At 13:23, he says that if price continues to a lower low after the Wednesday New York reference point, he abandons the bullish setup rather than continuing to force the original view.
Wednesday as the “line in the sand”
A central part of the lesson is how price behaves around the weekly open after midweek. At 19:29, ICT calls Wednesday the line in the sand. In a bullish profile, a move above the weekly open by Tuesday can still retrace to that level on Wednesday. Once price has moved above it during Wednesday, however, his preferred profile calls for expansion away from the open rather than another return.
He interprets a later pullback toward the opening price as evidence that the anticipated expansion may have failed, that the week may be reversing, or that it may remain in consolidation. These are scenario-management rules within ICT’s model, not universal market laws.
Bearish weekly profile
ICT introduces the inverse case at 26:07. With a bearish higher-time-frame premise, he looks for the weekly high to develop between Sunday and Wednesday, again emphasizing Tuesday’s London session through Wednesday morning in New York.
Here, movement above the weekly opening price is treated as a potential selling area. ICT’s illustrated sequence has price rise early in the week, establish a high, return through the opening level and then expand lower. He discusses relatively equal prior highs as possible locations of resting buy orders and relatively equal lows as possible objectives, but the transcript alone cannot confirm the exact chart prices or execution details.
Risk management discussed in the lesson
The video includes specific hypothetical distances for entries, stops and profit objectives. These figures are ICT’s examples rather than broadly validated parameters, and they should not be treated as recommendations. More generally, he argues for reducing exposure when a trade has moved materially in the anticipated direction rather than assuming the full target will always be reached.
At 32:26, ICT advocates taking partial profits because a weekly move can reverse before reaching its initial objective. He also acknowledges earlier in the lesson that setups can fail and that a trader may be stopped out even if the market later moves in the originally anticipated direction.
Educational interpretation
The most useful way to read this lesson is as a conditional planning template. It combines four questions: What is the higher-time-frame directional premise? Where is the weekly open? Did an early-week move occur against that premise? Has short-term structure subsequently turned back in the expected direction?
The framework also contains explicit conditions for standing aside, particularly when price does not expand away from the weekly open as expected after Wednesday. Anyone studying the idea can record every qualifying instance—including failures—rather than relying only on selected historical illustrations. Forex trading involves substantial risk, and this summary is educational commentary, not investment advice or a promise of performance.




