
How we researched this article
BestProps used document-based research from primary firm sources, checked September 25, 2026. The complete source list, scope, limitations, and commercial-state record appear near the end of this article.
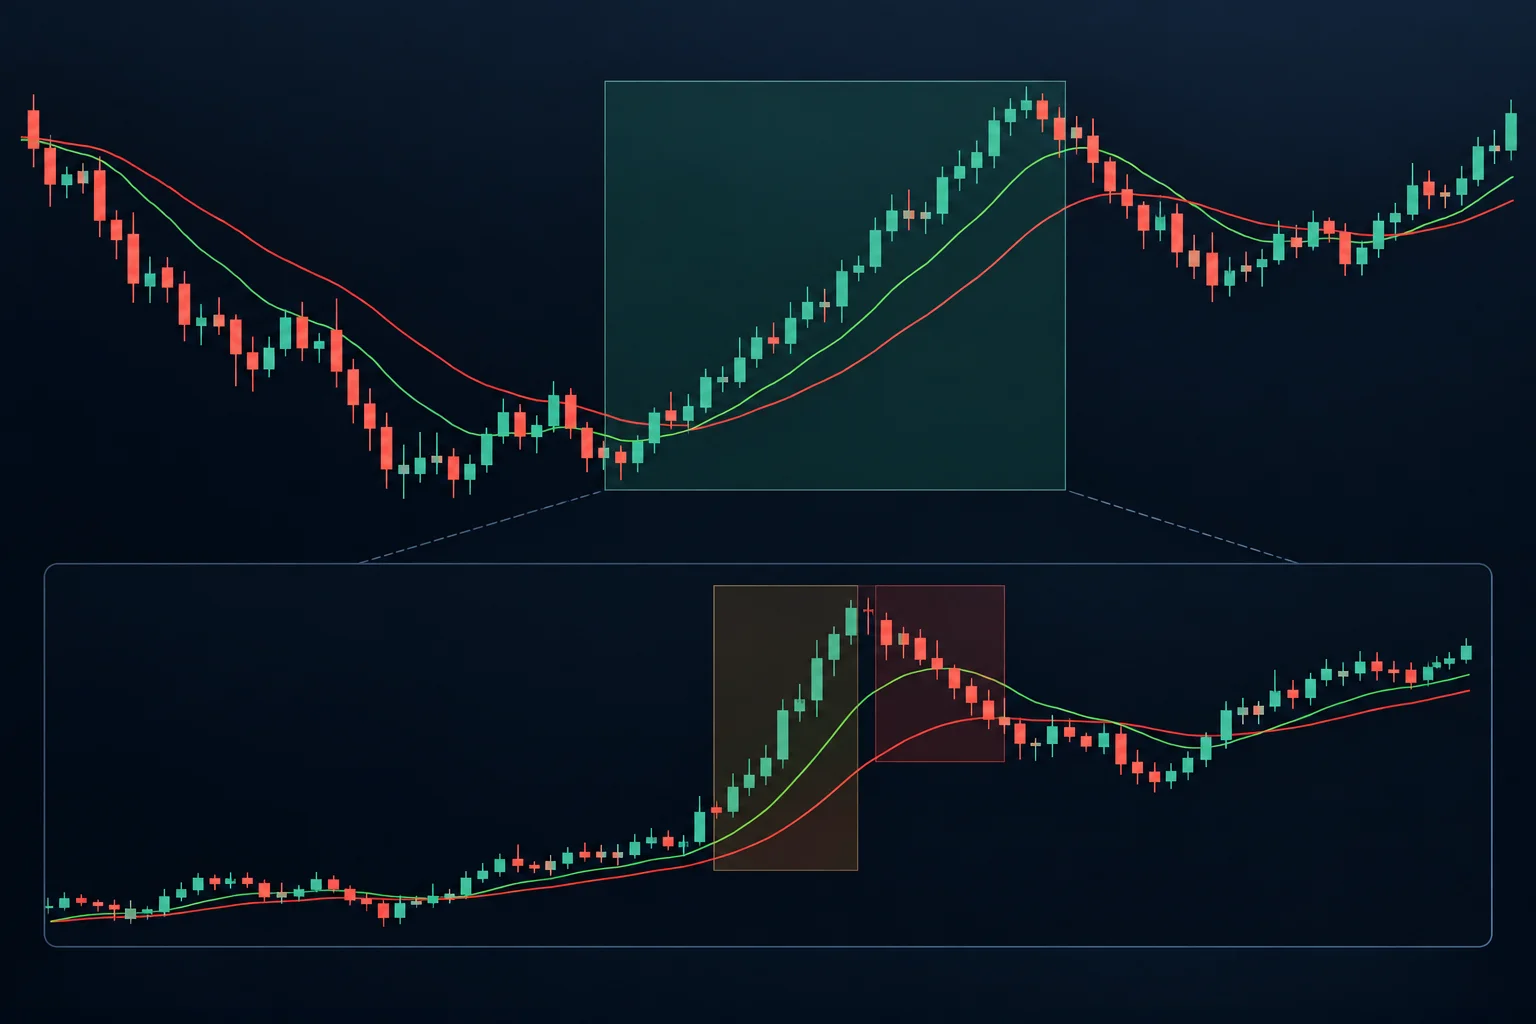
In the video ICT Forex – Secrets To Swing Trading, uploaded on December 19, 2017, ICT presents a top-down framework for filtering possible forex swing trades. The lesson uses a daily chart to define directional context and an hourly chart to search for retracements that fit that context.
The central idea is selectivity. ICT argues that a trader does not need to forecast the market’s direction every day. Instead, the framework is designed to identify occasional periods when higher-time-frame momentum appears clearer, then restrict swing-trade searches to that direction. This is ICT’s interpretation of market behavior, not evidence that the method provides a reliable or profitable edge.
The lesson’s two-time-frame structure
ICT introduces the lesson as a method for mapping buy and sell conditions and combining them with what he calls an “optimal trade entry.” He demonstrates the process with AUD/USD, while claiming it can be applied more broadly. The transcript does not provide evidence testing that wider claim.
At 2:40, he distinguishes directional movement from consolidation. His preferred sequence is a market leaving consolidation, showing a structural break, and developing momentum in one direction. Rather than requiring a daily prediction at all times, he proposes waiting on the sidelines when those conditions are absent.
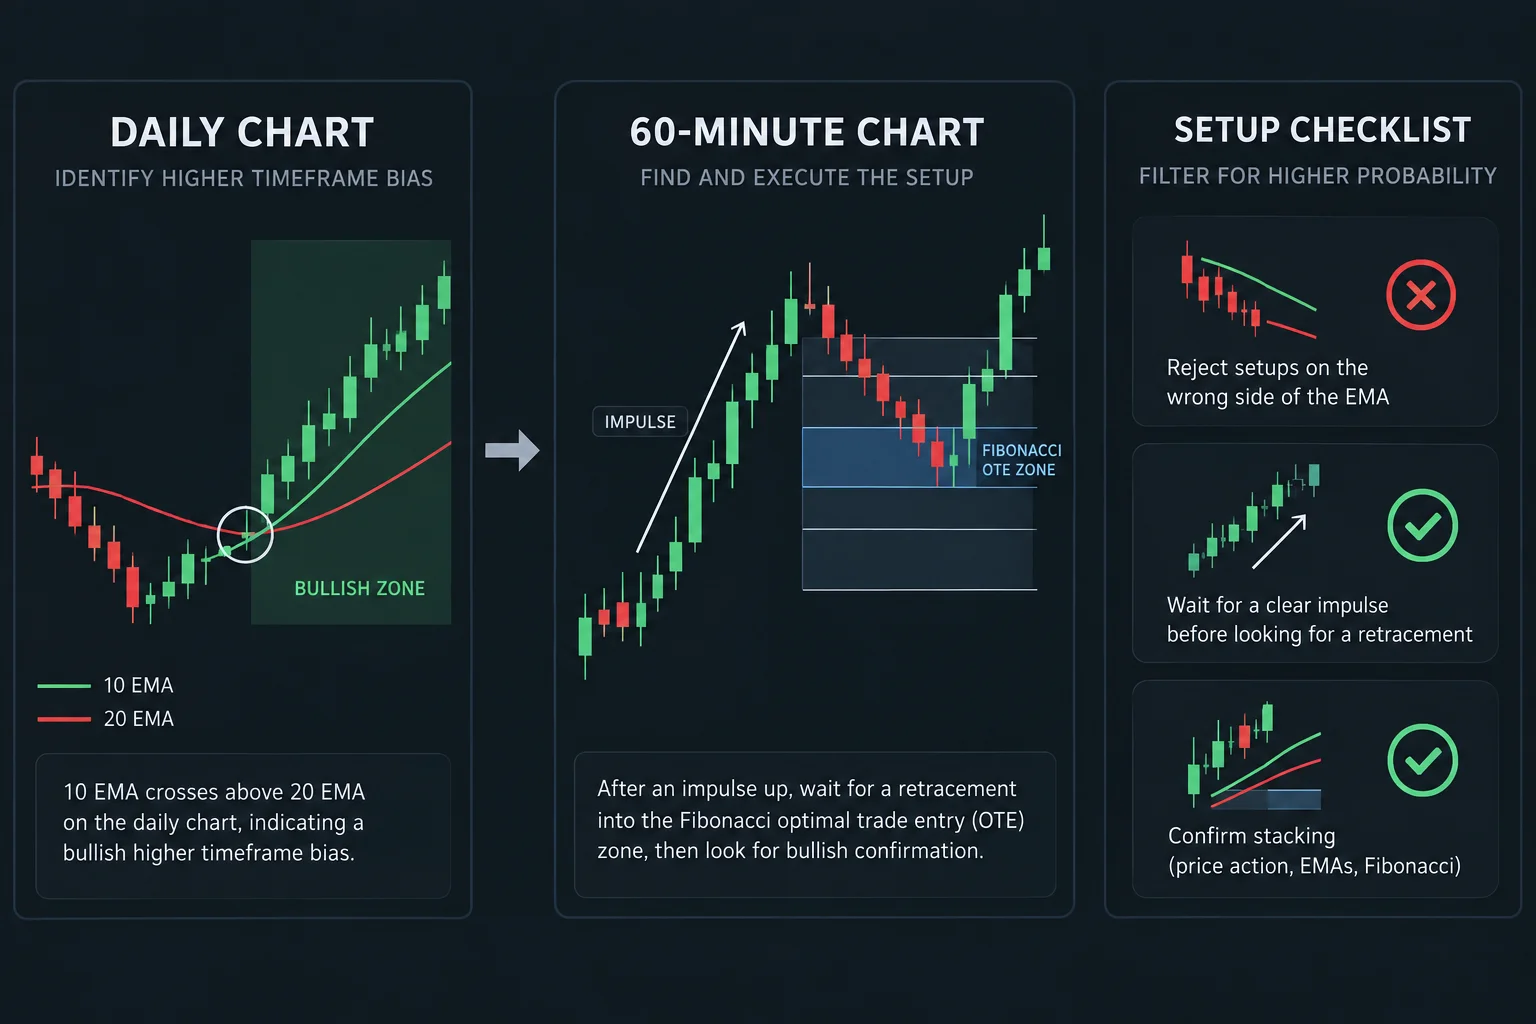
The workflow has two layers:
- Daily chart: Determine whether the swing-trading context is bullish, bearish, or unsuitable.
- One-hour chart: Look only for retracement setups aligned with the daily context.
The 10- and 20-period EMA filter
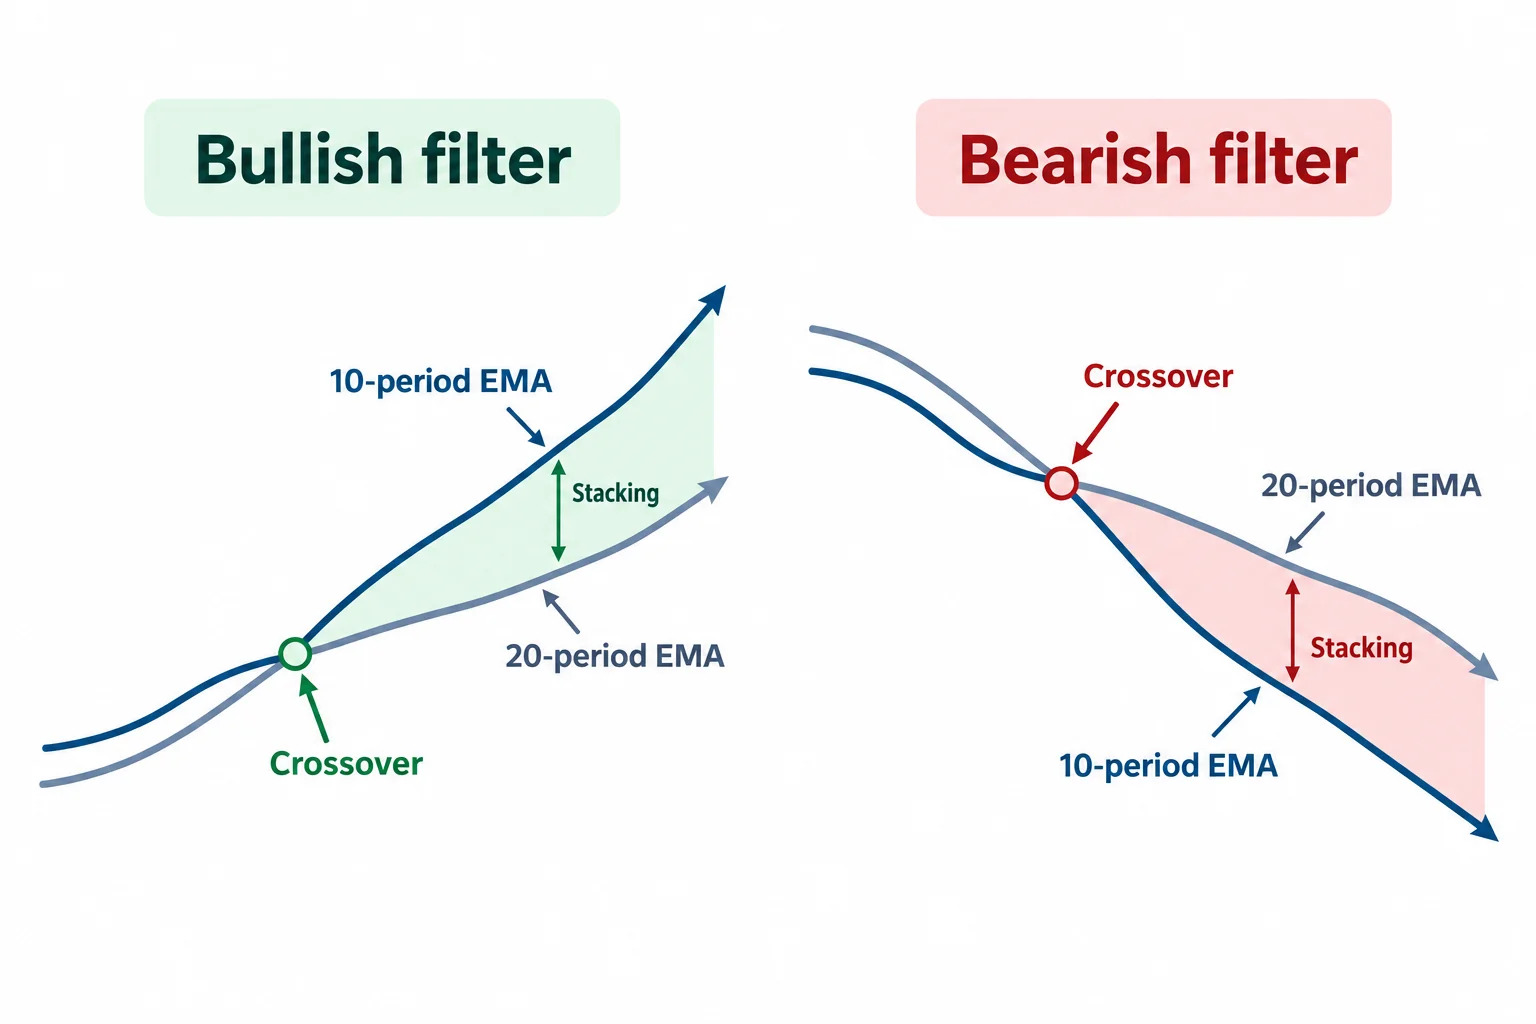
Beginning around 3:59, ICT introduces two exponential moving averages calculated from closing prices: a 10-period EMA and a 20-period EMA. Although he generally distances his teaching from indicator-dependent analysis, he describes these averages as a simple visual aid for recognizing direction.
The settings are stated clearly at 5:55. For the daily filter:
- A bullish condition begins when the 10-period EMA crosses above the 20-period EMA.
- A bearish condition begins when the 10-period EMA crosses below the 20-period EMA.
- The condition remains active until the averages cross in the opposite direction.
ICT gives additional weight to what he calls “stacking.” In a bullish condition, both averages point upward while the faster 10-period EMA separates above the 20-period EMA. In a bearish condition, both point downward while the 10-period EMA expands beneath the 20-period EMA. He explains this at 8:11.
ICT repeatedly limits this directional filter to the daily chart. He cautions against treating the same crossover as an equivalent signal on very short time frames. More generally, moving averages are lagging summaries of past prices; a crossover can describe an established move without predicting its continuation.
Filtering hourly swing-trade candidates
Once the daily condition is marked, ICT moves to a one-hour chart. During a bullish daily regime, he searches only for hourly long setups. During a bearish regime, he searches only for hourly short setups.
Bullish conditions
For a possible long setup, ICT wants price to move above the hourly 20-period EMA, form an upward impulse, and then retrace into his “optimal trade entry” area. At 8:59, he begins explaining how the hourly moving average filters out retracements that do not meet his criteria.
He allows hourly price to dip temporarily below the 20-period EMA during a retracement, provided the hourly 10-period EMA has not crossed below it. That exception applies to his hourly setup logic; it does not replace the daily directional filter.
Bearish conditions
The bearish process is the inverse. Starting around 16:56, ICT marks the period after the daily 10-period EMA crosses under the 20-period EMA. He then looks on the hourly chart for downward impulses and upward retracements while the faster average remains below the slower one.
The transcript refers repeatedly to Fibonacci-based “optimal trade entries,” body-to-body measurements, symmetrical price swings, and extension targets. However, it does not fully define every Fibonacci setting in this lesson, and generated captions render some of the associated terminology and numbers ambiguously. Those elements should therefore be understood as references to concepts taught elsewhere in ICT’s material, not as a complete standalone rule set here.
Trade frequency and position management
ICT emphasizes that swing setups are not expected every day. Near 16:34, he describes finding only a few candidates across a period of roughly several weeks in the displayed example. The practical lesson is that the filter intentionally rejects many price movements.
His management discussion favors taking partial profits while allowing a remaining portion to stay open. He advises against aggressively trailing a swing-trade stop while price is still consolidating. In his framework, stop adjustment is considered only after price demonstrates movement away from that consolidation. These are the speaker’s preferred tactics, not universally appropriate risk controls.
Near 24:59, ICT also distinguishes countertrend day trades from swing trades. A short-term move against the daily swing bias might still qualify under a separate day-trading model, but it would not qualify as a swing entry under the framework being taught.
Educational interpretation
The most transferable point is not that an EMA crossover predicts the next move. It is that a trader can define a hierarchy of conditions before evaluating an entry: establish higher-time-frame context, wait for lower-time-frame alignment, and reject setups that violate the chosen rules.
That structure may help make chart review more consistent, but it does not eliminate false signals, execution costs, gaps, or losses. ICT himself says near 24:31 that the approach is not perfect. The transcript also cannot independently verify the chart annotations, fills, targets, or results discussed in the presentation.
Watch the Full Lesson
If the embed does not load, watch on YouTube.
Related Resources
- Primary source: ICT Forex – Secrets To Swing Trading (YouTube, uploaded Dec 19, 2017)
- The Inner Circle Trader (official website) — ICT’s free library, mentorship content, and core teaching archive.
- The Inner Circle Trader on YouTube — Full lecture catalog including daily bias, optimal trade entry, and market structure series.
- ICT Trading Strategy playlist — Curated sequence covering daily bias, OTE, and swing trading concepts.




