
How we researched this article
BestProps used document-based research from primary firm sources, checked September 25, 2026. The complete source list, scope, limitations, and commercial-state record appear near the end of this article.
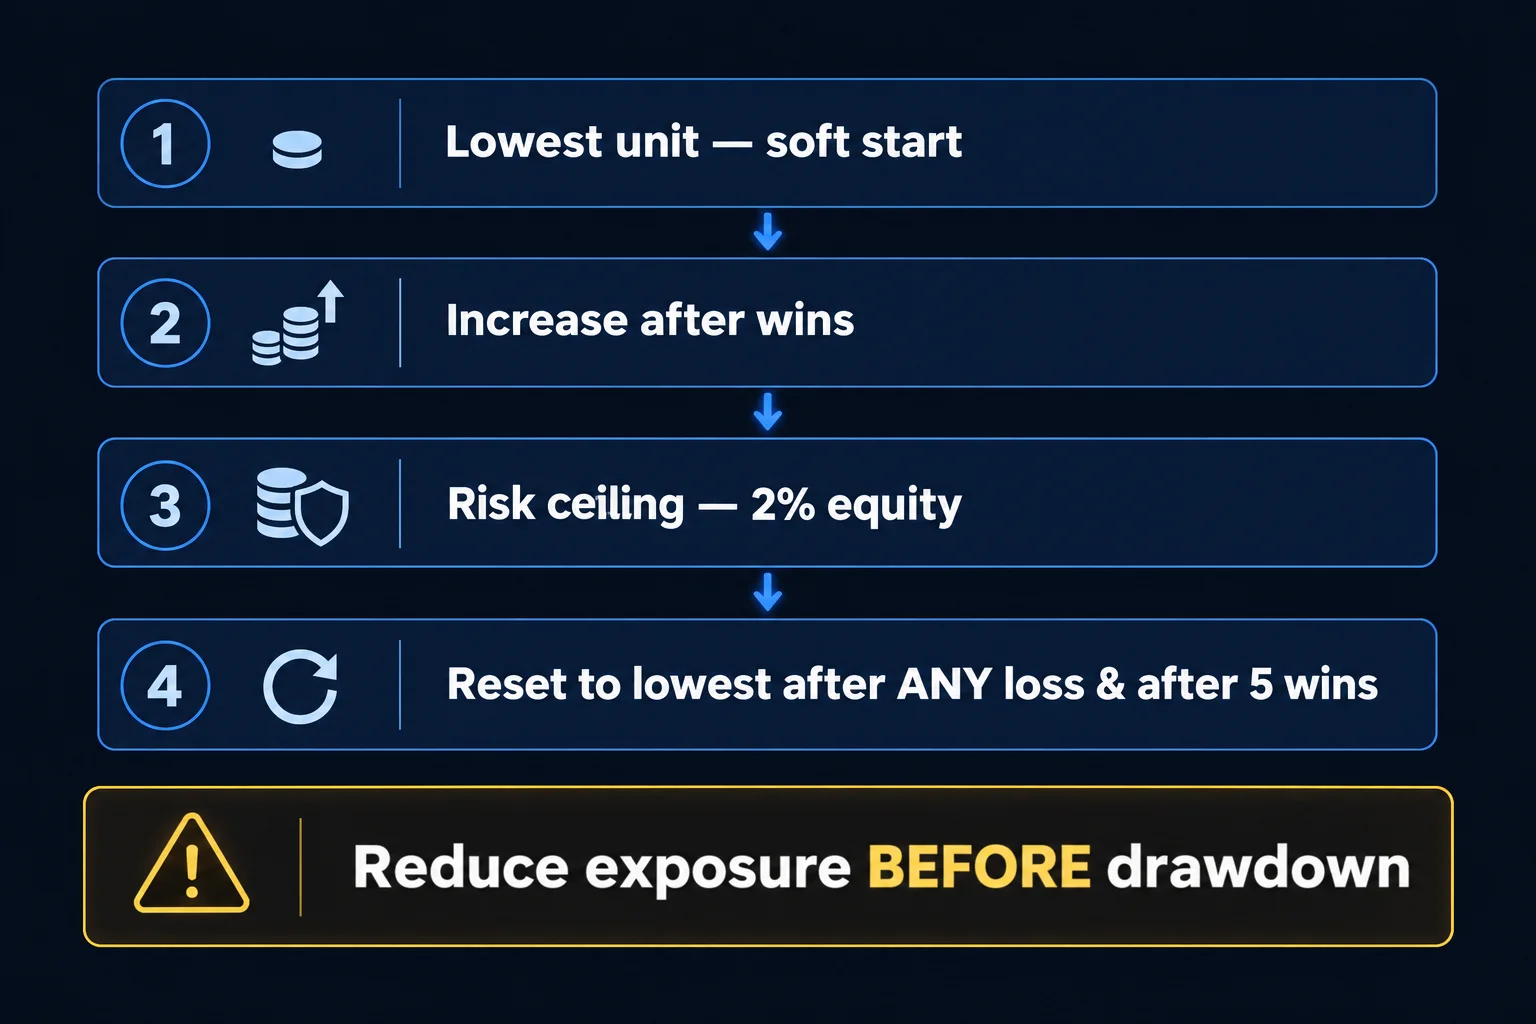
ICT’s December 12, 2017 forex lesson “Money Management That Works” presents a specific risk-sizing framework built on a single rule: reduce leverage after any loss, and after five consecutive wins. The lecture walks through a 20-trade hypothetical sequence to demonstrate how the rule limits drawdown compared to fixed-leverage trading. (0:22) The speaker emphasizes this is a money-management overlay, not an entry system. (0:58)
Core Rule: Reset After Loss, Reset After Five Wins
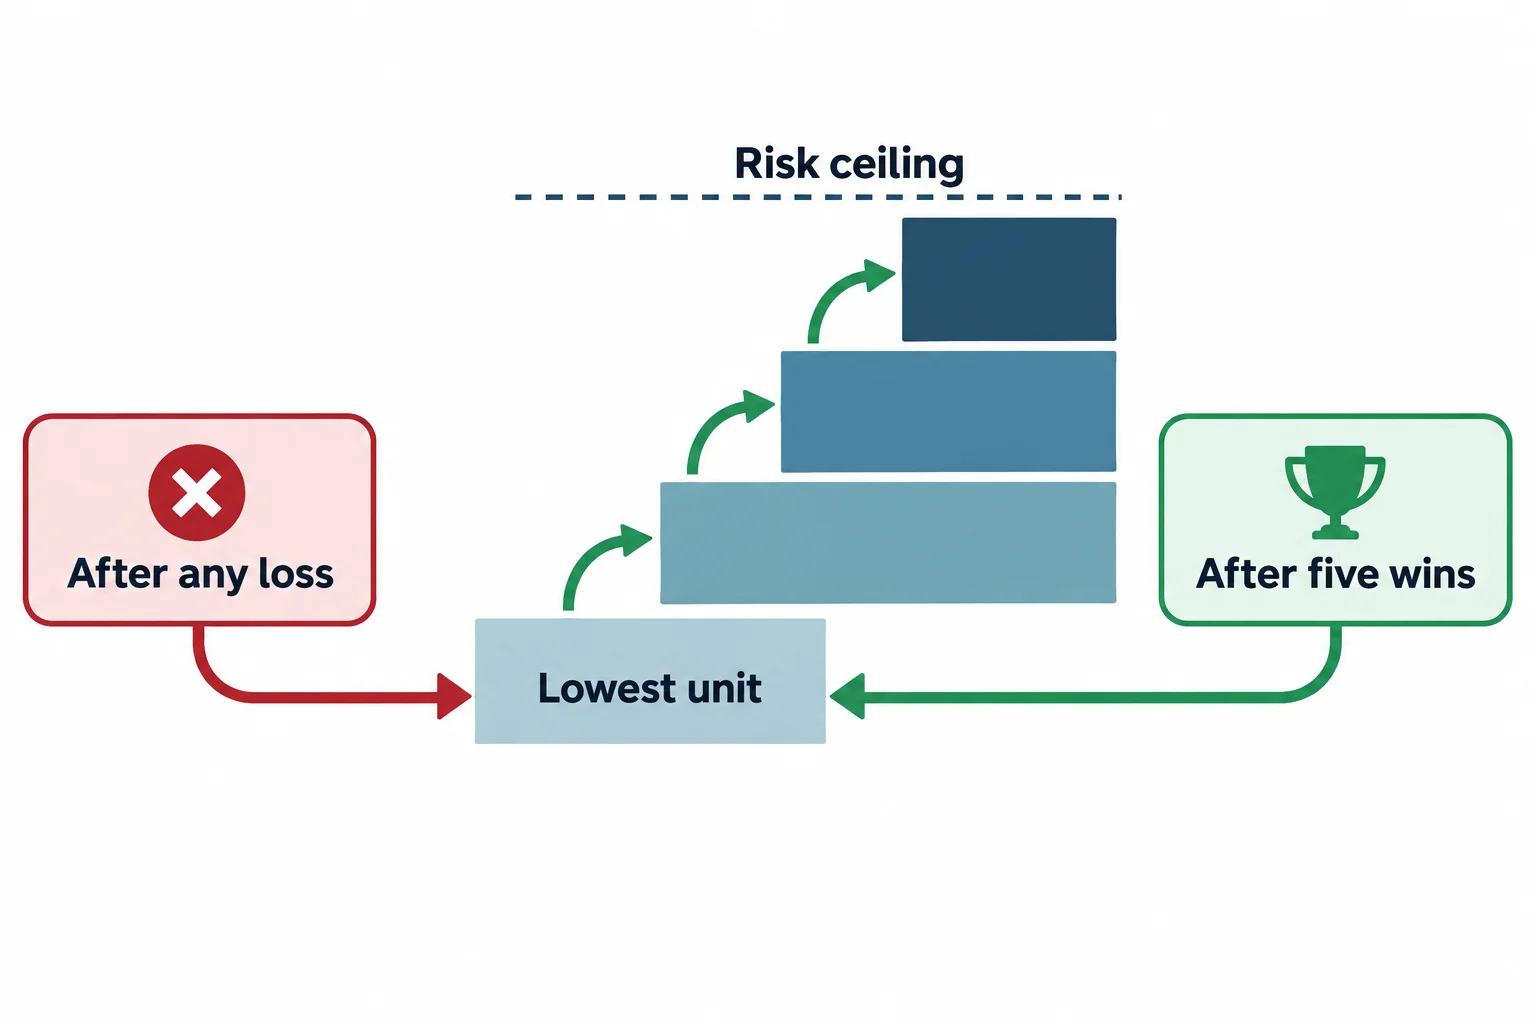
The model defines four leverage states, presented as a ladder:
- Lowest unit — soft start. Begin each cycle at the minimum position size (the speaker uses “one unit” as the baseline). (1:52)
- Increase incrementally after wins. After each winning trade, step up one unit. (2:18)
- Risk ceiling — e.g., 2% of equity per trade. The maximum unit corresponds to a predefined risk cap (the speaker cites 2% as an example). (2:45)
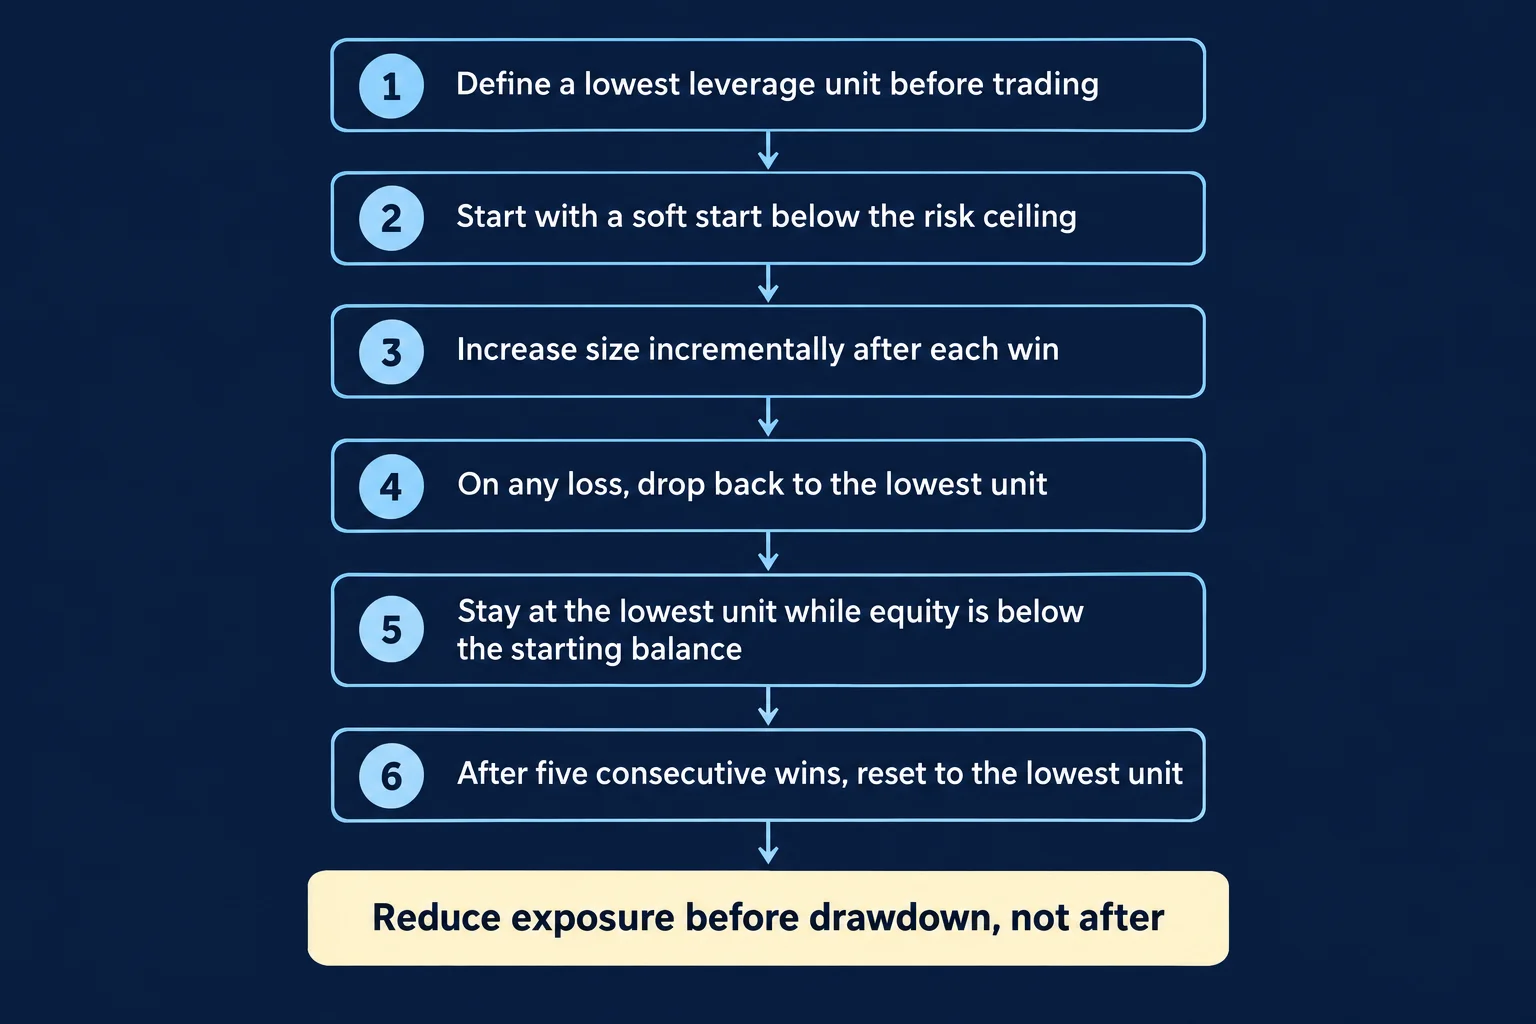
- Reset to lowest unit after ANY loss AND after 5 consecutive wins. A single loss forces an immediate return to the lowest unit. A streak of five wins also triggers a reset. (3:15) (5:42)
“Reduce exposure before drawdown, not after.” This line closes the ladder explanation and captures the philosophy: the reset rule is preventive, not reactive. (3:45)
Walk-Through: 20-Trade Hypothetical Sequence
The speaker runs a table of 20 hypothetical trades to show the rule in action. The sequence includes alternating wins and losses, a five-win streak, and a final loss. At each step the current unit, risk per trade, and running equity are shown. (4:20) Key observations from the demonstration:
- Fixed 2% risk on every trade (no reset rule) produces a deeper maximum drawdown in the same sequence. (8:00)
- The reset rule caps the unit at the ceiling, so risk never exceeds the predefined percentage. (5:15)
- After the five-win streak the model resets, avoiding the “press your luck” escalation that often precedes a large loss. (6:50)
- The hypothetical equity curve is a teaching illustration, not a verified track record. The speaker does not claim these are real trades or audited results. (0:55)
What the Lecture Does Not Claim
- No specific currency pair, timeframe, or entry method is required. The rule sits on top of whatever strategy the trader uses. (0:58)
- No profitability guarantee. The 20-trade example is a controlled illustration of drawdown mechanics. (0:55)
- No backtest statistics, win-rate data, or expectancy figures are provided in the recording. (9:00)
Video
Resources
- Primary source — ICT Forex: Money Management That Works (Dec 12, 2017)
- BabyPips — Position Sizing & Risk Management (third-party education)
- Investopedia — Drawdown Definition (third-party reference)
- CFTC — Fraud Awareness & Prevention (regulatory)





