
Key takeaways
ICT’s December 22, 2017 lesson uses Barchart weekly Canadian dollar and euro futures charts with roughly three years of data and the aggregated Commitment of Traders study to compare price structure and liquidity with commercials in red, large speculators in green, and small speculators in dark blue.
Read the full summary
ICT’s December 22, 2017 lesson uses Barchart weekly Canadian dollar and euro futures charts with roughly three years of data and the aggregated Commitment of Traders study to compare price structure and liquidity with commercials in red, large speculators in green, and small speculators in dark blue. Commercial positioning above zero is net long and below zero is net short, but ICT emphasizes unusually large buildups rather than zero crossings and warns that positioning shifts do not provide immediate reversal timing. At 4 minutes 42 seconds, he explains that Canadian dollar futures and USD/CAD have opposite orientations, so bearish Canadian dollar futures imply bullish USD/CAD and vice versa. His examples link rising commercial net-long exposure beneath similar lows with later rallies and heavy net-short exposure with declines, while euro commentary describes commercial accumulation below comparable lows and net shorts near the 1.20 area before movement toward 1.17. The preferred process is to identify a meaningful positioning extreme or transition, assess weekly structure, locate liquidity near prior or similar highs and lows, and use COT as contextual confirmation rather than a standalone entry signal. The framework may also apply to stock-index, bond, and commodity futures, but the caption transcript cannot independently verify chart levels, reactions, or results.
How we researched this article
BestProps used document-based research from primary firm sources, checked September 25, 2026. The complete source list, scope, limitations, and commercial-state record appear near the end of this article.
In ICT Forex – COT Insights For Effective Price Action Analysis, uploaded on December 22, 2017, ICT introduces a way to place Commitment of Traders (COT) positioning alongside weekly futures price action. The central lesson is not simply to trade whenever positioning crosses zero. Instead, ICT interprets substantial changes in commercial positioning in the context of price structure and liquidity.
The presentation uses Canadian dollar and euro futures as examples. Because the source is a generated caption transcript and does not expose the chart itself, the lesson can support a summary of ICT’s reasoning but not independent verification of the chart levels, market reactions, or trading results he describes.
Set Up COT Charts for Forex Price Analysis
ICT begins by outlining the module’s objectives: locating COT data, loading it in graph form, studying commercial hedgers, and considering how their positions might inform analysis. At 0:47, he demonstrates the process on the version of Barchart available at the time.
For the Canadian dollar example, he selects the futures contract with the largest open interest, changes the display to candlesticks, removes volume, and chooses a weekly chart covering approximately three years. He then adds the aggregated Commitment of Traders study and enlarges its panel. This is a description of a 2017 interface, so the present-day website may not use the same menus or labels.
At 2:27, ICT identifies three plotted groups:
- Commercials: shown as the red line in his chart.
- Large speculators: shown in green and described as funds or other large traders.
- Small speculators: shown in dark blue and associated in the lesson with smaller or retail participants.
ICT concentrates on the commercial line. His characterization of each participant group (and especially his broad criticism of small speculators) is his market interpretation, not a conclusion established by the transcript.
How ICT Reads COT Forex Positioning
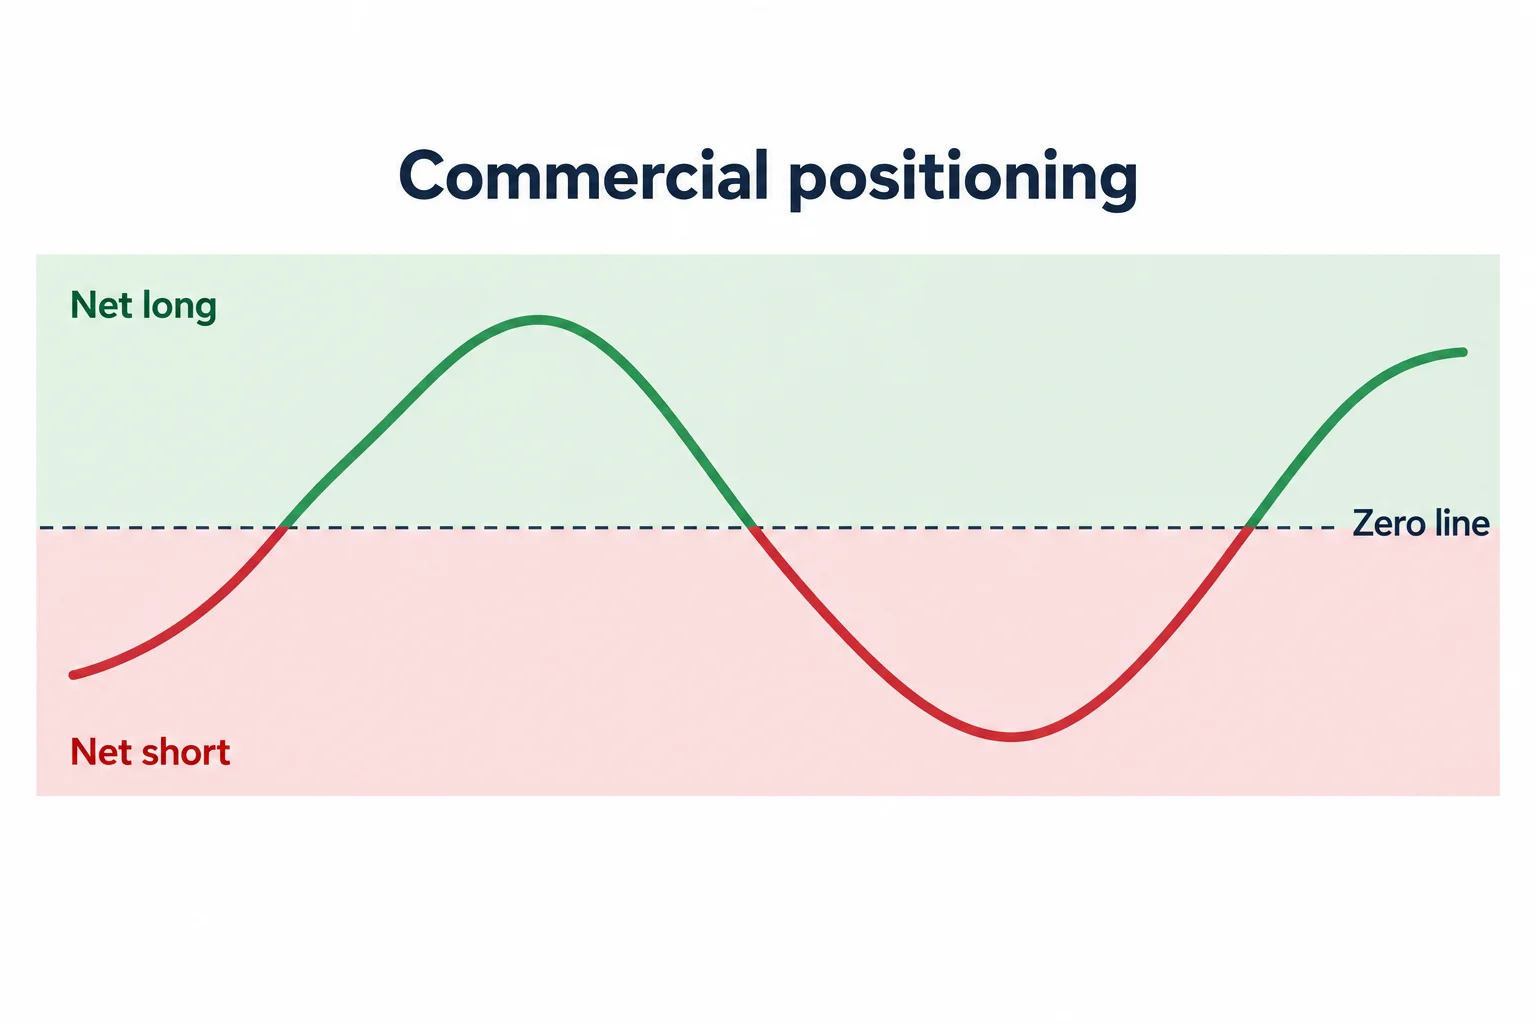
ICT draws attention to the indicator’s zero line at 3:11. In the framework presented, commercial positioning above zero is net long, while positioning below zero is net short. He is particularly interested in unusually large buildups on either side rather than minor fluctuations around zero.
Using the Canadian dollar futures chart, ICT points to historical periods where commercials accumulated large net-long positions and price later rallied. He also describes a case in which price moved beneath comparable prior lows while commercial net-long exposure increased, followed on the displayed chart by an upside move toward an older high. Later, he notes heavy net-short commercial positioning alongside a decline in Canadian dollar futures.
Compare Futures Direction With Forex Price Action
A practical distinction appears at 4:42. ICT explains that Canadian dollar futures and the USD/CAD forex pair are quoted in opposite orientations:
- A bearish interpretation for Canadian dollar futures corresponds to a bullish interpretation for USD/CAD.
- A bullish interpretation for Canadian dollar futures corresponds to a bearish interpretation for USD/CAD.
This conversion matters because reading futures positioning without accounting for the forex pair’s quote structure can reverse the intended directional interpretation. ICT says he looks for significant net-long positioning to support a long thesis in the relevant market orientation, or heavy net-short positioning to support a short thesis. The COT reading is therefore presented as contextual confirmation, not as a self-contained entry signal.
Euro COT Extremes and Forex Price Action
At 5:39, ICT switches to euro futures while retaining the weekly setup. He discusses commercial accumulation as price trades below similar lows, followed by movement above prior highs. He then describes commercials becoming net short around what the captions render as the “120 big figure,” after which the displayed market moves toward 1.17 and consolidates. Those levels are reported from the spoken commentary; the transcript alone cannot confirm their exact chart placement.
ICT’s broader point is that positioning extremes may help an analyst recognize what he calls maximum saturation among buyers or sellers. He attributes major market highs and lows to heavily capitalized commercial participants. That is ICT’s interpretation of the examples, not proof that commercial extremes consistently identify reversals.
Why COT Zero Crossings Need Price Action
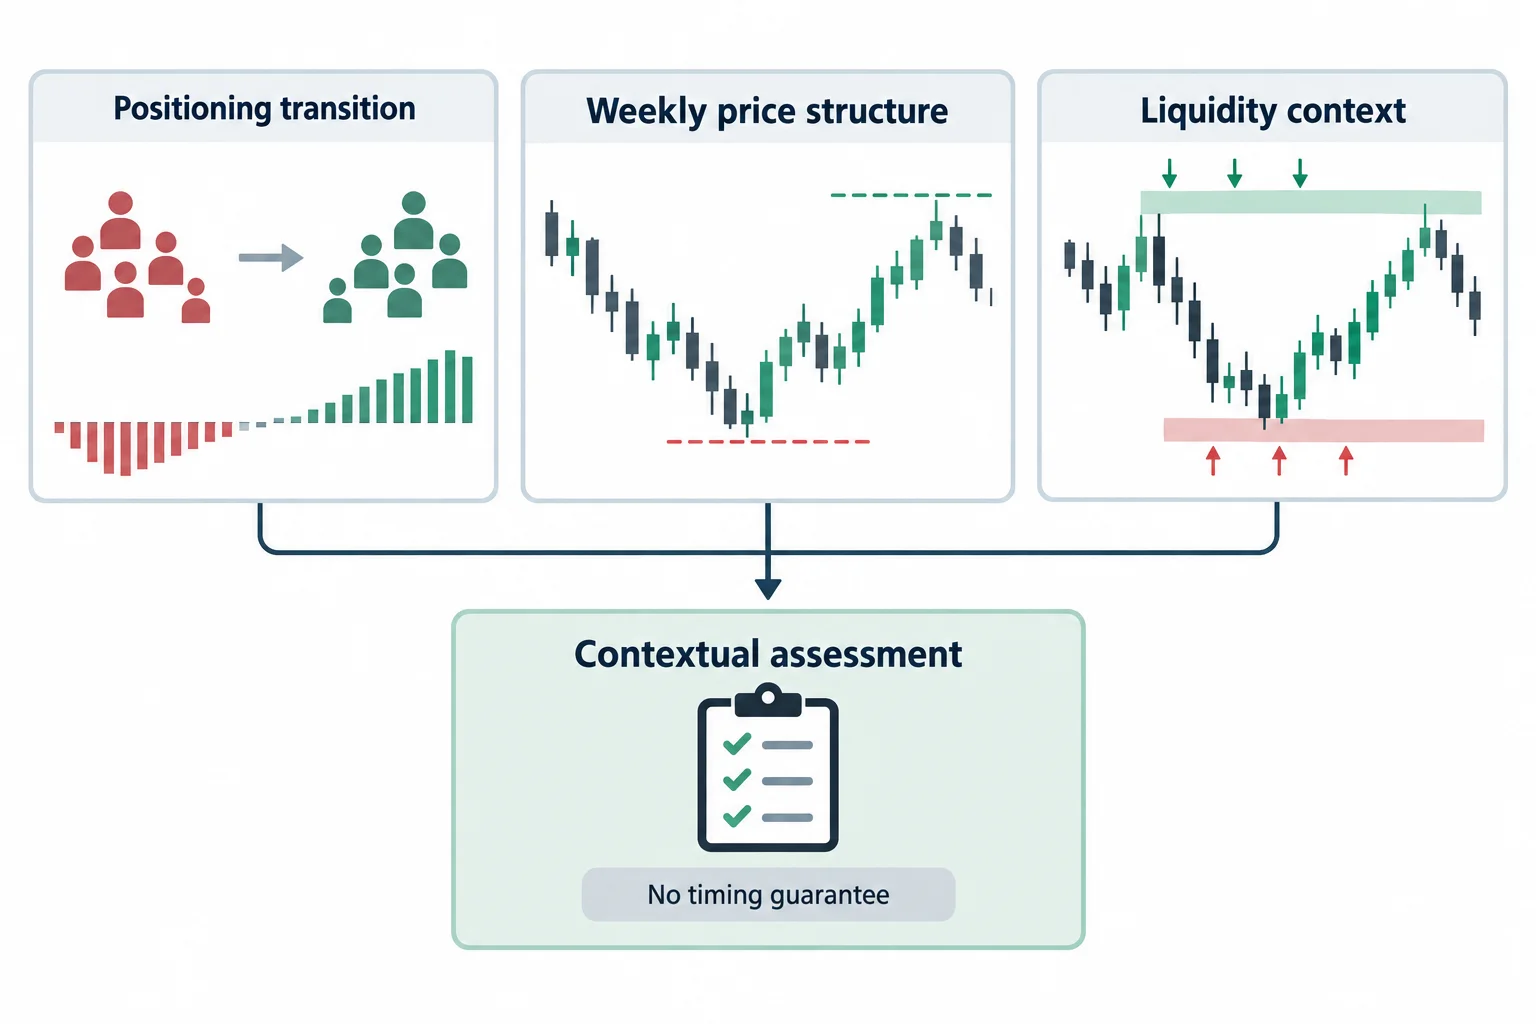
The most important qualification begins around 7:29. ICT warns that a move from net long to net short does not, by itself, establish an immediate directional change. Commercials may be selling during a continuing rally, and price may keep moving before the anticipated turn.
He recounts initially assuming that a switch to net short should mark a top immediately. In the lesson, he says that view overlooked what he calls institutional order flow and the need for liquidity to be reached first. His preferred sequence is therefore more contextual:
- Identify a meaningful commercial positioning extreme or transition.
- Assess weekly price structure rather than reacting only to the indicator.
- Look for liquidity around prior or similar highs and lows.
- Treat positioning as more noteworthy when it aligns with that price-action narrative.
“Institutional order flow” and liquidity are used here in ICT’s own analytical vocabulary. The transcript offers a conceptual explanation but no formal rules that would make these ideas independently testable.
Effective ICT Forex COT Takeaways
ICT closes by describing the video as an introductory lesson and says COT analysis can also be considered in stock-index, bond, and commodity futures. The most defensible general takeaway is that COT data can provide a higher-time-frame view of participant positioning, while price action supplies the context needed to interpret it. A net-long or net-short reading alone does not reveal timing, guarantee a reversal, or document an executable trade.
Watch the complete primary source on YouTube: ICT Forex – COT Insights For Effective Price Action Analysis. This summary is educational commentary on the transcript, not investment advice or a promise of performance.




