
Key takeaways
ICT’s framework anticipates potential forex volatility expansion through three observations, CFTC Commitments of Traders data tracked for 12-month commercial net-position extremes as longer-term reversal warnings, shrinking weekly open-to-close candle bodies, and shrinking daily bodies relative to the previous five to seven trading days.
Read the full summary
ICT’s framework anticipates potential forex volatility expansion through three observations, CFTC Commitments of Traders data tracked for 12-month commercial net-position extremes as longer-term reversal warnings, shrinking weekly open-to-close candle bodies, and shrinking daily bodies relative to the previous five to seven trading days. The Power of Three model requires an independently formed directional bias because contraction indicates possible magnitude and velocity, not direction, timing, entry, stop, or target. Under a bullish bias ICT watches for movement below or near the weekly open before upward expansion, while under a bearish bias he watches for an initial rally above the open before downward expansion. Wicks are disregarded, so ICT’s body-based inside day can qualify even when a wick exceeds the prior range, unlike a conventional full-range inside day. EUR/USD examples are historical illustrations, not a controlled forward test with verified fills or outcomes, and the material is educational commentary, not investment advice.
How we researched this article
BestProps used document-based research from primary firm sources, checked September 25, 2026. The complete source list, scope, limitations, and commercial-state record appear near the end of this article.
In ICT Forex – How To Find Explosive Price Moves Before They Happen, ICT presents a framework for anticipating when a forex market may shift from quiet trading into a larger range. The lesson does not offer a mechanical prediction system. Instead, it combines longer-term positioning context with contraction in weekly and daily candle bodies.
The three stated areas of focus are Commitments of Traders positioning, weekly range contraction, and daily range contraction. ICT’s central interpretation is that quieter price action can precede expansion, while directional context must come from a separate analysis. The transcript does not establish that every contraction produces an immediate move or that its direction can be known from contraction alone.
How ICT Forex Uses Trader Positioning
ICT begins with a line graph derived from weekly trader-position data. At 00:44, he says that his attention is primarily on the line representing commercial participants. He monitors whether their net position has reached its highest or lowest level of the preceding 12 months.
In ICT’s interpretation, these positioning extremes may provide an early warning of a possible long-term reversal. He uses the zero line to distinguish net buying from net selling and contrasts commercial positioning with large speculators, whom he characterizes as more trend-following. This is presented as ICT’s market model, not proof that either group consistently forecasts price.
The purpose is to add context to higher-time-frame support and resistance. In the euro example discussed in the lesson, ICT associates strong commercial buying during a decline with a potentially important support area. Later, he notes that the commercial line had moved below zero and treats that as a warning of a possible bearish longer-term shift. Because the source is an audio transcript of a chart presentation, it does not provide enough visible data to independently verify the plotted positions, levels, or subsequent outcome.
How ICT Forex Finds Weekly Price Contraction
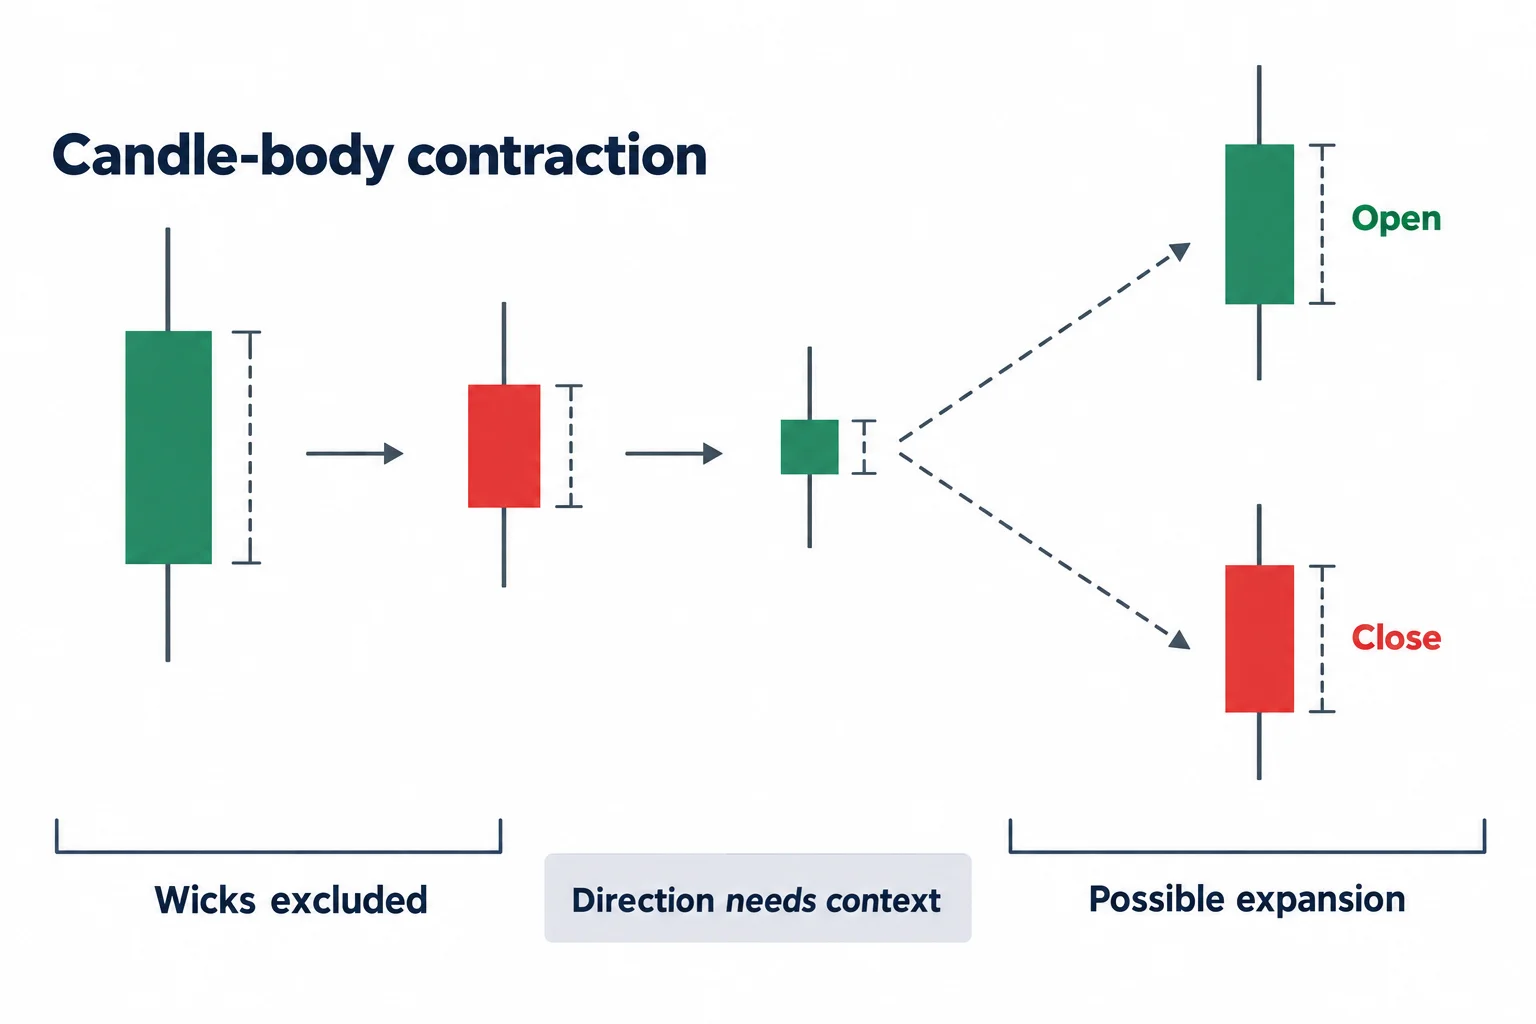
The second section starts at 05:44. ICT connects contraction with his “Power of Three” terminology. Under a bullish bias, he describes looking for price to move below or near the weekly open before expanding upward. Under a bearish bias, he describes an initial rally above the open followed by downward expansion.
A crucial limitation is stated in the lesson: this approach assumes the trader already has a directional bias and expects range expansion. A small candle body is therefore being used to anticipate increased movement, not to determine direction by itself.
ICT measures contraction through the distance between a candle’s open and close. He explicitly says to disregard the wicks for this particular study. His weekly process can be summarized as follows:
- Compare recent weekly candle bodies rather than focusing on the full high-to-low range.
- Identify bodies that are becoming noticeably smaller.
- Treat that compression as a condition in which a larger body or sequence of larger moves may follow.
- Use a separately formed directional view to decide whether bullish or bearish expansion is being considered.
- Avoid chasing a market only after it has already expanded.
At 08:14, ICT restates the weekly idea: he is looking for compressed ranges with small bodies and then watching for expansion. The examples described include small-bodied candles around swing points followed by larger weekly moves. These are illustrative chart selections, not a complete historical test.
How ICT Forex Finds Daily Price Contraction
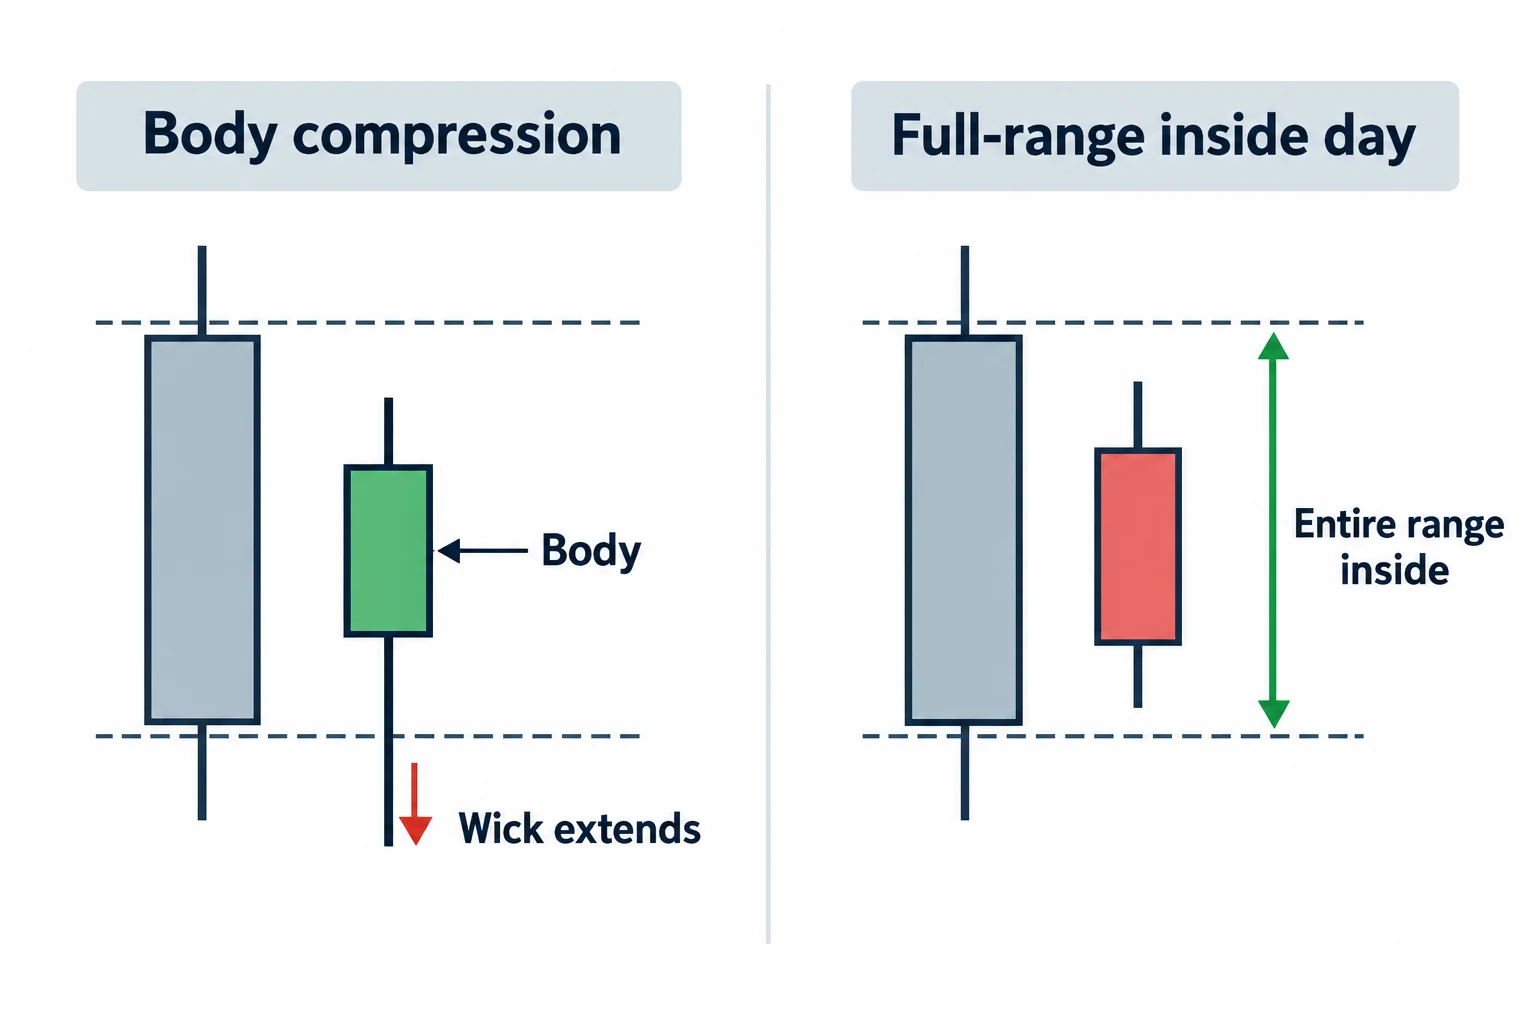
At 10:43, ICT transfers the same body-based analysis to the daily chart. His use of “inside day” differs from the conventional full-range definition described in the transcript. A candle may qualify in his framework when its body is compressed even if a wick extends beyond the preceding day.
This distinction matters because ICT is not measuring whether the entire daily range sits inside the prior range. He is evaluating compression between the open and close. Listeners applying the lesson should therefore avoid confusing his body-relative usage with a strict high-and-low inside-day pattern.
Compare Five to Seven Days for Price Contraction
ICT gives a practical comparison window at 12:48. On a daily chart, he looks back approximately five to seven trading days and asks whether current bodies are small relative to recent large ones. Five days represent a typical trading week in his explanation, while seven allows the comparison to extend farther into the prior week.
The resulting checklist is straightforward:
- Review the most recent five to seven daily candles.
- Compare their open-to-close bodies.
- Mark unusually small or progressively contracting bodies.
- Form directional context independently rather than deriving it from compression.
- Watch for potential range expansion without assuming its timing or magnitude is guaranteed.
What ICT Forex Price Signals Can and Cannot Show
Near 14:16, ICT explains that he wants to assess not only where price might move, but also when greater magnitude and velocity may become possible. His broad thesis is that periods of quiet trading can help a trader prepare before expansion attracts widespread attention.
A cautious educational interpretation is that candle-body contraction can serve as a volatility watch condition. It does not, on its own, supply an entry, stop level, target, or reliable directional forecast. The transcript also does not reveal actual fills, complete chart values, or what happened after the recording. Traders reviewing this framework would still need explicit risk controls and a way to evaluate false or delayed expansions. This article summarizes ICT’s teaching and is not investment advice or a claim of profitability.




