
Key takeaways
ICT’s Forex Power of Three interprets any OHLC interval as accumulation near the opening price, manipulation through a nearby high or low opposite the expected move, and distribution in the anticipated direction.
Read the full summary
ICT’s Forex Power of Three interprets any OHLC interval as accumulation near the opening price, manipulation through a nearby high or low opposite the expected move, and distribution in the anticipated direction. For a bullish premise, ICT looks for buying near or below the open, a decline through a recent low that triggers long stops and breakout shorts, then expansion toward an old high where buy stops and breakout longs may provide liquidity for exits. For a bearish premise, he describes shorts forming near or above the open, a rise through recent or equal highs that triggers short stops and breakout buying, then expansion toward an old low where shorts may be covered. The framework begins at 2 minutes 13 seconds, opening-price logic at 5 minutes 22 seconds, the bullish example at 6 minutes 33 seconds, and the bearish model at 11 minutes 44 seconds. It is a market narrative rather than a complete trading system because the lesson supplies no objective directional-bias, consolidation, risk, invalidation, order-book, execution, profitability, or testing evidence, and a liquidity sweep does not guarantee reversal.
How we researched this article
BestProps used document-based research from primary firm sources, checked September 25, 2026. The complete source list, scope, limitations, and commercial-state record appear near the end of this article.
In the video ICT Forex – Accumulation – Manipulation – Distribution, ICT presents what he calls the “Power of Three”: a framework for interpreting a price range as a sequence of accumulation, manipulation and distribution. His central idea is that the opening price provides a reference point for anticipating how a bullish or bearish candle may develop.
This lesson is best understood as an explanation of ICT’s market interpretation, not as proof that markets always follow this sequence. The transcript contains conceptual examples, but it cannot verify the unseen charts, executions or profitability of applying the model.
ICT Forex Power of Three Model
ICT introduces the lesson’s three-part structure at 2:13:
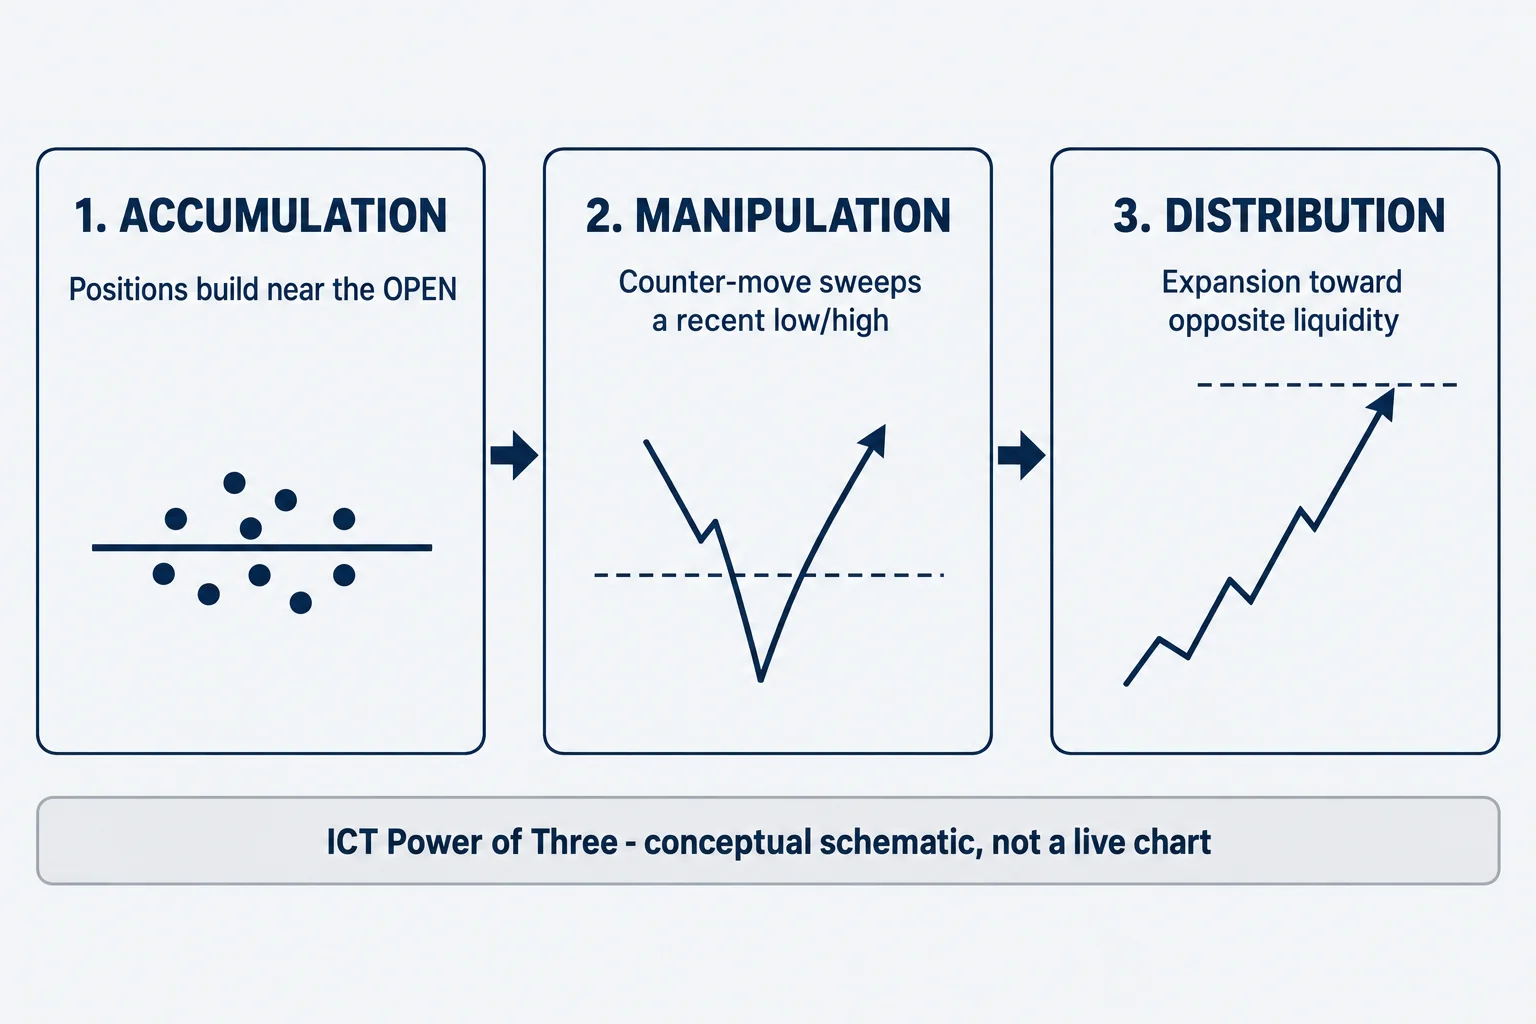
- Accumulation: positions are described as being built near the opening price.
- Manipulation: price initially moves in the direction opposite the anticipated expansion, often crossing a nearby high or low.
- Distribution: price expands in the anticipated direction, allowing positions to be unwound against orders around prior highs or lows.
Although ICT illustrates the idea with daily open-high-low-close bars, he says it can be considered on any charted interval that has an opening value, high, low and closing value. That is a claim about how he applies the framework, not evidence that its behavior is identical across every market or timeframe.
Why Opening Price Matters in the ICT Forex Model
Beginning at 5:22, ICT defines the open as the initial reference value before the range’s proposed imbalance. The close is the ending value after that movement, while the distance between open and close represents range expansion.
In practical terms, the model starts with a directional premise. If the analyst expects a bullish close, ICT looks for buying near or below the open before an expansion higher. If the premise is bearish, he looks for short positioning near or above the open before an expansion lower. The initial directional premise is therefore essential: the pattern itself does not independently establish whether the session should be treated as bullish or bearish.
Bullish ICT Accumulation Manipulation and Distribution
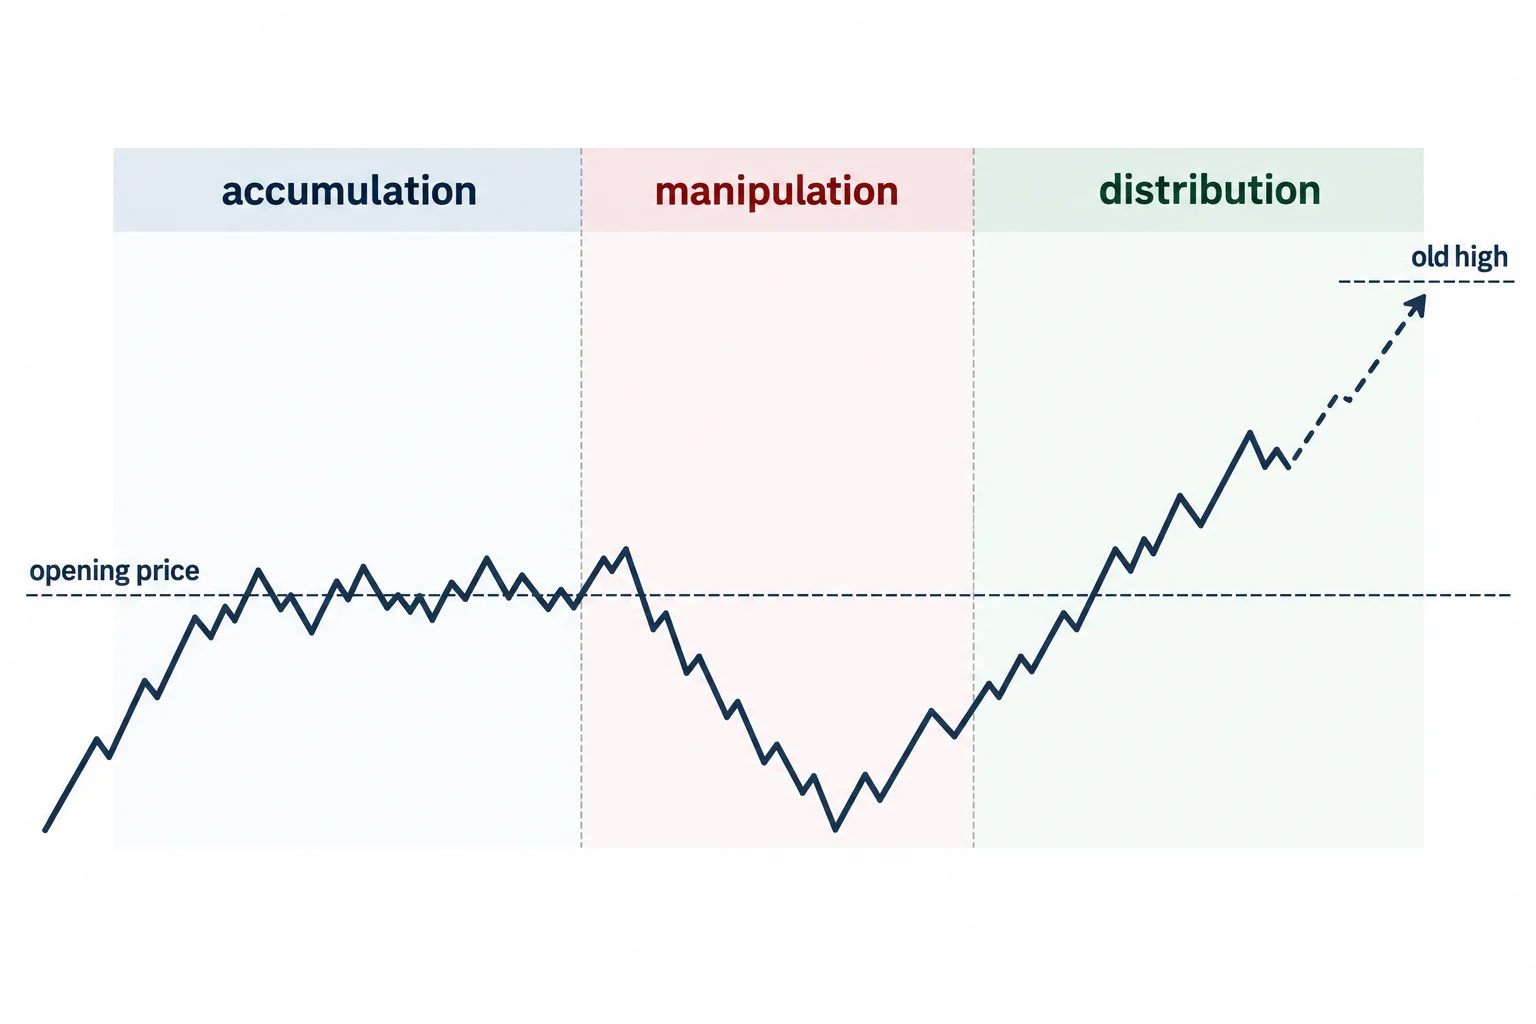
ICT’s bullish example begins at 6:33. He describes accumulation as long positions forming around the opening price. The proposed manipulation phase is then a quick decline below the open or below a recent low.
Under ICT’s interpretation, that decline can interact with two groups of orders:
- Sell stops belonging to traders who were already long.
- New sell orders from traders treating the break of a low as bearish continuation.
ICT argues that these sell orders can provide counterparties for larger buying interest. Price then reverses and expands upward in the distribution phase. Near an old high, breakout buying and buy stops may provide liquidity for holders of long positions to sell.
At 15:12, he restates the visual sequence as consolidation near the open, a decline below that consolidation and a subsequent move higher. The temporary decline is what ICT labels manipulation because it creates bearish sentiment immediately before the anticipated bullish expansion.
Bearish ICT Accumulation Manipulation and Distribution
The bearish model, introduced at 11:46, reverses the sequence. ICT describes short positions accumulating around or above the opening price. Price then moves above a recent high, where it may trigger:
- Buy stops used to exit existing short positions.
- New buy orders from traders interpreting the higher high as a bullish breakout.
In ICT’s explanation, larger sellers take the other side of those orders before price expands lower. The eventual move beneath an old low supplies sell-side orders against which short positions may be covered.
His chart discussion at 16:56 describes a consolidation followed by a rise through equal or previous highs. ICT interprets that rise as the manipulation phase rather than confirmation of strength. The bearish distribution phase follows if price reverses and moves toward lower liquidity.
ICT Forex Liquidity in Accumulation and Distribution
A major theme of the lesson is that every transaction requires another participant on the opposite side. ICT uses terms such as “engineering liquidity,” “neutralizing liquidity” and “pairing orders” to explain why price might cross conspicuous highs and lows before reversing.
Within this framework, an old low can attract both protective sell stops and breakout shorts, while an old high can attract protective buy stops and breakout longs. ICT associates these concentrated orders with potential turning areas. However, the transcript does not provide order-book data demonstrating who placed the orders or whether a particular move was deliberately engineered.
How to Use the ICT Forex Model Carefully
The video offers a narrative for studying candle formation rather than a complete trading system. It does not provide objective rules for determining directional bias, defining a valid consolidation, measuring acceptable risk or invalidating a setup. It also does not establish that every sweep of a high or low will reverse.
A neutral educational reading of the model is:
- Choose a defined interval and mark its opening price.
- Form a separately justified bullish or bearish hypothesis.
- Observe whether price first moves against that hypothesis and crosses a nearby liquidity reference.
- Look for expansion in the hypothesized direction rather than assuming the first sweep guarantees reversal.
- Review failed as well as successful examples to avoid selecting only charts that fit the narrative.
The most useful distinction is between description and prediction. Accumulation, manipulation and distribution can be used to organize observations after a range has formed, but anticipating that sequence in real time introduces uncertainty. The video explains ICT’s interpretation of the pattern; it does not document fills, testing results or a guaranteed market mechanism.
Related resources
- ICT Forex – Accumulation – Manipulation – Distribution (primary video)
- Open-high-low-close (OHLC) chart reference (Wikipedia)
- TradingView Bar Replay Guide (official documentation)
- CFTC Learn & Protect: Advisories & Fraud Awareness (regulatory)
This commentary is for education only and is not investment advice.




