
Key takeaways
ICT Charter Price Action Model 3 is a top-down swing-trading framework that anticipates monthly range expansion toward daily liquidity at equal highs, equal lows, or prior swing points.
Read the full summary
ICT Charter Price Action Model 3 is a top-down swing-trading framework that anticipates monthly range expansion toward daily liquidity at equal highs, equal lows, or prior swing points. Its stage filter takes the highest and lowest commercial Commitment of Traders net-position readings from the preceding 12 months and splits the range at the midpoint, treating readings above it as bullish and below it as bearish rather than using the conventional zero line. Bearish setups target daily equal lows or an old low, while bullish setups target equal highs or a prior high, with 20-, 40-, and 60-trading-day lookbacks used to find liquidity. Entries seek an optimal trade entry retracement refined from monthly, weekly, and daily charts to four-hour or hourly swings, preferably Monday through Wednesday near London or New York opens, with smaller swings allowing tighter invalidation. Monthly direction need not predict the close because one weekly expansion can satisfy the model even if the candle later reverses. Overlapping negative Fibonacci extensions are scaling references only when aligned with prior highs or other liquidity. Canadian-dollar futures and USD/CAD require inverted interpretation, with Canadian-dollar weakness corresponding to USD/CAD strength. If no clear next-month expansion can be framed, ICT recommends setting Model 3 aside for a shorter-term framework, while the lecture remains a retrospective educational outline without verified fills, independently validated performance, or investment advice.
How we researched this article
BestProps used document-based research from primary firm sources, checked September 24, 2026. The complete source list, scope, limitations, and commercial-state record appear near the end of this article.
How ICT Price Action Model 3 Targets Liquidity
In ICT Charter Price Action Model 3: Amplified Lecture, ICT presents a swing-trading framework built around an anticipated expansion of the monthly range toward liquidity identified on the daily chart. The lecture assumes familiarity with his broader mentorship terminology, so it functions more as a model outline and extended example than as a self-contained introduction.
ICT identifies the model’s primary objective at 1:17: targeting daily liquidity pools. In his terminology, these commonly appear around equal highs, equal lows, or conspicuous prior swing points where he expects stops to be clustered. These areas serve as the proposed directional draw rather than an automatic entry signal.
ICT Charter Price Action Model 3 Framework
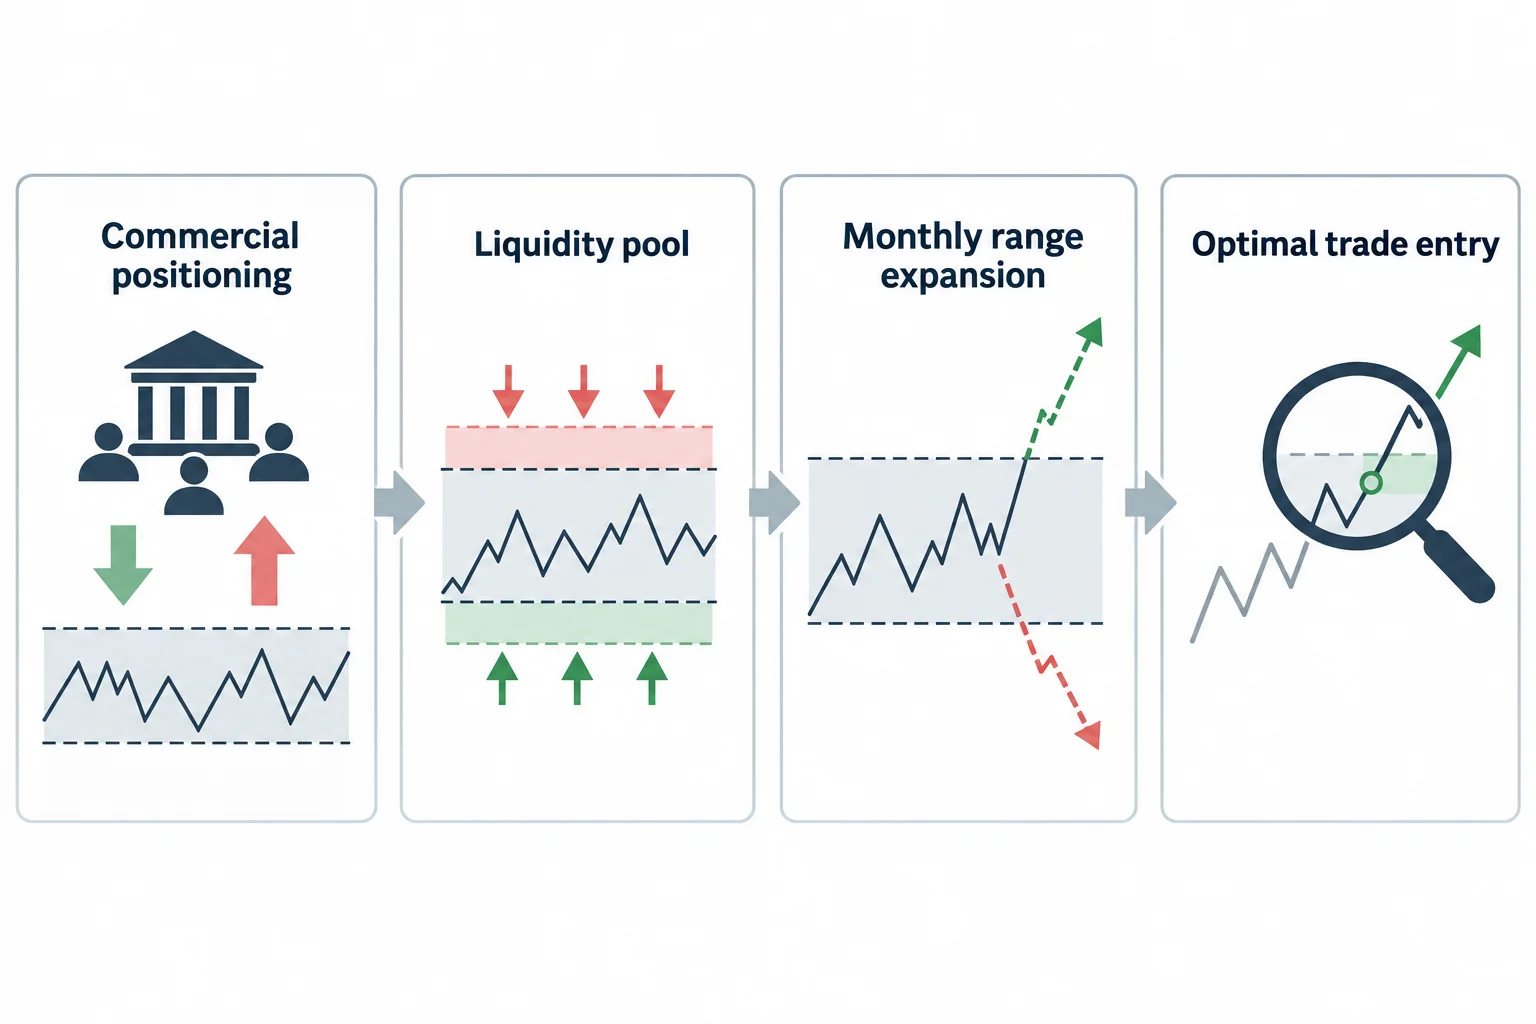
The lecture organizes the method into several layers:
- Stage: ICT’s interpretation of commercial positioning in Commitment of Traders data.
- Directional objective: a daily-chart liquidity pool above or below the market.
- Higher-time-frame context: an expected monthly range expansion toward that pool.
- Entry pattern: what ICT calls an optimal trade entry, potentially refined on four-hour or hourly charts.
ICT COT Hedging Program
Beginning at 2:36, ICT describes a custom treatment of commercial COT net positioning. He takes the highest and lowest commercial net-position readings from the preceding 12 months and divides that range at its midpoint. A reading above the midpoint is interpreted by ICT as a bullish commercial program; one below it is interpreted as bearish.
This is not the same as simply asking whether commercial positioning is above or below the conventional zero line. During the later update, ICT demonstrates how he constructs his own midpoint reference from the observed 12-month range. That explanation begins around 32:10.
The transcript supports describing this as ICT’s analytical convention, not as an independently validated indicator. COT data supplies his contextual “stage”; he still looks for alignment with market structure and a defined liquidity objective.
Model 3 Monthly Expansion and Daily Liquidity
For bearish conditions, ICT looks for the monthly range to expand toward equal lows or an old low on the daily chart. Under bullish conditions, he reverses the logic and looks toward equal highs or a prior high. His summary of the two directions appears at 8:35.
A significant qualification is that the monthly candle does not have to close near its high or low. The trade thesis concerns movement within the month, not correctly forecasting its eventual closing direction. ICT revisits this point at 26:19: capturing one weekly expansion inside the month can satisfy the model even if the monthly candle later reverses.
He also uses 20-, 40-, and 60-trading-day lookbacks from the start of a new month to locate relevant liquidity. The automated transcript renders the associated acronym inconsistently as “IPTA” and “EFTDA,” so the acronym itself should be checked against the video audio or chart labels. The supported idea is a set of lookback windows covering roughly one to three trading months.
ICT Model 3 Entry Timing and Refinement
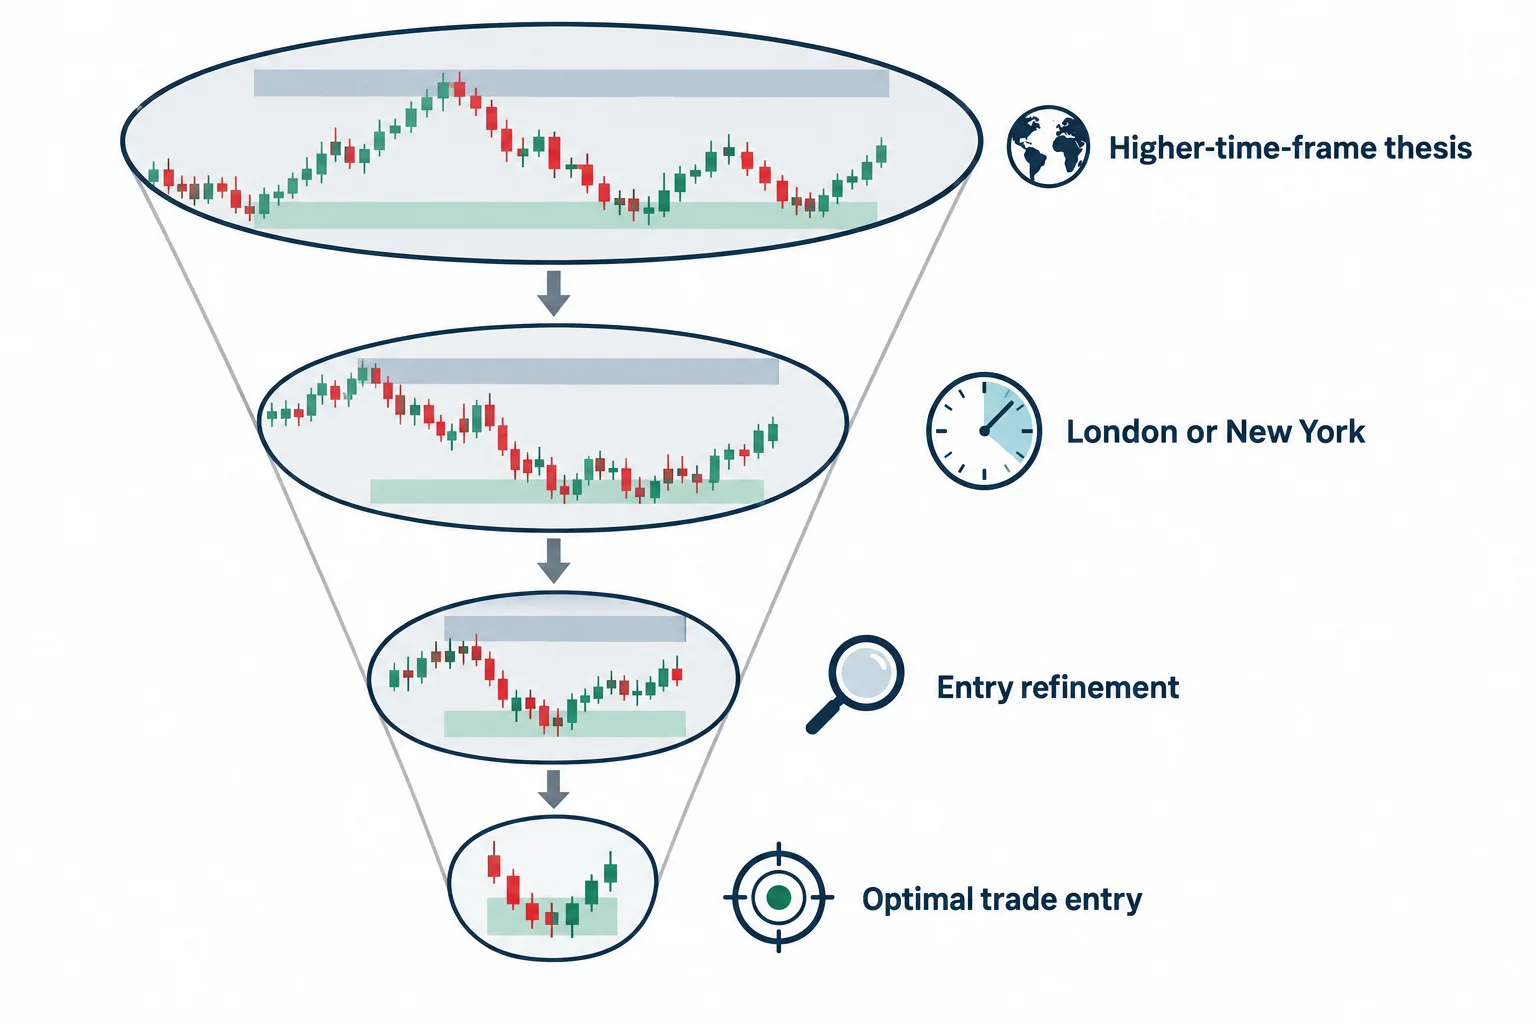
In the first Canadian-dollar example, ICT begins with the higher-time-frame thesis and then moves through monthly, weekly, daily, four-hour, and hourly views. He explains the monthly opening reference at 13:37, using either the beginning of the first Asian session or midnight on the first trading day, depending on his analysis.
He then looks for a retracement into an optimal trade entry area. On the hourly chart, he adds a day-of-week preference: potential swing entries are sought primarily on Monday, Tuesday, or Wednesday, especially around the London or New York opening windows. This discussion starts at 15:35.
ICT also shows how a smaller intraday price swing could be used to refine an entry and place a closer invalidation point than the broader swing would require. That does not establish how any viewer should size risk, and the transcript does not document an executed trade or verified fill. It is a retrospective chart explanation.
Price Targets and Fibonacci Extensions
From 17:31, ICT reads out a series of negative Fibonacci extension settings. He uses overlapping extensions and prior highs as potential scaling areas. His preference, as explained later, is not to exit solely because an extension has been reached; he looks for confluence between an extension and an old high or another liquidity feature.
Because several decimal values are delivered quickly and the source is automatic speech recognition, the exact list should be verified directly from the audio before being entered into charting software.
ICT Model 3 Canadian Dollar and USD/CAD Update
The second portion identifies itself as an update dated April 19, 2019, although the YouTube upload date is January 5, 2024. ICT applies the same framework to Canadian-dollar futures and USD/CAD. He repeatedly warns that their directional interpretation is inverted: weakness in Canadian-dollar futures corresponds, in his example, to strength in USD/CAD. The relationship is introduced at 28:52.
ICT walks from a monthly order-block interpretation into weekly equal highs and then a daily entry illustration. Around 50:37, he explains the example’s proposed entry, invalidation and upside liquidity objective. The visible chart cannot be independently reconstructed from captions alone, so these should be understood as his narration of an on-screen historical example rather than proof of execution or profitability.
ICT Model 3 Lecture Takeaways
Model 3 can be summarized as a top-down checklist: form a monthly directional hypothesis, assess ICT’s commercial-positioning filter, identify a daily liquidity objective, and wait for a compatible retracement rather than chasing price. If the next monthly expansion cannot be framed clearly, ICT says the swing model should be set aside in favor of a different, shorter-term framework.
The lecture offers a structured vocabulary for reviewing charts, but its probability and performance claims are the speaker’s interpretations. Anyone studying the material can separate those claims from the observable process by recording rules in advance, checking COT publication dates, avoiding hindsight-only labeling, and testing examples without assuming the narrated outcome was tradable in real time. This summary is educational and is not investment advice.




