
Key takeaways
ICT backtesting in this lesson means recording developing charts, marking exact prices and journaling hypothetical trades, not proving a profitable system. ICT suggests six weeks of historical study followed by at least six weeks of forward observation. His examples use the 7:00–9:00 a.m. Eastern pre-market range, the 9:30–10:00 opening range and the 10:00 hour. Log plausible entries, stops, targets, total risk and adverse movement, while keeping failures visible and hypothetical results separate from real trades. The timestamped captions support his stated workflow, not independent verification of the chart or returns.
How we researched this article
BestProps used document-based research from primary firm sources, checked September 18, 2026. The complete source list, scope, limitations, and commercial-state record appear near the end of this article.
In How New Students Should Start Part 5: Back Testing Properly, ICT presents backtesting as a candle-by-candle chart-recording and journaling exercise rather than a quick scan through completed candles. The lesson is the fifth in his “How New Students Should Start” sequence, and he revisits three ideas he says he introduced earlier in the series before showing how he annotates a Nasdaq session.
Two framing notes matter. First, the transcript supports what ICT says and reports, but it cannot independently verify the chart he displays, the levels he reads off it, or how the market actually behaved on the session in question. Second, the numbers he quotes (handle counts, prices and times) are his own measurements of a hindsight chart, not audited trade records. Nothing here is a performance claim, a tested system or investment advice.
Why ICT rejects market replay for backtesting
ICT opens by saying he wants to discourage students from relying on market replay, which he calls useless (2:59). His stated objection is specific: replay shows a candle opening, then immediately how it closed, where its high and low formed, and then the next candle. In his description, you get the opening flurry and the close rather than the full “lifespan” of every candle (3:07).
He extends the argument to higher time frames. Whether a student trades one-minute, hourly or weekly charts, he says the logic is the same and the methodology does not change with the time frame; what they are watching is how candles book price. He calls the apparent speed of a one-minute chart an illusion, because a one-minute chart and a weekly chart display the same price at the same time (7:43).
His strongest language is reserved for replay itself, which he describes as toxic, unrealistic and not fluid, and he tells viewers to stay away from it (7:03). He is also critical of mentors who teach from replay while pausing the sequence to describe what happened, which he says removes the intrabar development (6:33). These are ICT’s opinions about tooling, and the transcript cannot establish that every replay implementation behaves exactly as he describes.
Record the chart for ICT backtesting
The alternative he recommends is to record the developing chart and narrate what you observe. At 3:56 he describes using Windows screen recording with the microphone enabled so the student can talk through the chart in their own voice, and he repeats the shortcut near the end: hold the Windows key, hold Alt, and tap R (44:54). He notes that the recording stays on until it is stopped and warns about screen savers interrupting a session. Platform and software differences should be checked before relying on that shortcut.
He argues that a delayed feed is good enough for this exercise because the student is studying movement that has already happened (5:00). On the question of paying for data, he says people ask him to fund a real-time feed and points out that TradingView real-time data costs about $7; his stated view is that if a student cannot cover that, they have bigger problems than data access (1:27). That $7 figure is a quotation from the lesson, not a current data-feed price. The recommendation is to study recorded price action instead.
For the study window he suggests a minimum of six weeks of past examples followed by six weeks of forward observation (5:57), and he expects students to review the recording later (after work, after university, or whenever they get to it) because pausing is possible then (6:19). His framing of the task is to go through the logic you would have implemented, see how often an idea works, note where it meets hardship, and record where it fails (5:13). He adds that setups rarely look identical: they rhyme, but they do not share an identical fingerprint (9:23).
Mark the chart for ICT backtesting
The lesson builds on three elements he attributes to earlier parts of the series: the 7:00–9:00 a.m. Eastern pre-market session range, the regular-trading-hours opening range with its midpoint, and the 10:00 a.m. “Silver Bullet” hour (8:01).
His stated annotation routine is to mark the pre-market high and low, draw a Fibonacci-style division across that range, and stop those lines at 9:00 a.m. so they can be compared with the 9:30–10:00 opening range. Where lines from separately constructed ranges agree, he treats the level as stronger (9:56). He also wants relative equal highs and lows, fair value gaps and similar reference points marked, and he advises using TradingView’s price-note tool on exact open, high, low and close values rather than estimating a level as “around 560-ish” (14:01). His justification is that imprecise logging produces imprecise trading (14:58). These labels come from ICT’s own interpretive framework; the lesson does not validate them independently.
ICT backtesting examples from the lesson
He works through annotated Nasdaq (NQ) examples on a one-minute chart, quoted here as his reported observations rather than audited trade records:
- He says the pre-market session high qualified as a key level for a bearish fair value gap he identifies at 11:09 a.m. Eastern, that price retraced only to that gap’s midpoint, and that it then cleared relative equal lows he places at 29,370.50 from the pre-market session (15:57).
- Earlier in the same section he describes NQ selling off from a premium bearish fair value gap for “over 100 handles” and, later, dropping 94 handles from a pre-market key level (11:27, 17:17).
- For the opening range gap, he uses the prior regular-session closing print and the next 9:30 a.m. opening price, calls a lower open a discount gap and a higher open a premium gap, and then watches how the midpoint is traded (25:04). He reports a 69-handle discount opening range gap whose midpoint was reached about five minutes after 9:30 (26:51).
- He says a Fibonacci negative-one standard deviation projection of that opening range gap marked the high of the morning session, and that the morning low printed at 29,386.25 about twelve minutes after 11:00 a.m. before being swept with a lower low (27:22, 28:00).
- In the 10:00 hour he describes a fair value gap forming just after 10:00 and says the “first presented” fair value gap was used to sell off for over 175 handles. He then argues that a second gap accompanied by displacement carries greater weight for him (31:19, 36:40).
- He ties the sequence together with a concept he calls the “lunch macro”, meaning that the market seeks a low formed during the 10:00 hour (33:48), and he disputes the common view that the opening range is five or fifteen minutes: in his description the dealing range he uses is thirty minutes (39:01).
Captions are automatically generated and may misrender his terminology, and none of the price levels, handle counts or candle structures above can be confirmed from the transcript alone. Treat them as the speaker’s readings of a hindsight chart.
Reconstruct a hypothetical trade in your backtesting journal
His method for logging a trade he did not take is to pick a plausible entry rather than the best visible turning point (17:55). In the worked examples he treats the midpoint of a gap as a reasonable entry area, or one tick beyond it, and he explains his reasoning: if order flow is bearish the candle bodies should stay below the gap’s high, while wicks may extend outside it (18:46). He places the stop one tick beyond the high of the candle that last spent time outside the imbalance (40:33), and he records the target where he would calculate a hypothetical return (19:37).
He is explicit that the journal entry should read as though the trade were taken, while the positions he describes in the walkthrough are hypothetical reconstructions. He also says the numbers involved would force a realistic size, in his words, trading a micro (41:17), and that the exercise should record total risk, how much heat or drawdown the idea incurred, and how much time and distance price moved against the position (42:34). His criticism of replay reappears here: in his view replay does not make the student sit through an adverse excursion, which is exactly what a journal is supposed to condition (41:57).
Keep your ICT backtesting journal honest
A recurring theme is tone. He tells students to annotate confidently and to write constructive observations about what they see, arguing that positive, repeated phrasing helps condition recognition faster (12:08). He describes a losing day after going live as a candidate for the same treatment: record what you should have seen rather than dwelling on the loss (24:00). His reason is that the journal is private correspondence with your future self (24:36).
That advice is a motivational device, and it deserves a caveat that ICT does not supply: a journal that records only what should have happened stops being evidence. Errors, rule violations and failed examples still need to be visible somewhere in the record, or the same study will confirm whatever the author already believes.
How ICT backtesting differs from a quantitative test
The workflow described here is discretionary and visual. Nothing in the lesson provides a fixed rule set, a complete sample, a cost model, or out-of-sample testing, and the examples are chosen after the fact. A mechanical test would need those elements: written entry and exit criteria, a clean split between the data used to build the idea and the data used to judge it, consistent execution assumptions including commissions and slippage, and a frozen rule set evaluated on unseen observations.
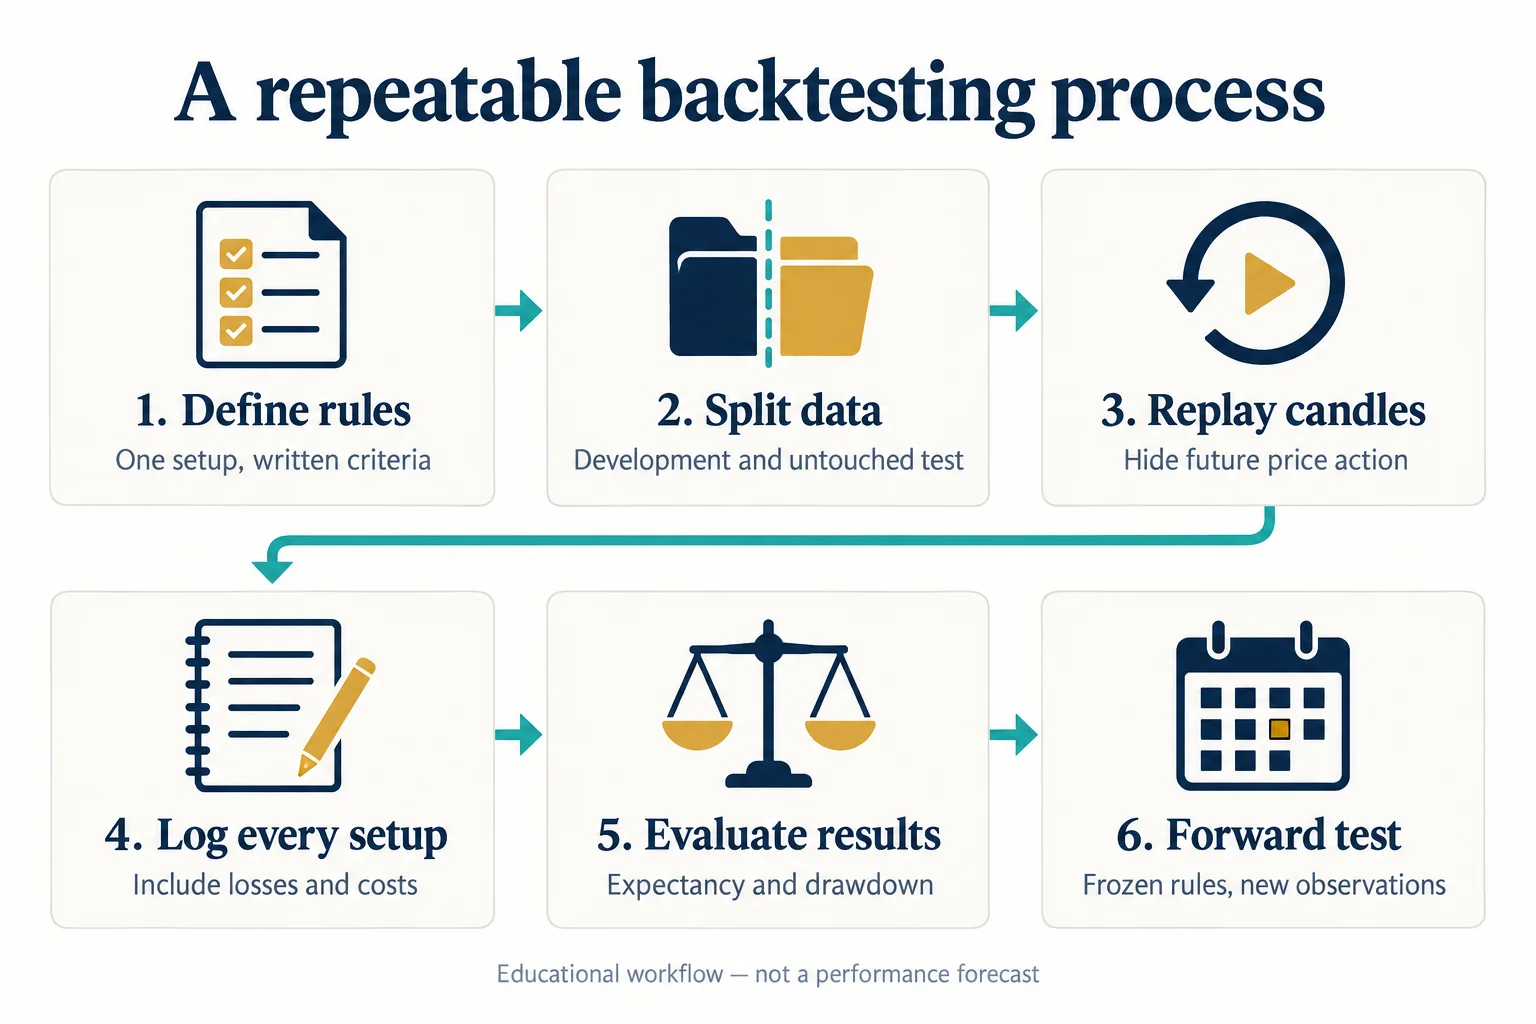
Used carefully, the two approaches are complementary rather than competing. The lesson is strongest on the parts a spreadsheet does not capture: recording what price actually did inside a candle, writing down the level exactly instead of approximately, and tracking how uncomfortable a position became before it worked or failed.
Watch the original ICT backtesting lesson
This article draws on the timestamped English captions of How New Students Should Start Part 5: Back Testing Properly. Captions are a source for the speaker’s words, not independent proof of the levels, fills or results he describes, and the chart detail in the recording remains important when following the annotations.
Watch the original lesson on YouTube
Open the lesson on YouTube to follow the chart annotations alongside the timestamped explanation.
Watch How New Students Should Start Part 5: Back Testing Properly on YouTube ↗
Explore ICT backtesting tools and sources
- The original Inner Circle Trader lesson: use the timestamp links above to compare the explanation with its source.
- TradingView support: how to turn Bar Replay on: documentation for the replay tool this lesson advises against, useful for comparing implementations.
- TradingView Pine Script: Strategies: documentation for scripted strategies that simulate orders and report performance; the same page notes that those results are based on hypothetical orders.
- Smart Money Concepts by LuxAlgo: a third-party, unofficial indicator that labels some of the same structures; it is untested here and no claim is made about its signals, repainting behaviour or results.
- 17 CFR 4.41: a United States regulatory reference on advertising that includes hypothetical performance; it is context for treating reconstructed examples as hypothetical, not a statement that this article or recording falls under it.
This is independent educational commentary. It is not official ICT material, a tested trading system, or a claim that any reported result can be reproduced.




