
How we researched this article
BestProps used document-based research from primary firm sources, checked September 24, 2026. The complete source list, scope, limitations, and commercial-state record appear near the end of this article.
In this short installment of the 2025 Lecture Series, ICT reviews NQ trading through daily, hourly, 15-minute, one-minute, and 15-second perspectives. The discussion centers on a strong upward move, a pre-market long setup, and the danger of forcing a predetermined opinion onto an aggressively rising market.[1]
The primary source is ICT’s video, “2025 Lecture Series – NQ Review April 24, 2025”, uploaded April 24, 2025. This review uses automatic speech recognition of the full original audio, not human-verified captions. Because that transcript cannot show the chart itself, the price structures below reflect ICT’s narration rather than independently verified chart annotations.[1]
Higher-time-frame context
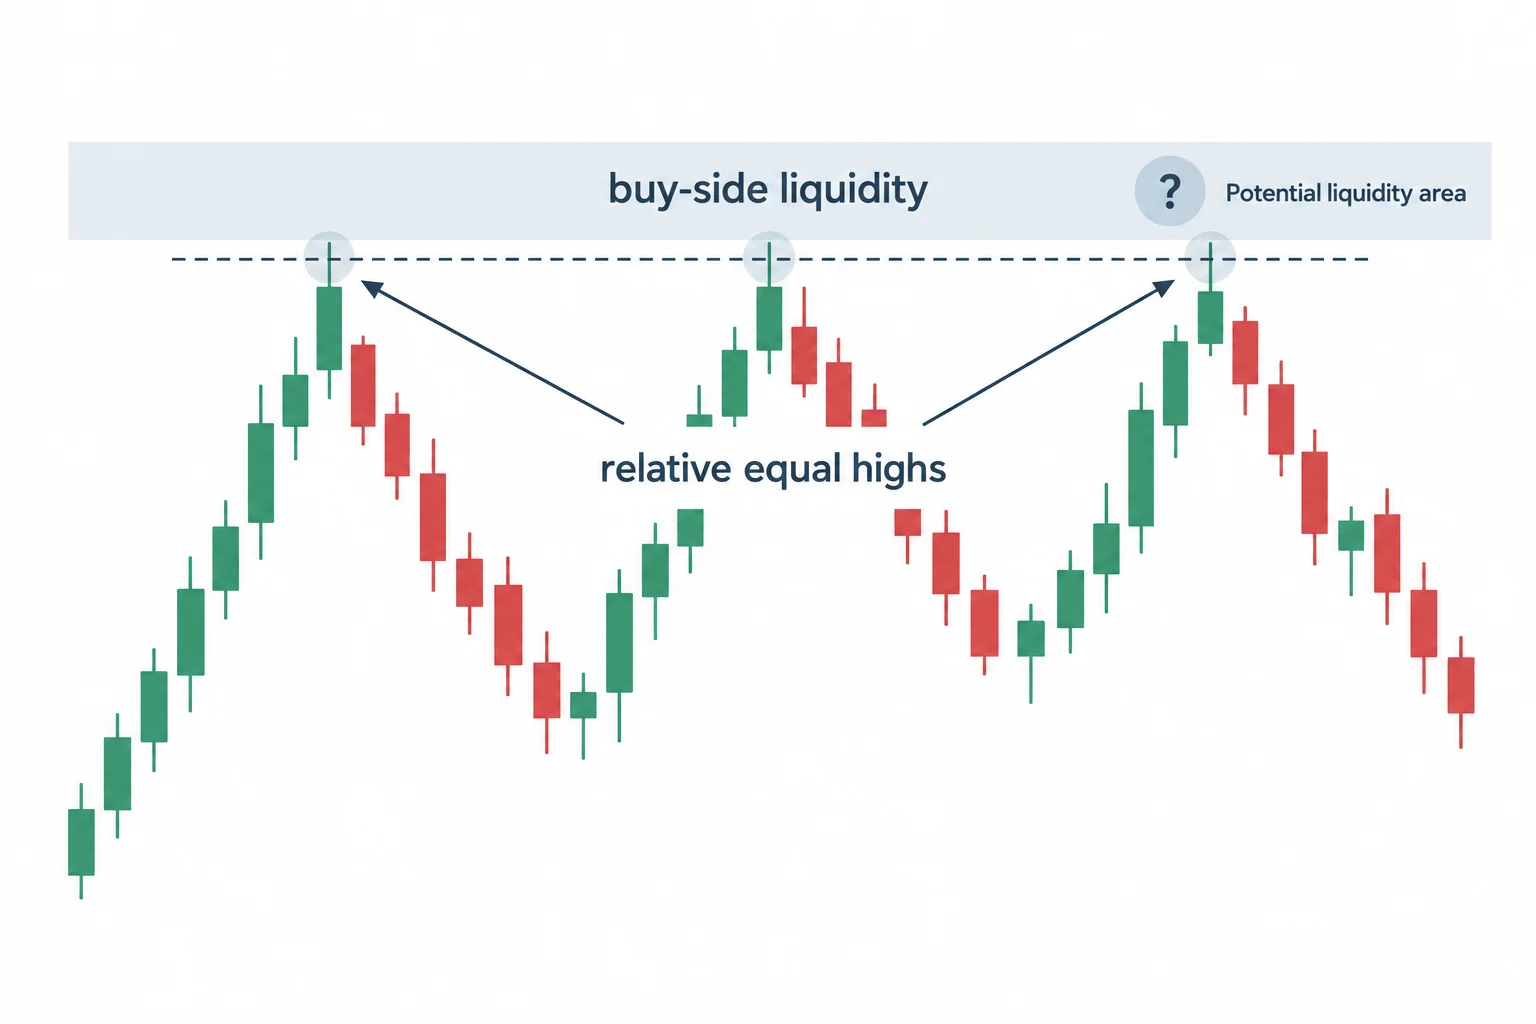
ICT begins with the daily-chart overview at 0:35. He says he had been unsure whether price would drop into a gap, and that price then moved slightly beneath the prior day’s low. The exact gap boundaries are not established by the narration. From there, his stated expectation was for price to reach a nearby high and, eventually, a group of what he calls “relative equal highs.”[1]
Within ICT’s framework, relative equal highs are treated as an area where buy-side liquidity may be resting. That is his market interpretation, not proof that such a level must attract price or provide a repeatable trading edge.[1]
At 1:14, he shifts to an hourly chart. He identifies a volume imbalance, relative equal highs, and a 60-minute fair value gap. He describes price moving through that gap and then treating it as an “inversion fair value gap” before continuing toward minor buy-side liquidity.[1]
The pre-market move
The review then moves to the 15-minute chart. At 1:55, ICT emphasizes that the setup developed during pre-market trading, before the 9:30 a.m. opening bell. He describes a sharp rally, then warns against trying to force a contrary bias.[1]
This leads to one of the video’s most broadly useful educational points. At 2:14, ICT warns that recklessly fighting a strong move or forcing a predetermined bias can be destructive. In general terms, this illustrates the difference between forming a conditional market thesis and insisting that price conform to it. [1]
ICT’s described trade
On the one-minute view, ICT identifies the pre-market portion of the session and then discusses his own execution. At 2:30, he says he took a long based on a 15-second order block and shared it through his Telegram channel. His stated objective for that long was buy-side liquidity. He then discusses another entry after the rally above the 60-minute fair value gap; the transcript does not establish enough detail to reconstruct that second trade.[1]
At 2:54, he describes entering just above the gap’s midpoint, or consequent encroachment. He reports some adverse movement and says earlier trade proceeds funded the open drawdown. This is his own explanation of risk allocation, not a guarantee that recycling earlier gains makes a later trade safe. Exact profit figures and a reconstructed entry-to-exit record are omitted because they cannot be independently established from this audio.[1]
Those remarks describe ICT’s own account of his trade management. The transcript alone does not establish entries, exits, fills, account results, or profitability, and it does not show enough chart detail to reconstruct the trades reliably.[1]
Why ICT considered the cash open unattractive
At 3:30, ICT explains that another obligation kept him from trading the opening portion of the regular session. In retrospect, he says he did not consider the opening especially attractive. His reasoning was that traders who had not established a long before the bell received little opportunity once the market began moving higher.[1]
At 3:58, he points to a 9:28 candle and says price reached the midpoint of a daily volume imbalance before continuing upward. By 4:14, he adds that he was glad to have missed the morning because he might have been frustrated by the absence of the conditions he normally wants for a trade.[1]
Educational takeaway
- ICT framed the session from the daily chart down to very short execution time frames.
- His bullish narrative relied on a prior-day low, a gap or imbalance, relative equal highs, and buy-side liquidity.
- He characterized the most actionable opportunity as a pre-market long rather than a setup appearing after the opening bell.
- He cautioned against forcing a bias when price is moving aggressively in the opposite direction.
- At 4:32, he ended by watching whether the market would continue toward the daily relative equal highs, not by claiming that the next move was guaranteed.
This review is best understood as an explanation of ICT’s own terminology and reading of one NQ session. It is educational commentary, not investment advice or evidence that the described concepts will produce similar outcomes in other markets or sessions.[1]
Reading the recap with the source
The title and source identify the April 24, 2025 review; the speaker calls it Thursday’s Nasdaq trading. Exact contract month, chart coordinates and fills have not been verified. The checklist below is an editorial review aid, not a trading setup.[1]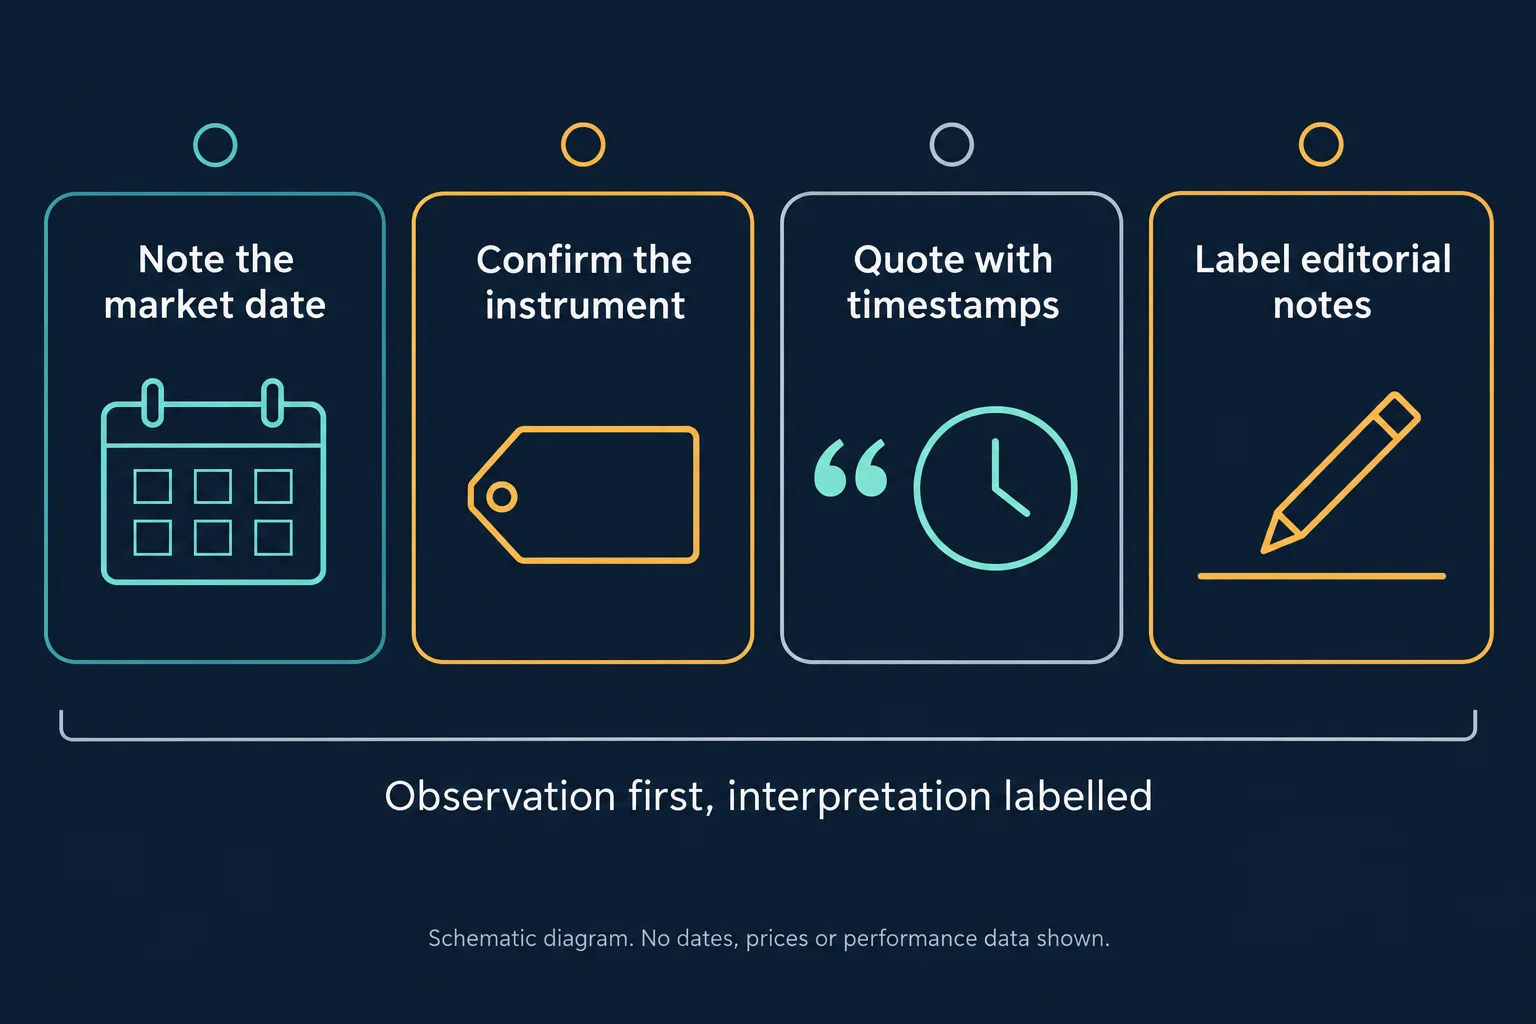
Watch the original recording
2025 Lecture Series — NQ Review April 24, 2025
The owner-disabled message was confirmed in the embedded player. Watch directly on YouTube or use the timestamp links above.
Original-source context
Nasdaq’s methodology describes the Nasdaq-100 index and its weighting approach; it is useful index background, not a futures contract specification or evidence for the chart observations above.[2] NYSE’s official hours establish its 9:30 a.m. ET cash-market opening context, not the full NQ futures trading schedule.[3]




