
Key takeaways
ICT’s May 5, 2025 NQ morning review connects three scales: a daily wick midpoint he identifies as 19,980, a 15-minute buy-side liquidity objective, and a one-minute setup around a fair value gap and volume imbalance. His closing condition matters as much as the bullish idea: he says a loss of the 8 a.m. low would point toward a deeper daily retracement.[1]
How we researched this article
BestProps used document-based research from primary firm sources, checked September 24, 2026. The complete source list, scope, limitations, and commercial-state record appear near the end of this article.
This article paraphrases the recording’s timestamped, locally generated audio transcript. It is automatic speech recognition, not human-verified captions. Chart details and order records were not independently inspected; price action, trade descriptions and directional interpretations below are attributed to ICT, not established trading results.
Daily context: treating Thursday’s wick like a gap
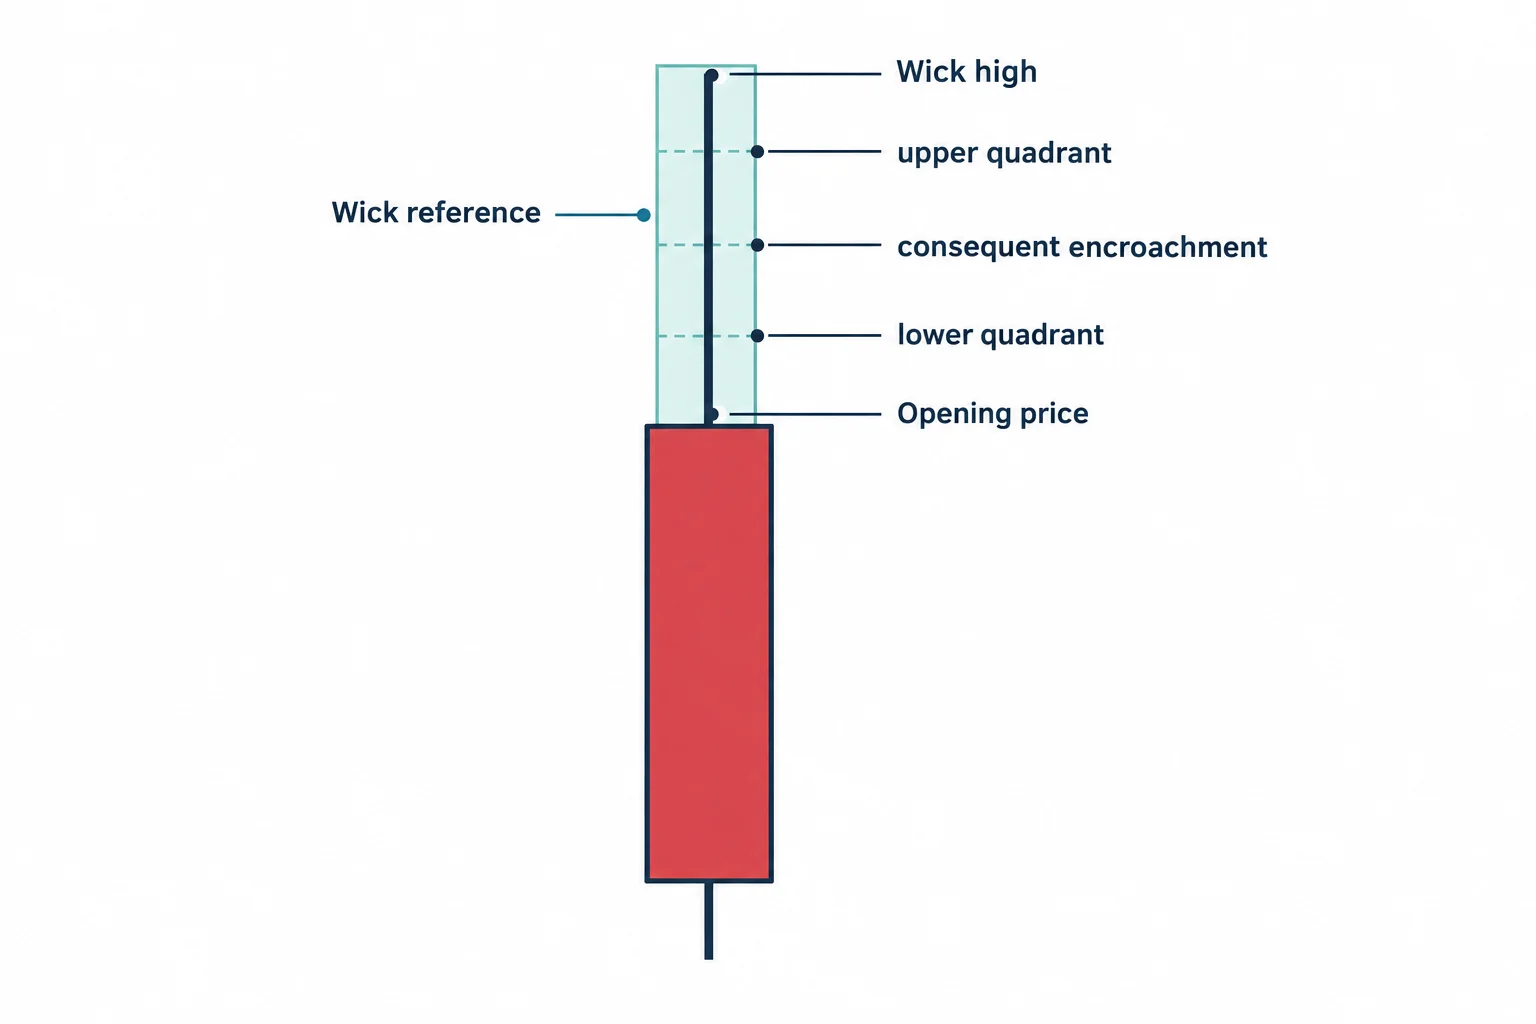
ICT identifies the session as the Nasdaq AM review for May 5, 2025 at 0:38. Starting on the daily chart at 0:46, he describes Thursday’s upper wick being traded through on Friday, followed by a move back into Friday’s range. His teaching point is to use that wick as he would a gap: define its boundaries, quadrants and midpoint rather than treat it as an undifferentiated area.[1]
At 1:23, he names the lower quadrant, midpoint or consequent encroachment, upper quadrant and wick boundaries. For this down-closing candle, he identifies the opening price as the bottom of the upper wick. At 2:05, he gives the midpoint as 19,980. In his framework, a previously premium wick becomes a discount reference after price has traded above it and returned.[1]
The practical study question is how a daily reference carries through to lower time frames. The level is reported from his narration; it is not a reconstructed chart coordinate or an independently checked exchange quotation.
The 15-minute draw and the selected sell-side pool
At 2:25, ICT calls 15-minute buy-side liquidity the draw. He describes price spending time around the daily wick’s midpoint and moving back and forth before reaching the objective. On the one-minute view at 3:05, he says the midpoint had been touched before 9 a.m. and emphasizes overlapping ranges on the way toward buy-side liquidity.[1]
At 3:33, he identifies relative equal lows as the sell-side pool he says he had highlighted on Telegram. His explanation for selecting that pool is specific: earlier pre-session lows had already been worked, and this was the first cleaner set he would encounter. He also mentions a Monday high-impact news driver at 10 a.m.; this article does not infer its name or add a chart time zone.[1]
Fair value gap, volume imbalance and the reported buy
At 4:53, ICT clearly restates his two focus areas as the first presented fair value gap and a volume imbalance. That later wording supports normalizing the garbled earlier ASR label. At 5:17, he points viewers toward relative equal highs in Friday’s session as a tape-reading exercise. The exact higher price is unclear in the transcript and is omitted here.[1]
In the zoomed-in explanation beginning at 5:34, he describes the relative equal lows being swept and price moving back above the referenced area while he looks toward 15-minute buy-side liquidity. His conditional expectation at 5:58 is that, after moving back up, price should not return to the lower half before reaching buy side. Because the transcript relies on pointing words such as “this,” it does not support assigning precise boundaries to that lower half.[1]
At 6:15, he narrates a buy indication and a subsequent rally into buy side. He says there were no other trades and no shorts that day. These are the presenter’s reported actions, not verified fills, account performance or instructions to copy the trade.[1]
The retracement and his 8 a.m. low condition
From 6:47, ICT describes price returning to the first presented fair value gap, failing to get back above the 15-minute high, breaking lows he calls retail support, and later rallying through the day’s high. This is his sequence of the chart discussion, not independently reconstructed price data.[1]
His closing explanation at 7:15 returns to narrative. He describes the session as more difficult and says the selected liquidity pool helped frame the low. At 7:40, he gives the condition on his bullish reading: while the 8 a.m. low remains intact, he remains bullish; losing it would suggest a deeper daily retracement. That is a session-specific view, not a universal trading rule.[1]
A useful way to record the lesson
Keep the speaker’s statements separate from evidence you have checked yourself. For this lesson, record 19,980 and the 8 a.m. low condition as narrated references, leave the uncertain higher price open, and reserve the visible-evidence category for chart details you actually inspect. Checking the original upload establishes what the source says, not whether its trading interpretation is correct.
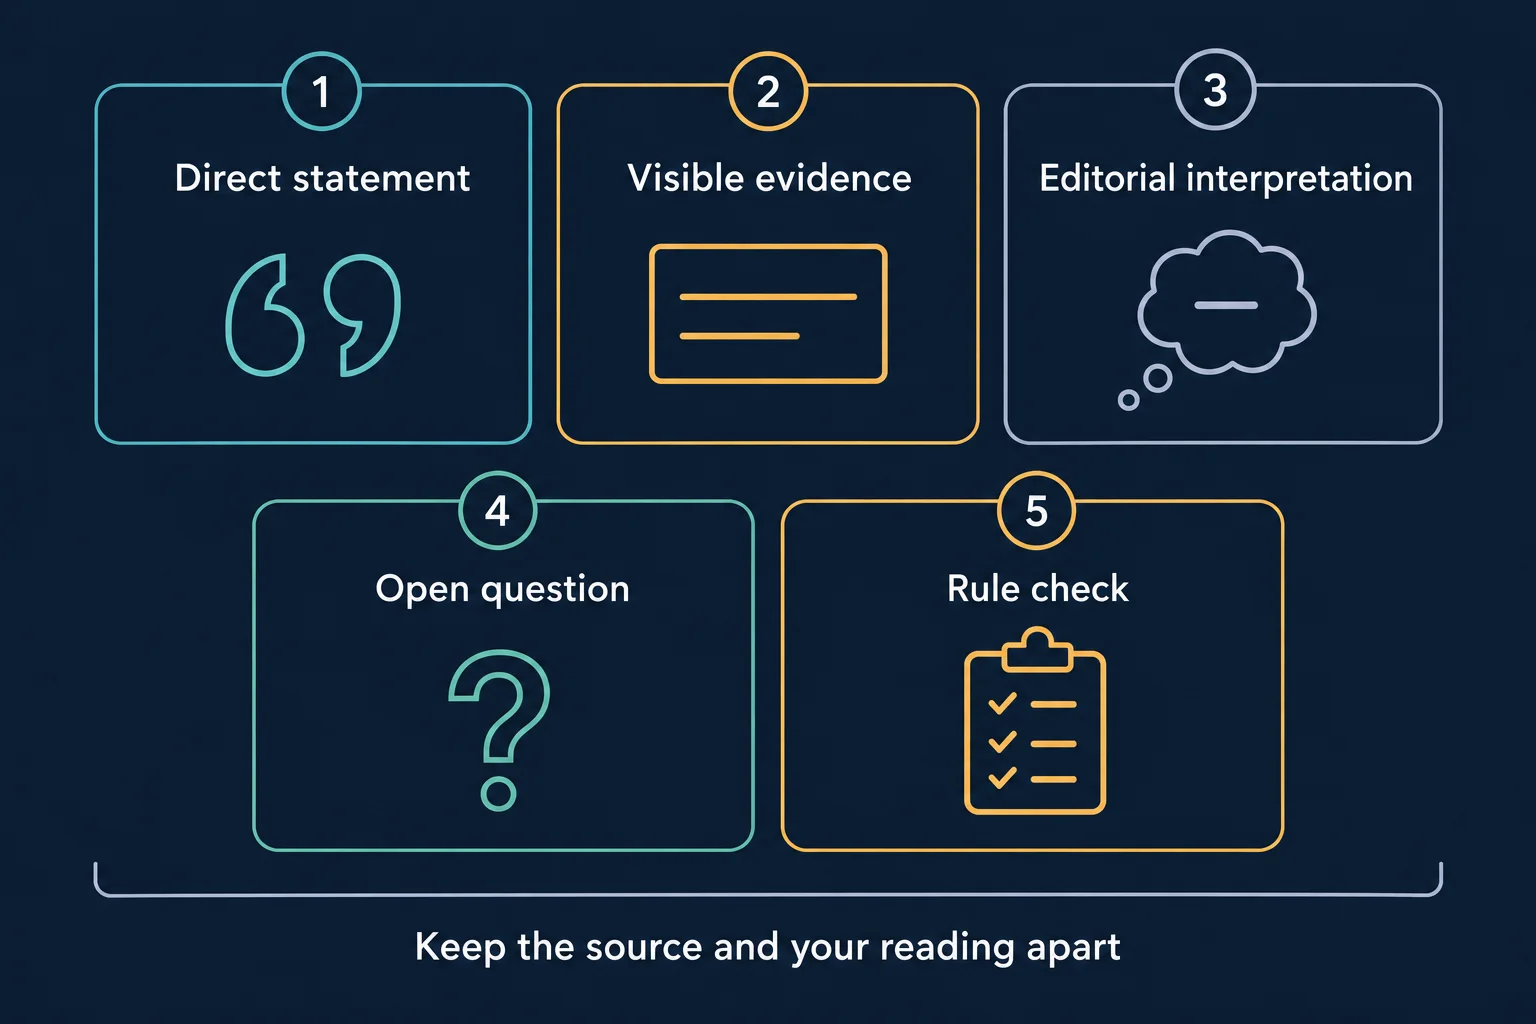
The categories in the schematic are an editorial note-taking aid, not ICT’s entry model. A separate rule check can record any applicable account restrictions; no funded-account terms or trading system have been tested for this article.
Watch the original lesson
2025 Lecture Series – NQ AM Session May 05, 2025 Review
The tested embedded player reported that playback on other websites was disabled by the video owner. Use the direct YouTube link instead.[1] YouTube documents the uploader’s embedding setting separately.[3]
Original-source resources
Use The Inner Circle Trader’s channel to locate original uploads rather than relying on reposted descriptions.[2] For general risk education, the CFTC’s Learn & Protect page stresses understanding the markets and products you trade and warns that no trade is risk-free; this is not an assessment or endorsement of the lesson.[4]
Risk note: This is educational commentary, not investment advice. No win rate, expectancy, net profit or validated trading edge is established by this review.
Sources
- [1] YouTube: 2025 Lecture Series – NQ AM Session May 05, 2025 Review – The Inner Circle Trader (mapped first-party recording)
- [2] YouTube: The Inner Circle Trader official channel (canonical /@InnerCircleTrader, channel ID UCtjxa77NqamhVC8atV85Rog)
- [3] YouTube Help: Embed videos & playlists (official documentation, incl. the owner setting that turns embedding off)
- [4] CFTC: Learn & Protect (official U.S. regulator investor-protection page)




