
How we researched this article
BestProps used document-based research from primary firm sources, checked September 24, 2026. The complete source list, scope, limitations, and commercial-state record appear near the end of this article.
In 2025 Lecture Review February 03, 2025, ICT reviews the February 3 session in the March 2025 Nasdaq futures contract. Moving from 15-minute and five-minute charts to one-minute and 15-second views, he explains how he combined a new week opening gap with the regular-session opening range gap. He then walks through his interpretation of a long setup targeting the midpoint of the weekly gap.
The lesson is a retrospective explanation of ICT’s own framework. The original video description explicitly states that the trading performance displayed is hypothetical. The transcript supports the speaker’s explanation, not independently verified live fills, net results, or a reproducible trading edge. Nothing in this review constitutes investment advice.
The two gaps at the center of the lesson
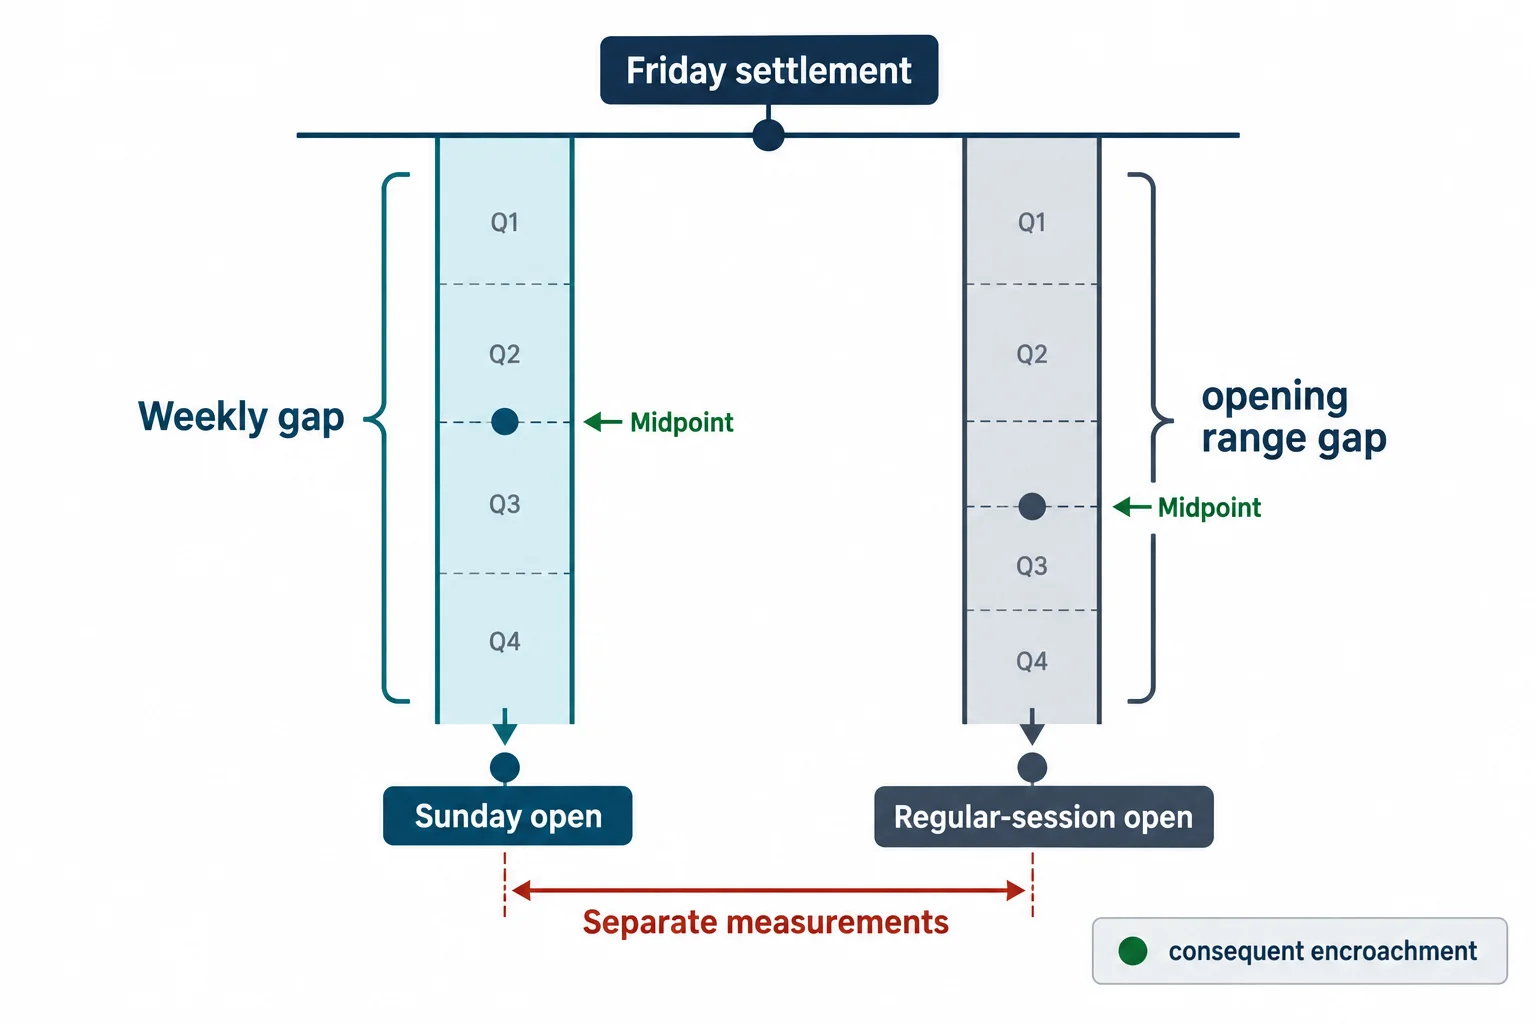
ICT begins by identifying a large electronic-hours gap between the prior Friday settlement and the Sunday evening opening price. On the 15-minute chart, he describes price forming a morning low before recovering toward that gap. He calls this a “discount new week opening gap” because Sunday’s opening was below Friday’s settlement (1:51).
He applies a Fibonacci-style division to the gap, marking its lower quadrant, midpoint, upper quadrant, and high. In ICT terminology, the midpoint is “consequent encroachment.” The captions repeatedly render that phrase as “consequent encouragement,” which appears to be a recognition error.
He separately defines an opening range gap using Friday’s settlement and the 9:30 a.m. Eastern opening price. After dividing that range in the same manner, he overlays both structures. His main observation is that levels from the two gaps converge, creating an area where he says the market found support and consolidated (2:45).
From bearish behavior to a bullish interpretation
The setup was not based only on price reaching a gap level. ICT says he waited for bearish behavior to fail before adopting a bullish entry model. In his account, a bearish fair value gap was overtaken to the upside and then treated as an inversion fair value gap—an area that had first acted as bearish resistance but was subsequently used to frame bullish support (4:53).
He also notes that an imbalance inside the marked inefficiency should be included when annotating the chart. He admits that his rectangle was not anchored precisely and tells viewers to account for the embedded imbalance in their own chart work (5:27). This is a useful qualification because it shows that the boundaries in the presentation were manually drawn rather than mechanically exact.
ICT’s stated sequence was:
- Begin with a bullish interest in the midpoint of the new week opening gap.
- Let the early decline draw traders toward lower prices rather than immediately entering.
- Watch for a bearish price-delivery area to fail.
- Interpret the reclaimed fair value gap as an inversion fair value gap.
- Use the weekly-gap midpoint as the upside objective.
He describes this as waiting for a “trap” in which traders expecting continued weakness are caught by an upside reversal. That is ICT’s market interpretation, not a demonstrated fact about the motives or positions of other participants.
Entry, stop placement, and partial exits
On the 15-second chart, ICT says he bought three contracts during a retracement toward the midpoint of the inversion area. Rather than placing the stop immediately, he says he waited for the candle after entry to trade back into the midpoint and then set the stop. This describes his account, not a recommendation to delay protective orders. He interpreted the small separation between adjacent candles as a breakaway gap that should remain open if the bullish premise was valid (7:24).
He identifies the consequent encroachment of the new week opening gap as his final target. He describes an initial partial exit, a second partial, and a final limit exit at that objective (9:51). Although he reports a move of more than 140 Nasdaq handles and 562 ticks, the transcript alone cannot establish the exact fills, net result, costs, or reproducibility of the trade.
Volatility and reduced exposure
Risk adjustment is an important part of the commentary. ICT characterizes the session’s volatility as unusually high and says his stop was around 20 handles, wider than normal for him. He therefore reports using three contracts instead of the 10 or 15 he says he may prefer in other conditions (13:46).
He warns that traders can be hurt quickly in elevated volatility and says the session was more difficult than an average trading day. He attributes that volatility to tariffs and trade-war developments, but the transcript does not provide independent evidence for that causal claim. His broader educational point is clearer: when the distance required to invalidate a setup expands, reducing position size can limit the corresponding increase in exposure.
General educational takeaways
Independent of ICT’s proprietary terminology, the lecture illustrates several general chart-review practices:
- Define reference levels before examining a lower-timeframe entry.
- Look for confluence between separately constructed ranges rather than relying on one line.
- Require observable invalidation or a change in short-term behavior before acting on a directional thesis.
- Choose an objective and invalidation point as parts of the same plan.
- Scale exposure to volatility rather than assuming the same size fits every session.
Near the end, ICT reiterates that his Telegram material is intended for tape-reading education and “draws on liquidity,” not as a signal service. Viewers should treat the lecture as one speaker’s retrospective framework, not as evidence that these patterns provide a reliable trading edge.
Watch the original ICT lesson
This article draws on the timestamped English captions of 2025 Lecture Review February 03, 2025. Captions are a source for the speaker’s words, not independent proof of the reported trading performance. The recording’s chart detail remains important when following the annotations.
Watch the original lesson on YouTube
Open the original lesson on YouTube to follow the chart annotations alongside this review.
Primary source and further reading
- The original Inner Circle Trader lesson: use the timestamp links in this article to compare the explanation with its source.
- YouTube’s embedding documentation: platform guidance relevant to the external watch link above.
- 17 CFR 4.41: disclosures concerning hypothetical performance: a regulatory reference, not a statement that a particular recording or this article meets every legal requirement.
This is independent educational commentary. It is not official ICT material, a tested trading system, or a claim that the reported results can be reproduced.




