
Key takeaways
ICT’s 2022 Mentorship Episode 9 on YouTube explains the Power of Three sequence of accumulation, manipulation and distribution using Nasdaq E-mini futures price action from February 14 and 15, 2022.
Read the full summary
ICT’s 2022 Mentorship Episode 9 on YouTube explains the Power of Three sequence of accumulation, manipulation and distribution using Nasdaq E-mini futures price action from February 14 and 15, 2022. A bullish setup may begin near an opening reference, sweep lower in a Judas swing, establish a low and expand upward, while the bearish version reverses that sequence. ICT builds context from a daily swing range, equilibrium, discount and premium, then combines fair value gaps, bullish order blocks, prior highs and lows, and five-minute and one-minute structure. The February 14 example studies a bullish afternoon retracement into an imbalance within an order block near 2 p.m. New York time, with prior highs as liquidity objectives. The February 15 example warns against chasing a large overnight and London-session advance, defines the relevant overnight window as roughly 2 to 5 a.m., and favors waiting until after lunch around 1 p.m. for a sweep below morning or lunch-period lows, energetic displacement above a nearby swing high, a new fair value gap and a retracement entry. ICT also discusses a later opportunity for traders who missed the first move, hypothetical Micro E-mini entry, stop and reward-to-risk mechanics, the possibility of adverse movement, avoiding repeated trades in choppy conditions, rejecting hindsight-only levels and allowing brief price movement through a fair value gap when candle bodies still react around it.
How we researched this article
BestProps used document-based research from primary firm sources, checked September 25, 2026. The complete source list, scope, limitations, and commercial-state record appear near the end of this article.
2022 ICT Mentorship Episode 9 examines what ICT calls the “Power of Three” (accumulation, manipulation and distribution) and applies that framework to Nasdaq E-mini futures around the New York session. The lesson uses price action from February 14 and 15, 2022, with particular attention to fair value gaps, liquidity around prior highs and lows, order blocks and afternoon opportunities.
Primary source: Watch 2022 ICT Mentorship Episode 9 on YouTube, uploaded February 16, 2022.
ICT Power of Three Explained
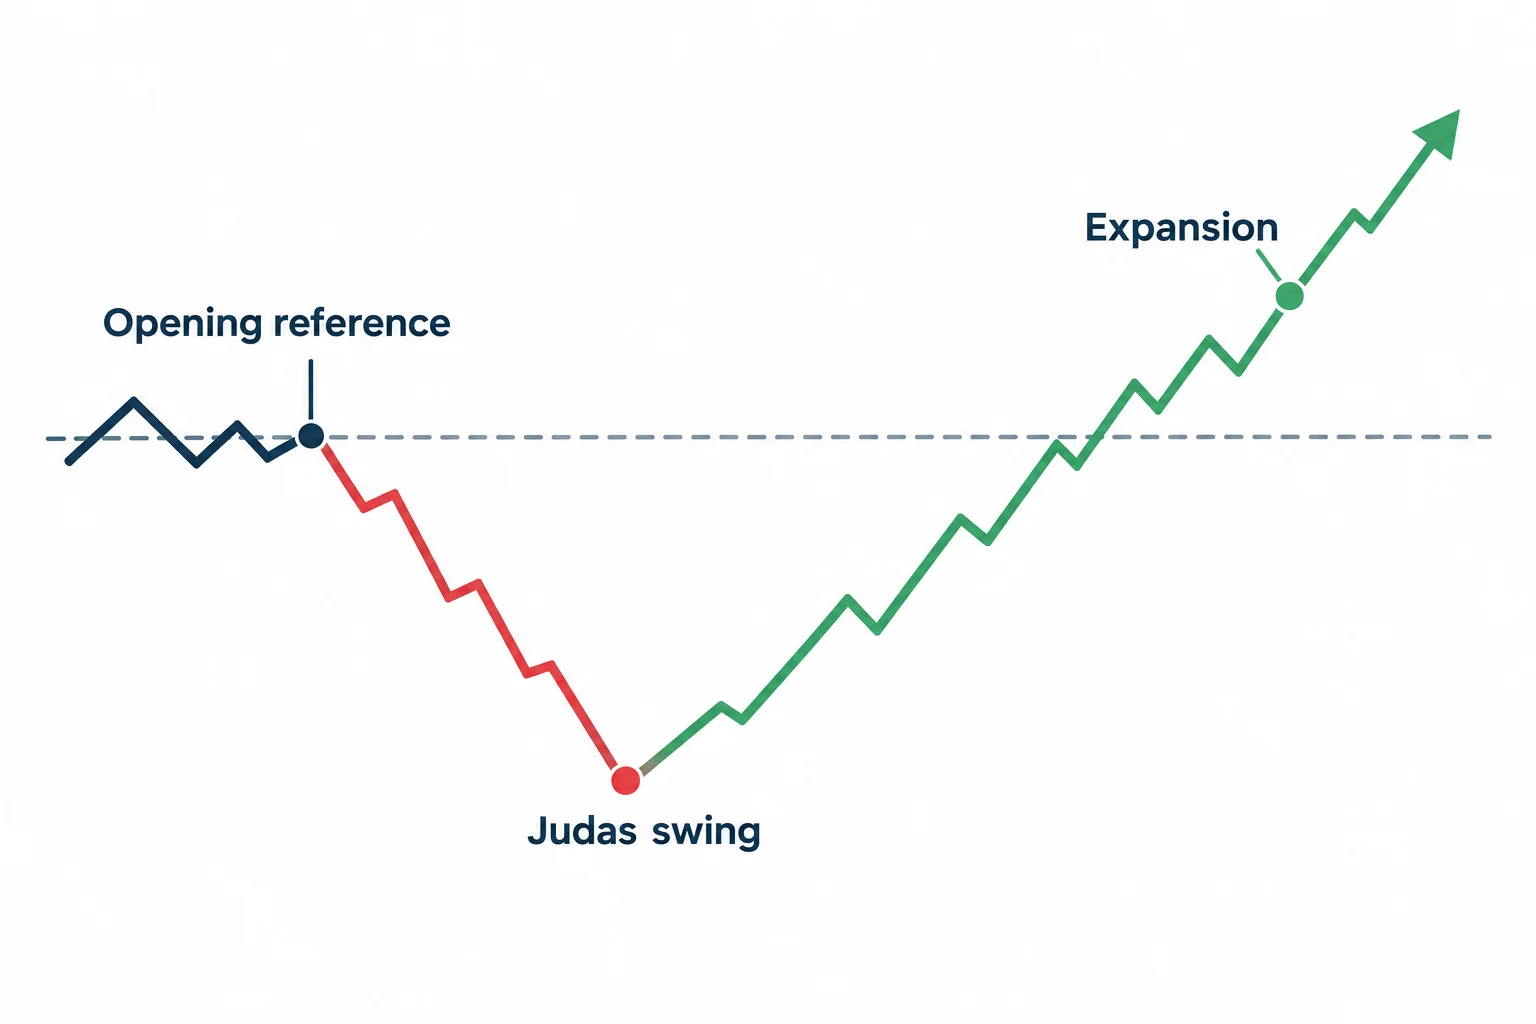
ICT introduces the lesson’s main subject at 0:12. In his framework, a bullish session can begin with price near an opening reference, briefly move lower, establish an important low and then expand upward. He describes that initial move against the anticipated direction as a possible “Judas swing,” meaning a false move before the larger directional move.
The important point is not to predict the exact closing price. At 2:59, ICT instead emphasizes forming a directional narrative and watching whether price first moves against it. For a bullish idea, he looks for a move beneath an opening price before an advance; the bearish version would invert that sequence.
This is ICT’s interpretation of market behavior, not proof that every session follows a fixed three-stage pattern. The transcript also contains one instance where the three terms appear in a different order, likely a spoken variation or transcription issue. The clearly stated order at the beginning is accumulation, manipulation and distribution.
ICT Daily Context and Fair Value Gap Setup
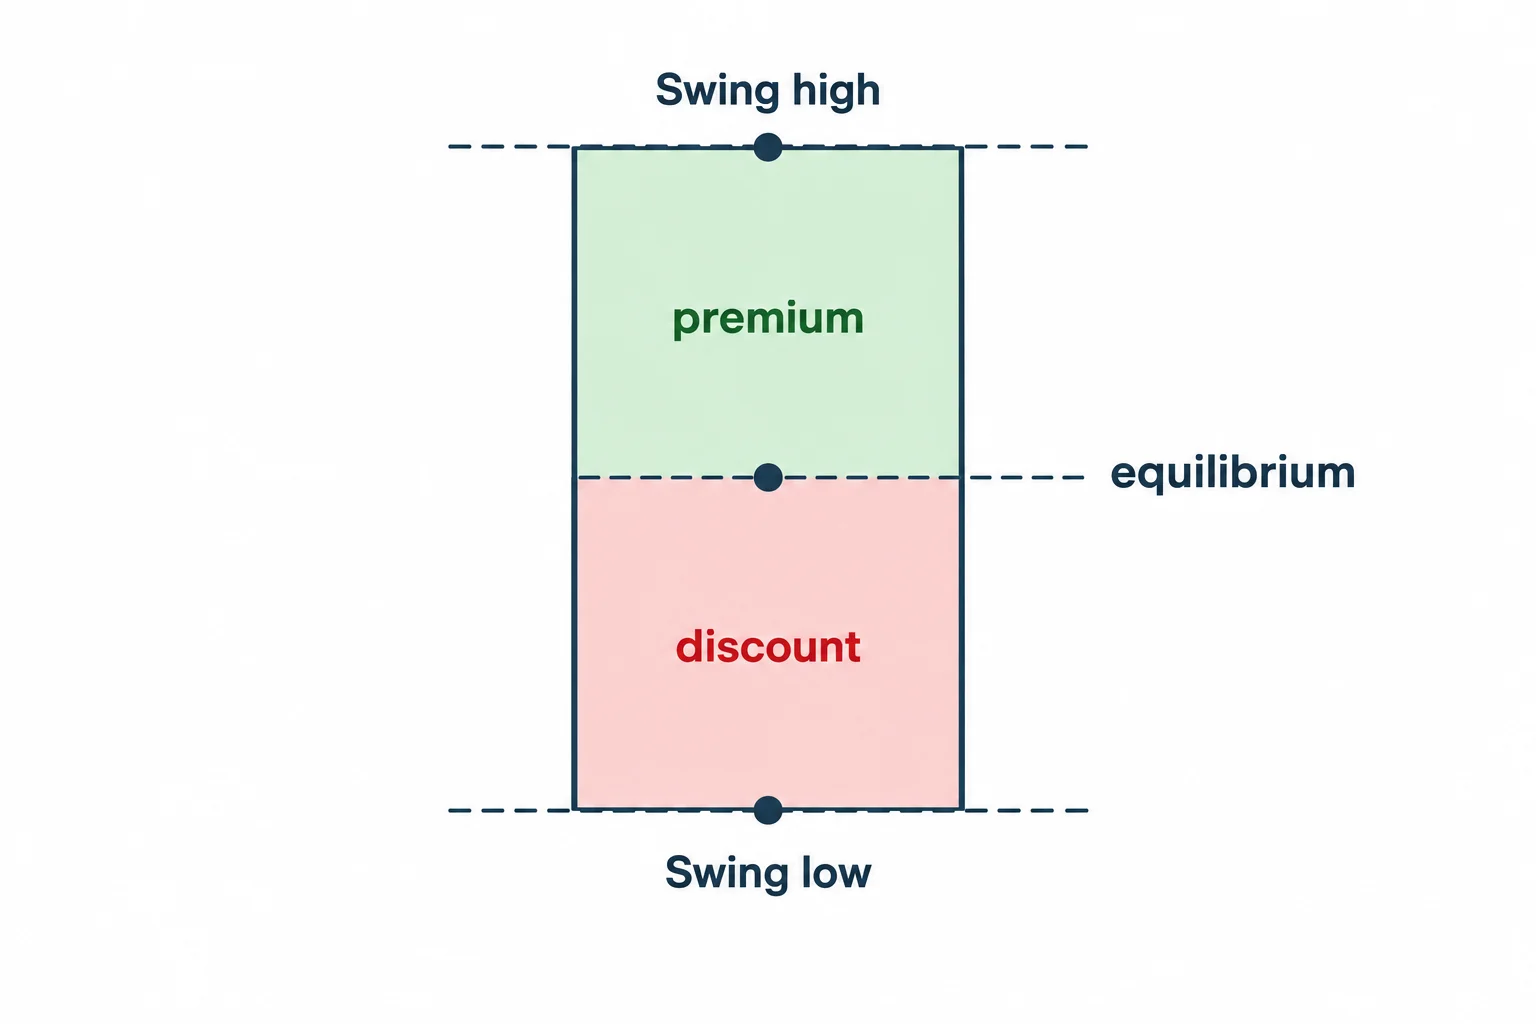
The chart discussion starts with a continuous Nasdaq E-mini futures chart. ICT defines a recent swing high and swing low, then uses the midpoint of that range as “equilibrium.” In his terminology, prices below the midpoint are in discount and prices above it are in premium.
He observes that Monday traded deeply into the lower part of the range but did not remove all of the lows under discussion. The session then closed with an indecisive candle whose opening and closing prices were close together. ICT interprets that combination as a reason a retracement could occur before any further move toward lower liquidity.
He also identifies a daily-chart imbalance, which he calls a fair value gap, and notes that Tuesday’s overnight trading moved back into it. These higher-time-frame references provide the narrative for the lower-time-frame examples; they are not presented as automatic entry signals by themselves.
2022 ICT February 14 Afternoon Setup
Beginning around 4:05, ICT reviews Monday’s intraday sequence. Price fell overnight, consolidated and rallied before the equities open. After relative equal highs were exceeded, he focuses on a return into an earlier imbalance.
Within that area, he identifies consecutive down-close candles preceding an upward displacement as a bullish order block. At 7:07, the lesson shifts to a five-minute view to explain how the order block, fair value gap and retracement overlap. He stresses that one daily boundary was only knowable after Monday closed, cautioning viewers against reading later chart information back into an earlier decision.
The example is then narrowed to a one-minute chart near 2:00 p.m. New York time. ICT describes price moving above a short-term high, leaving an imbalance and retracing into it while inside the broader order-block area. In his framework, that alignment supported a bullish afternoon scenario, with previous highs serving as potential liquidity objectives.
Why ICT Avoids Chasing Overnight Move Setups
The February 15 example begins at 11:00. A substantial part of the day’s advance had occurred overnight and during the London session. ICT explicitly says he did not anticipate or participate in that move.
His practical lesson is restraint: after an unusually large overnight range, he expects the New York morning to have an increased chance of consolidation or choppy movement. Rather than buying merely because price has already risen, he says he waits for additional information. He defines the relevant overnight window in this discussion as approximately 2:00–5:00 a.m.
For equity index futures specifically, ICT says at 15:20 that he prefers avoiding the New York morning after a large overnight run and waiting until after lunch, around 1:00 p.m. New York time. He then watches for price to move beneath the lunch-period or morning lows before attempting to rally. He expressly distinguishes this part of the discussion from his comments about foreign exchange.
ICT New York Liquidity Sweep Setup
ICT reads the relatively equal intraday lows as a location where protective sell stops could accumulate. In the chart sequence, price trades below those lows and into an imbalance before rallying. He characterizes this as a removal of sell-side liquidity.
After 2:00 p.m., the lesson looks for confirmation through displacement: price breaks a nearby swing high energetically and leaves another fair value gap. A retracement into that gap becomes the setup ICT studies. At 20:12, he explains both an initial retracement and a later opportunity for someone who missed the first move.
The transcript includes a hypothetical entry, stop placement and reward-to-risk calculation using Micro E-mini contracts. These figures illustrate ICT’s chart example; the recording does not establish an independently verified fill, account result or repeatable performance. He also acknowledges that the hypothetical position would have experienced adverse movement rather than advancing immediately.
2022 ICT Mentorship Episode 9 Key Takeaways
- Start with context: ICT moves from a daily dealing range and imbalance to five-minute and one-minute execution examples.
- Do not use hindsight levels: a boundary established by the completed daily candle was not available earlier in that session.
- Separate direction from timing: a bullish narrative does not mean buying an extended overnight advance; ICT waits for a retracement and lower-time-frame structure.
- Reduce activity in poor conditions: much of the lecture concerns avoiding repeated trades during sideways, volatile price action.
- Expect imperfect reactions: near 25:12, ICT says a brief move through a fair value gap does not necessarily invalidate it within his model, particularly when candle bodies still react around the area.
This episode is best understood as an explanation of ICT’s own market model and chart-reading process. It is educational commentary, not investment advice, and the transcript alone cannot verify unseen chart details, actual executions or later outcomes.




