
Key takeaways
ICT’s 2022 Mentorship Episode 7 uses Nasdaq, S&P 500 and Dow futures from February 8, 2022 to explain a conditional daily-bias framework based on prior highs and lows, displacement, retracement and fair value gaps.
Read the full summary
ICT’s 2022 Mentorship Episode 7 uses Nasdaq, S&P 500 and Dow futures from February 8, 2022 to explain a conditional daily-bias framework based on prior highs and lows, displacement, retracement and fair value gaps. A bearish daily structure supports seeking intraday shorts until lower objectives are reached, but consolidation near range equilibrium weakens directional confidence and may require waiting beyond the nine thirty a.m. New York open, shifting to old intraday highs and lows on lower time frames and pursuing smaller objectives. On the 15-minute chart, ICT marks eight thirty a.m. and favors candle extremes as likely liquidity locations. Around 15 minutes 45 seconds, he uses a two-minute S&P chart as an indicator for a Nasdaq long after the S&P trades below an earlier low, breaks a short-term high, forms a bullish market-structure shift and fair value gap, then retraces into the gap. Dow’s refusal to make a lower low while Nasdaq and S&P do is treated as supporting intermarket divergence, though ICT says divergence must confirm an existing narrative at a relevant time and liquidity area rather than create one. Daily bias is presented as an imperfect, adjustable map combining higher-time-frame destination and lower-time-frame confirmation, not statistical evidence of predictive reliability, verified fills, costs, stops, risk parameters or long-term profitability.
How we researched this article
BestProps used document-based research from primary firm sources, checked September 25, 2026. The complete source list, scope, limitations, and commercial-state record appear near the end of this article.
- 2022 ICT Mentorship Episode 7 (YouTube) the primary recording narrated in this article.
- 2022 ICT Mentorship Episode 8 (YouTube) adjacent mentorship lesson covering the same multi-timeframe Forex framework in detail.
- Fair Value Gaps vs Order Blocks – The Inner Circle Traders companion-site primer on the FVG three-candle pattern. Unofficial, untested third-party tutorial.
- ICT Trading Books and PDF Guide – The Inner Circle Traders companion-site overview of the 2022 ICT Mentorship series. Unofficial, untested third-party tutorial.
2022 ICT Mentorship Episode 7 Video Overview
The recording is the seventh instalment of ICT’s 2022 mentorship and, like episodes 6 and 8, is centred on equity-index futures. ICT discusses the Nasdaq, S&P 500 and Dow while reviewing the February 8, 2022 trading session. The transcript itself is automatically generated from the original YouTube audio and was not human-verified; ambiguous terms and numbers in the narration should be checked against the on-screen chart in the video before being acted on.
Because the recording is a single continuous walkthrough rather than a study of historical outcomes, the transcript cannot, on its own, establish trade fills, transaction costs, stop placement, risk parameters, or longer-term performance. The aim of this article is to summarise and contextualise ICT’s own description of the chart, not to validate his framework statistically.
Daily Bias in 2022 ICT Mentorship Episode 7
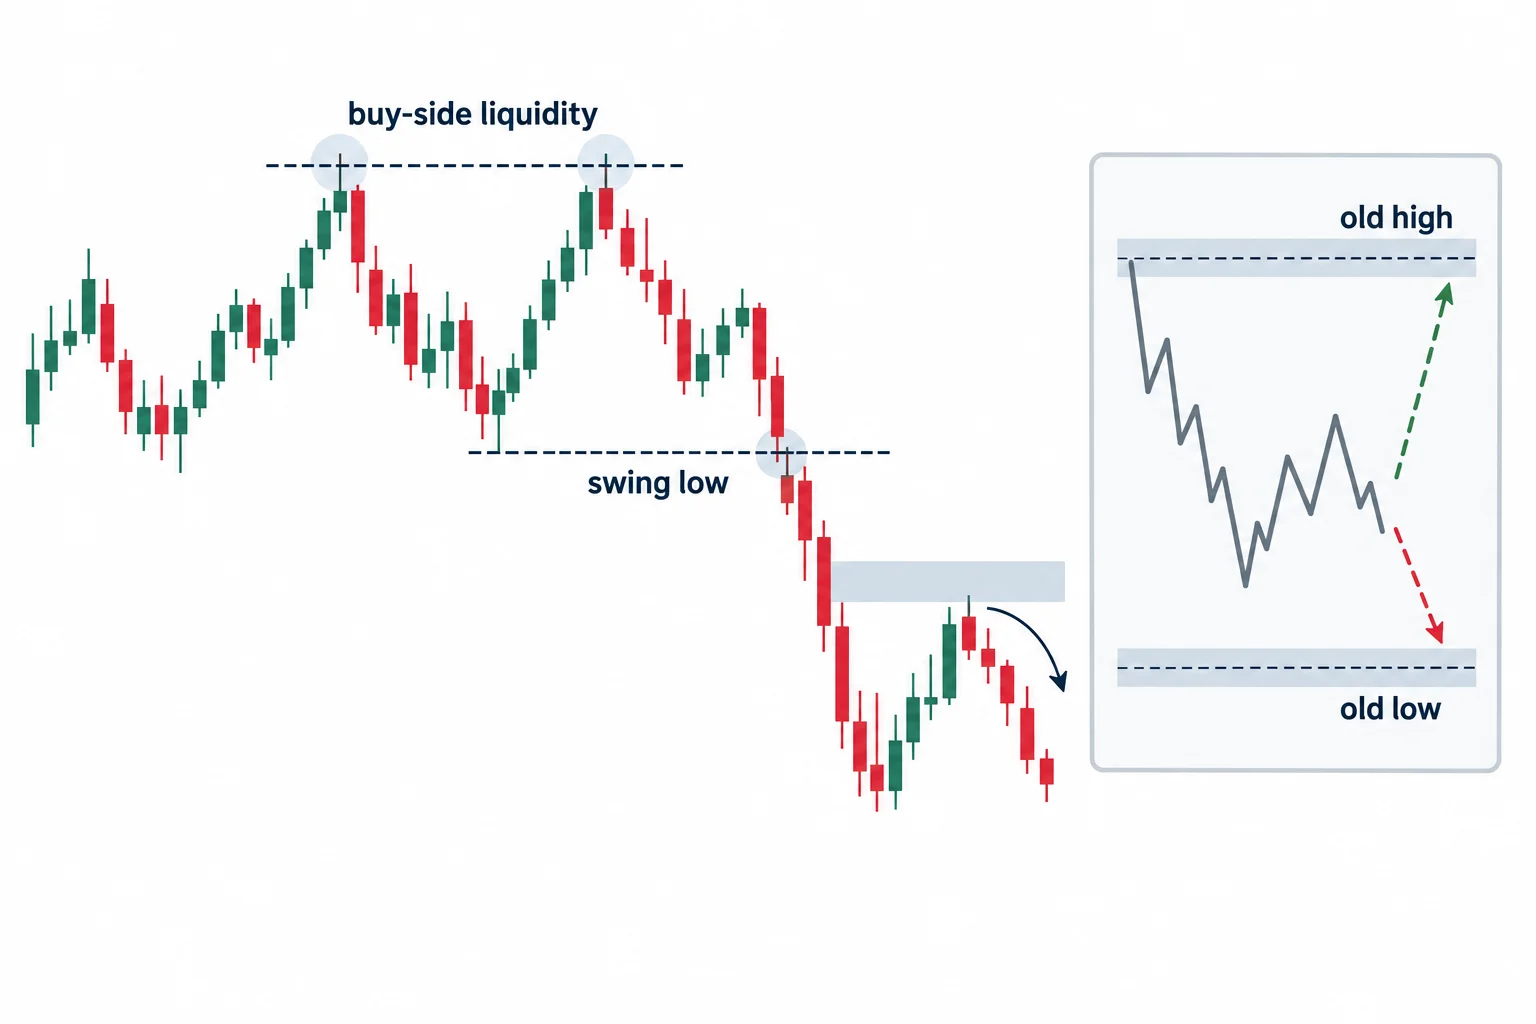
At 0:25, ICT opens a daily Nasdaq chart and asks the viewer to consider whether price has run above prior relative equal highs (which he labels buy-side liquidity) before breaking below a swing low (0:48). He then describes a downward sequence including a run into a discount area and a bounce off an old low (2:13).
His simplified method for daily bias is to ask where price appears likely to be drawn next:
- An old high may represent a potential upside objective.
- An old low may represent a potential downside objective.
- A displacement away from an area and a subsequent retracement may help frame the active range.
- The directional idea remains provisional and should be reassessed when the objective is reached or price begins consolidating.
At 3:43, ICT describes a bearish daily structure: a shift lower followed by a retracement into what he calls a fair value gap. Within his framework, he would continue looking primarily for intraday short setups until the identified lower objectives were reached. He emphasises that this does not require every candle to close down.
The broader educational interpretation is that higher-time-frame analysis can establish a scenario without dictating every lower-time-frame move. A bearish daily thesis can coexist with intraday rallies, and an individual losing trade does not by itself establish whether the original thesis was sound.
Why Consolidation Creates a Daily Bias Hurdle
ICT identifies a more difficult condition at 2:19: price has consolidated around equilibrium (the midpoint of a range). He openly says there are times when he does not have a clear directional read (2:31). His response is to demand more information after the 9:30 a.m. New York open rather than pretend certainty (2:38).
He returns to this issue at 10:25: once price starts hanging inside a range after the anticipated objective, he suggests shifting attention to lower-time-frame liquidity pools. In his terminology, that means watching old intraday highs and lows and pursuing more limited objectives instead of assuming a large directional continuation.
This is the episode’s "consolidation hurdle": a broad directional narrative becomes less dependable near the middle of a range. The practical takeaway is to recognise when available evidence is mixed and reduce the scope of the forecast. This is an interpretation of ICT’s teaching, not evidence that the method predicts market direction reliably.
Episode 7 Daily Bias and Intraday Liquidity
On the 15-minute chart, ICT places a vertical reference at 8:30 a.m. and looks left for the nearest meaningful highs and lows (11:19, 11:23). At 11:17, he explains that he favours the extreme of a candle rather than an interior low when identifying where liquidity may rest.
He also treats relative equal highs as an area where conventional resistance traders might act and where stops could accumulate. In the reviewed session, he says price first traded below an old low and subsequently reversed toward earlier highs. Because the transcript cannot show the chart, the exact visual placement of these levels should be checked against the video itself.
ICT Daily Bias Using the S&P and Dow
A major part of the episode concerns intermarket comparison. Around 15:45, ICT moves to a two-minute chart and chooses the S&P as his indicator (15:46). The Nasdaq chart alone did not, in his telling, supply bullish evidence at that point; the S&P did.
In the S&P, he identifies the following sequence:
- Price traded below an earlier low.
- A forceful move then broke a short-term high, which he calls a bullish market-structure shift.
- The movement left a fair value gap in his reading of the two-minute candles.
- Price retraced into that gap, providing the timing context he used as a Nasdaq long.
At 20:46, ICT explains that he treated the S&P as an "indicator" for Nasdaq because the indices generally move in the same direction. He did not require the same fair value gap to appear in Nasdaq if the related S&P structure supplied the timing context.
He adds another comparison at 22:53: while Nasdaq and S&P made lower lows, the Dow did not. ICT interprets this crack in correlation as confirmation of a bullish idea that had already been formed. Importantly, he warns that divergence by itself means little. In his framework, it must occur at a relevant time and liquidity area and support an existing narrative rather than create one from nothing.
ICT Daily Bias Execution and Risk
Throughout the lesson, ICT rejects the expectation of perfect entries, exits or daily forecasts. At 7:15, he tells viewers to accept imperfection and distinguish being right from achieving a profitable overall process.
He also describes placing small live "leader" positions to obtain feedback during uncertain conditions. That is a personal practice he attributes to floor-trading ideas, not a necessary component of the analytical framework. Deliberately risking money to "feel" the market can create losses and is not equivalent to obtaining objective information. Learners can instead document hypotheses and study market reactions without committing capital.
The episode's more durable lesson appears near 56:10: a daily bias will not work in one's favour every day, and new information may require adjustment. Daily bias is therefore best understood as a conditional map (higher-time-frame destination, lower-time-frame confirmation, and explicit recognition of when consolidation makes the map less clear).
This summary is educational commentary on ICT’s stated methodology. It is not investment advice, a profitability claim or a recommendation to trade futures.
2022 ICT Mentorship Episode 7 Resources
- 2022 ICT Mentorship Episode 7 (YouTube) the primary recording narrated in this article.
- 2022 ICT Mentorship Episode 8 (YouTube) adjacent mentorship lesson covering the same multi-timeframe Forex framework in detail.
- Fair Value Gaps vs Order Blocks – The Inner Circle Traders companion-site primer on the FVG three-candle pattern. Unofficial, untested third-party tutorial.
- ICT Trading Books and PDF Guide – The Inner Circle Traders companion-site overview of the 2022 ICT Mentorship series. Unofficial, untested third-party tutorial.





