
Key takeaways
ICT 2022 Mentorship Episode 36 on YouTube applies ICT’s premium, discount, fair value gap, liquidity, and market structure framework to the June 2022 E-mini S&P 500 futures contract.
Read the full summary
ICT 2022 Mentorship Episode 36 on YouTube applies ICT’s premium, discount, fair value gap, liquidity, and market structure framework to the June 2022 E-mini S&P 500 futures contract. Price below an hourly range’s 50% equilibrium is classified as discount and price above it as premium, while five-minute relative equal lows mark presumed sell-side liquidity. ICT interprets the session as a decline through lows near the nine thirty opening, a bullish structure shift, a rally, and a retracement into a five-minute fair value gap before continuation toward prior highs. At five minutes 15 seconds, he argues that only structure shifts aligned with the larger objective from discount toward premium are meaningful. He reports buying five contracts at 4120 after sell stops were cleared, exiting three at 4139.25 and two at 4143.75, with roughly five handles of adverse movement, though the transcript does not verify fills, costs, or results. The model filters trades by range position, liquidity taken, and direction toward the opposite side of the range, making range and swing selection subjective. From seven minutes 57 seconds, ICT emphasizes selectivity, saying he planned to stop trading by Wednesday ahead of non-farm payrolls and a new month because no clear daily-chart objective existed.
How we researched this article
BestProps used document-based research from primary firm sources, checked September 25, 2026. The complete source list, scope, limitations, and commercial-state record appear near the end of this article.
In 2022 ICT Mentorship Episode 36, ICT reviews an intraday E-mini S&P 500 futures session using his concepts of premium and discount, fair value gaps, liquidity, and shifts in market structure. The lesson moves from an hourly dealing range to five-minute and lower-timeframe analysis, then concludes with a discussion of selectivity and rules of engagement.
This summary explains ICT’s interpretation of the session. It should not be read as independent validation of the methodology or as investment advice.
ICT Discount and Market Structure on the Hourly Chart
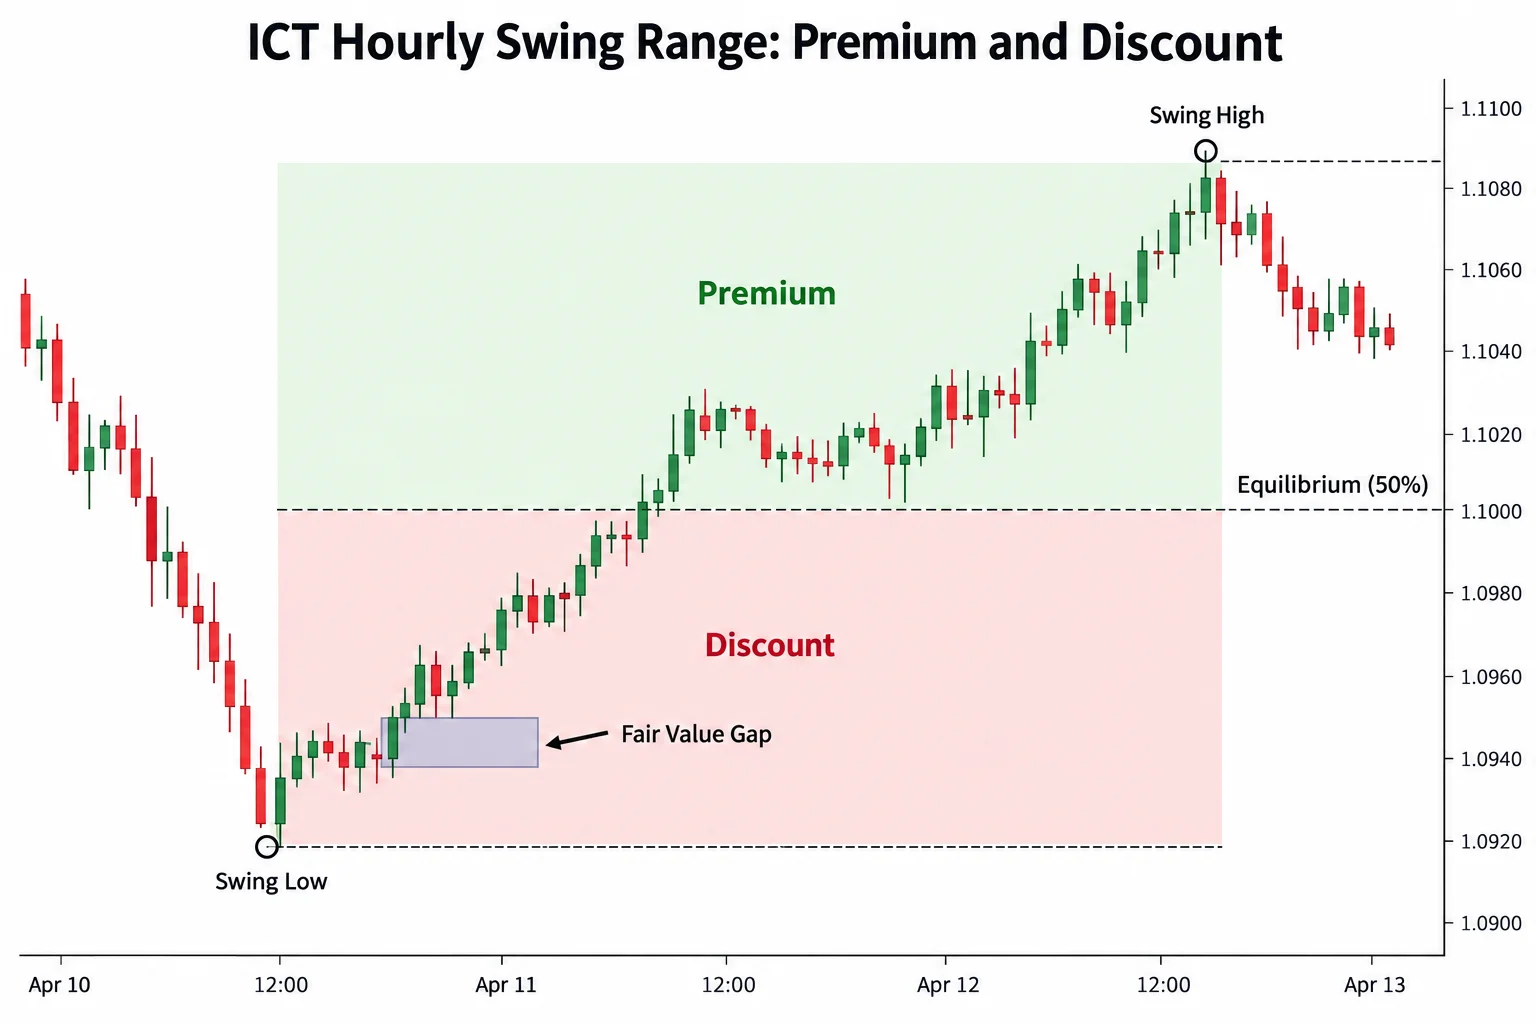
ICT begins with the June 2022 E-mini S&P futures contract and briefly notes that futures contracts transition between delivery months. He then marks an hourly swing low and swing high to define a range. The midpoint of that range is described as equilibrium: prices above it are in premium, while prices below it are in discount.
At 0:52, he says the market had moved below equilibrium and into what he identifies as a fair value gap. Within ICT’s framework, that combination placed price in a discounted or “oversold” area. He stresses that he is not using a conventional oscillator to reach that conclusion. The Fibonacci tool shown in the presentation is used to highlight the range midpoint rather than to generate a standalone signal.
ICT Liquidity and Market Structure on the Five-Minute Chart
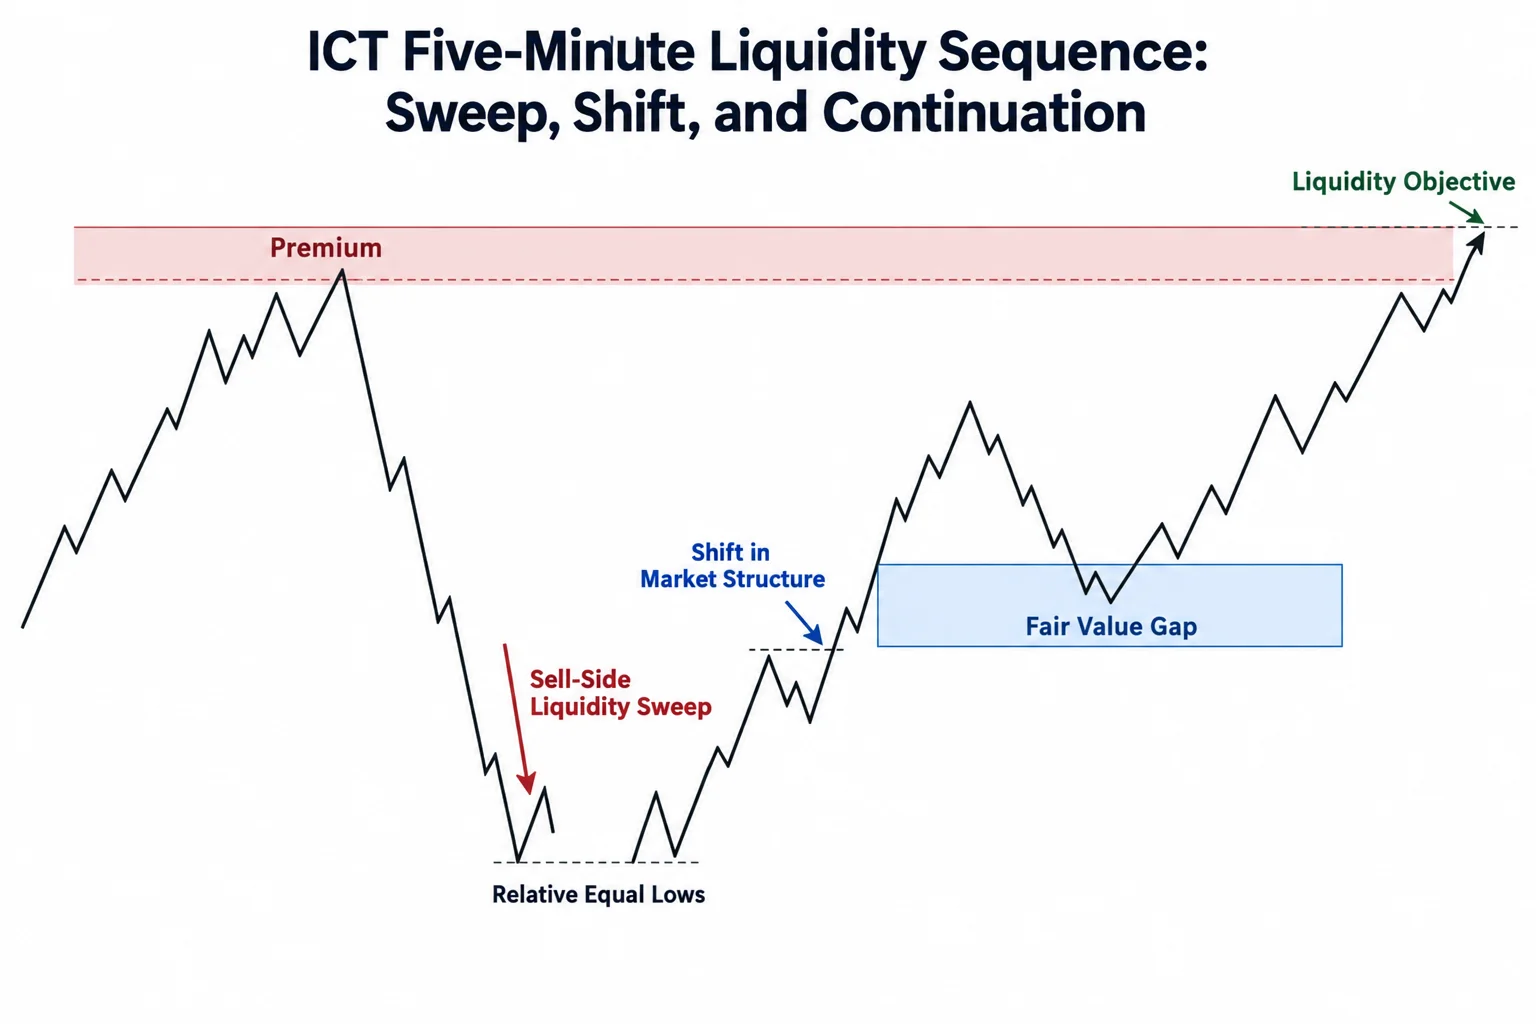
On the five-minute chart, ICT describes an earlier advance into the premium portion of a local range, followed by a sharp decline through relative equal lows. At 1:47, he labels the orders presumed to rest beneath those lows as sell-side liquidity.
His account of the morning sequence is:
- Price advanced into a premium area.
- The market fell through nearby lows around the 9:30 opening period.
- A subsequent shift in market structure suggested a change in short-term direction.
- Price rallied and rebalanced part of the earlier displacement.
- A pullback entered a five-minute fair value gap before another move higher.
ICT says the morning high became a draw on liquidity and that price subsequently moved above it. This is his retrospective chart interpretation; the transcript alone cannot establish the precise chart levels or whether another analyst would mark the same structures.
How ICT Identifies a Meaningful Market Structure Shift
A central teaching point appears at 5:15. ICT considers two possible short-term structure shifts and asks which one matters for the intended trade. His answer depends on the larger range and directional objective: because he was anticipating a move from discount toward premium, he treats the shift aligned with that thesis as the relevant one.
He also says that not every fast move offers a model entry. In his reading, the rapid decline was primarily clearing sell-side liquidity rather than presenting a clean setup during the fall. After the lows were breached, he points to a rally, a retracement into a fair value gap, and additional reactions around areas he calls an order block and an imbalance.
ICT Educational Context
The broader lesson is that a market-structure break is not evaluated in isolation. ICT filters it through three contextual questions:
- Where is price relative to the range midpoint?
- Has liquidity above or below a visible swing been taken?
- Does the structure shift support the anticipated move toward the opposing side of the range?
This creates a narrative-based framework rather than a mechanical rule in which every broken swing automatically becomes an entry. That flexibility also introduces subjectivity: the chosen range, significant swing, fair value gap, and directional objective all affect the conclusion.
ICT Market Structure Trade Example
ICT states that he bought after sell stops beneath a short-term low had been cleared. At 6:48, he reports an entry at 4120 using five contracts. He then describes taking three contracts off at 4139.25 and the final two at 4143.75. These are the speaker’s claims from the narration; the transcript does not independently verify executions, fills, chart placement, costs, or the complete result.
ICT’s stated rationale was that clearing sell-side liquidity left price free to seek a higher short-term objective. He also mentions experiencing roughly five handles of adverse movement on the position. The example illustrates how he links a liquidity sweep, a structure shift, and a retracement into an identified area before targeting liquidity above prior highs.
ICT Market Rules and Trade Selectivity
The closing section shifts from chart mechanics to trading discipline. Beginning around 7:57, ICT discusses the approaching non-farm payroll scenario and the transition into a new month. He says he preferred to finish his trading by Wednesday that week because he did not have a clear daily-chart objective.
His practical message is that having additional sessions available does not require continued participation. He attributes consistency to having rules of engagement and says he would rather remain inactive when he sees plausible arguments for movement in either direction. This is a risk-control principle presented by ICT, not evidence that any particular schedule or market model is profitable.
ICT Discount Liquidity and Market Structure Takeaways
Episode 36 presents a top-down reading of an intraday session: define an hourly range, classify price as premium or discount, identify liquidity around prior highs and lows, and interpret lower-timeframe structure in that context. ICT’s final emphasis is restraint. When the larger objective is unclear, his stated response is to stop seeking additional trades rather than force a directional thesis.
2022 ICT Mentorship Episode Resources
- Primary source: ICT 2022 Mentorship Episode 36 (YouTube)
- Fair value gap concept overview (Babypips) (unofficial third-party explanation; not tested or endorsed by BestProps).
- Market structure definition (Investopedia) (general reference; not specific to ICT's framework).
- E-mini S&P 500 futures contract specifications (CME Group) (official exchange reference for the instrument discussed).





