
Key takeaways
2022 ICT Mentorship Episode 30, uploaded May 17, 2022, reviews an afternoon index-futures move around scheduled Federal Reserve chair remarks using bottom-up analysis from the one-minute chart through five-minute, 15-minute, and daily charts.
Read the full summary
2022 ICT Mentorship Episode 30, uploaded May 17, 2022, reviews an afternoon index-futures move around scheduled Federal Reserve chair remarks using bottom-up analysis from the one-minute chart through five-minute, 15-minute, and daily charts. With a bullish higher-time-frame premise, ICT waits for price to sweep New York lunch lows formed between noon and 1 p.m., then interprets a one-minute imbalance, order block, fair value gap, and optimal trade entry as a sequence supporting movement toward liquidity at 12,553.25 rather than treating the initial selloff as a short setup. The morning high was 12,535.50, price reportedly began advancing toward the objective around 3 p.m., consolidated below it, and then traded through it. ICT says he entered long below relative equal lows despite considering the entry poor and reports a little over $5,000 in hypothetical paper profit, but the order, fill, stop, exit, and result are not independently verified. He also states at 8 minutes 16 seconds that the concepts are not a panacea and will not work all the time, making the episode a retrospective educational explanation rather than evidence of repeatable performance.
How we researched this article
BestProps used document-based research from primary firm sources, checked September 19, 2026. The complete source list, scope, limitations, and commercial-state record appear near the end of this article.
2022 ICT Mentorship Episode 30, uploaded May 17, 2022, examines an afternoon index-futures move around remarks from the Federal Reserve chair. ICT begins with a one-minute chart and then works outward through higher time frames. His central lesson is that a bullish afternoon premise does not require buying immediately: price may first move below the New York lunch lows before advancing toward liquidity above the market.
2022 ICT Mentorship Episode 30 Bottom-Up Liquidity Review
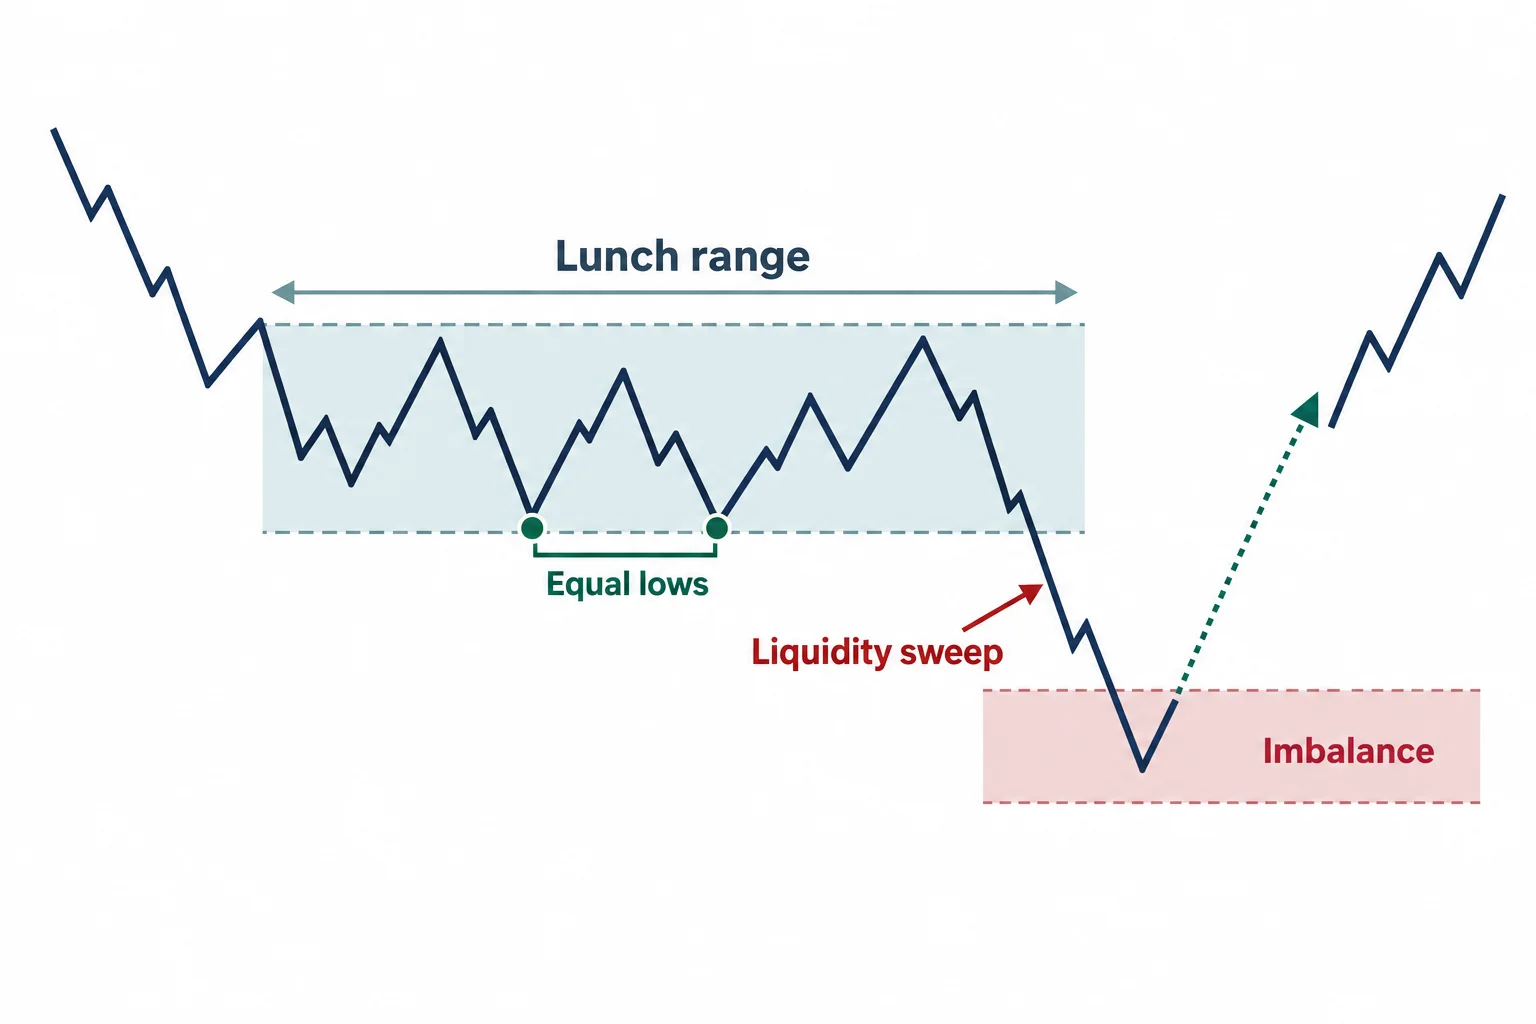
At 0:18, ICT describes the presentation as “bottom-up analysis.” Instead of beginning with a daily chart, he first reviews the one-minute action surrounding the scheduled remarks and later places that movement in a broader context.
He identifies an initial rise that approached, but did not quite reach, a morning high of 12,535.50. Price then moved lower through relatively equal lows formed during the New York lunch period. In ICT’s interpretation, that decline was not automatically a short setup. He instead viewed the lunch lows as liquidity that could be taken before an anticipated continuation higher.
The relevant teaching begins around 1:29. ICT says that when he expects bullish afternoon continuation, he watches for price to sweep lows established between noon and 1:00 p.m. New York time. In this example, he also points to a nearby one-minute imbalance below those lows.
ICT Afternoon Liquidity and the Initial Selloff
ICT repeatedly distinguishes a directional price move from a valid setup under his framework. Although the market sold off, he says his model did not produce a short entry during that decline. He characterizes the movement around the equal highs and lows as a process that could trigger breakout purchases, remove protective stops from earlier long positions, and encourage traders to enter short before a reversal.
At 2:38, he explains his view of how buy stops and breakout entries could become trapped during the reversal. These are ICT’s market interpretations, not independently established facts about the intentions of market participants or an exchange algorithm.
His upside objective was 12,553.25, a level he describes as a draw on liquidity. The transcript contains a spoken correction around 3:19, where he notes that an on-screen annotation mistakenly omitted part of that number. Because the source available here is an automatically generated transcript rather than the chart itself, the exact placement of every marked level cannot be visually confirmed.
ICT Afternoon Liquidity With Order Blocks and Imbalances
ICT says he took a long position below the relative equal lows, while acknowledging that he considered the entry poor. He refers viewers to a separate social-media recording for the real-time execution, but that recording is not part of this source. Consequently, the transcript alone cannot verify the order, fill, stop placement, or exit.
From roughly 5:01, he discusses repeated interaction with what he labels an order block, as well as a fair value gap that price did not initially reach. He then says that around 3:00 p.m. price began moving toward the liquidity objective. In his account, the market paused and consolidated below the target before trading into and above the 12,553.25 area.
The instructional point is less about reproducing one precise entry and more about sequencing:
- Form a higher-time-frame directional premise.
- Mark a potential liquidity objective above the market.
- Observe the New York lunch range.
- Under a bullish premise, wait to see whether lunch lows are swept.
- Require the speaker’s lower-time-frame formations rather than treating every decline as a short signal.
ICT Liquidity in Higher Time Frame Analysis
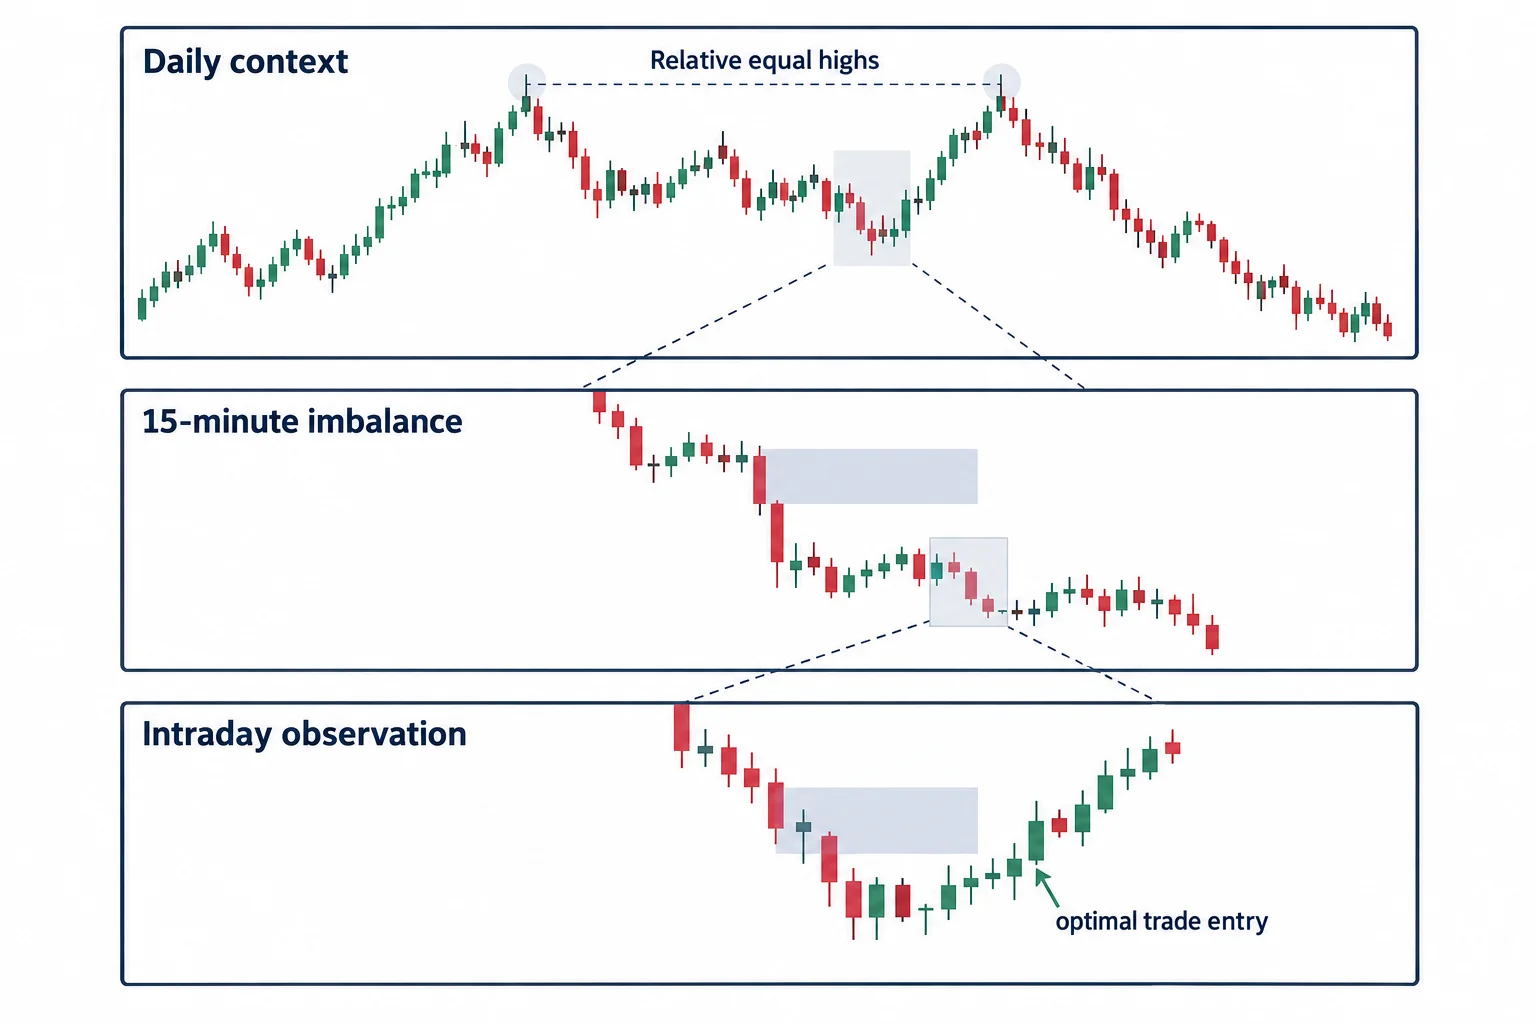
At 7:05, ICT moves to a five-minute chart. He again stresses that the afternoon decline did not present his model, even though price did move lower. At 8:16, he explicitly says the concepts are not a panacea and will not work all the time.
He next reviews a 15-minute imbalance and what he calls an optimal trade entry at 9:03. He ultimately reaches the daily chart around 10:30, where he connects the intraday objective with relative equal highs visible in his higher-time-frame analysis.
Episode 30 Takeaway on the Afternoon Liquidity Sequence
The broader lesson is selective participation. In ICT's framework, a market moving down is not by itself sufficient reason to sell, particularly when his higher-time-frame premise points toward liquidity above. He presents the sweep of lunch lows, the interaction with an imbalance or order block, and subsequent bullish movement as a combined narrative, not as independent signals that must always produce the same result.
Near the conclusion, ICT reports a little over $5,000 in hypothetical profit from a paper trade. That statement is a self-reported simulation outcome in the narration, not verified performance evidence. The episode is best treated as an explanation of ICT’s retrospective chart-reading process rather than proof of a repeatable trading advantage.
This summary is for education and source commentary only. It is not investment advice or a performance promise.





