
Key takeaways
ICT’s 2022 Mentorship Episode 27, uploaded May 14, 2022, presents a paper-traded counter-trend long model built from higher-timeframe buy-side liquidity near 12,553, an hourly sweep of relative equal lows, a nine thirty a.m.
Read the full summary
ICT’s 2022 Mentorship Episode 27, uploaded May 14, 2022, presents a paper-traded counter-trend long model built from higher-timeframe buy-side liquidity near 12,553, an hourly sweep of relative equal lows, a nine thirty a.m. New York run below overnight or London lows, a 15-minute dealing range, an afternoon retracement below the 50% equilibrium into discount, a fair value gap, and bullish lower-timeframe displacement. Around 8 minutes 58 seconds, ICT uses a two-minute order block and adjacent fair value gap as the intended entry area, then states at 9 minutes 57 seconds that the multiple-contract entries were simulated. He scaled out, accidentally closed part at market while using an unfamiliar phone interface, missed his intended exits, and acknowledged that the larger liquidity objective was never reached. The framework requires a defined objective above price, prior removal of sell-side liquidity, an objective intraday range, entry below equilibrium, and displacement in the intended direction rather than using fair value gaps alone. From about 14 minutes 14 seconds, ICT recommends replay and hindsight review marking liquidity, ranges, imbalances, displacement, entries, invalidation points, and scaling opportunities, plus first-person journaling that preserves the original hypothesis. All orders, fills, balances, chart data, and large account-performance claims shown were unverified paper-trading examples and should not be treated as evidence of live profitability.
How we researched this article
BestProps used document-based research from primary firm sources, checked September 25, 2026. The complete source list, scope, limitations, and commercial-state record appear near the end of this article.
Episode 27 of the 2022 ICT Mentorship examines how ICT framed an intraday bullish retracement against a broader declining market. The lesson connects higher-timeframe liquidity, a sweep of prior lows, discount pricing, a fair value gap, and lower-timeframe displacement. It also includes a candid discussion of simulated execution mistakes and a longer section on chart review and journaling.
Primary source: 2022 ICT Mentorship Episode 27 – Counter Trend Ideas, uploaded May 14, 2022. The examples shown by ICT were paper trades, not verified live-account results.
2022 ICT Mentorship Liquidity Objectives
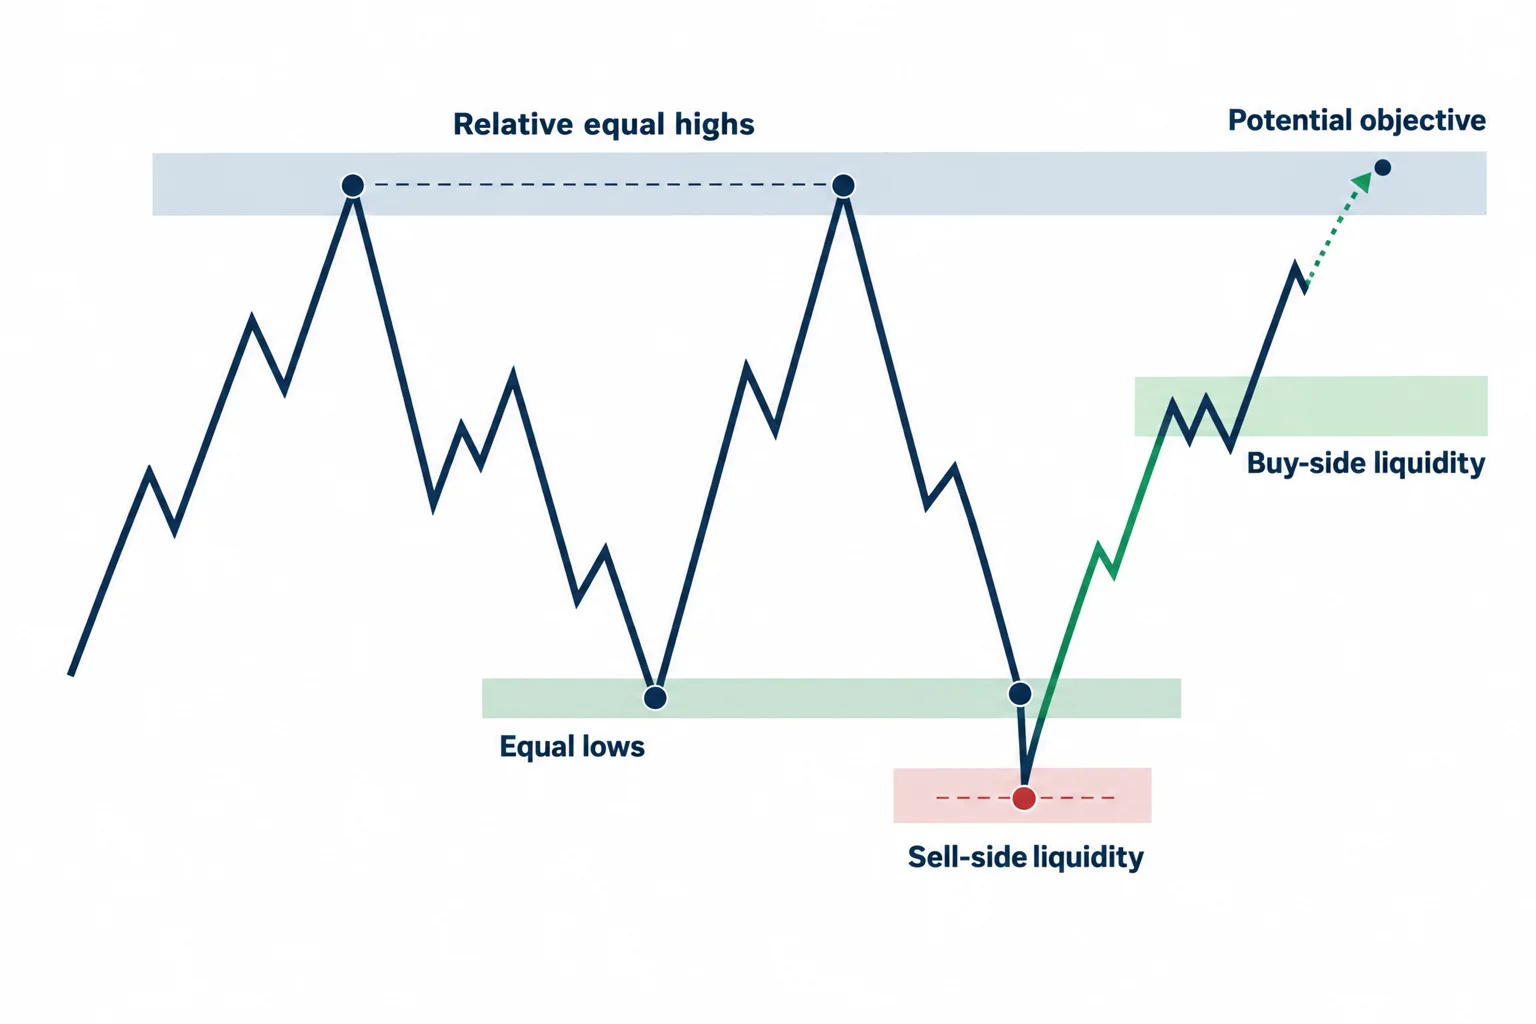
ICT begins with what the generated captions identify as a June 2022 daily chart, although the instrument name is unclear in the transcript. He highlights relative equal highs near a level he reads as 12,553 and treats the resting liquidity above them as a possible draw for price. Watch the discussion from 0:50.
An important qualification follows at 2:02: in ICT’s framework, price does not have to reach the ultimate liquidity objective for an intraday setup to be useful. The objective supplies directional context, while trade management can use nearer targets. This distinction matters because the session described in the video did not reach the larger level.
On the hourly chart, ICT identifies relative equal lows that had been breached before price returned above them. He interprets this as a sweep of sell-side liquidity. With that lower pool already addressed, he looks toward buy-side liquidity above the market. His “magnet” description is a teaching analogy for directional bias, not evidence that price must move to the identified highs.
ICT Episode 27 Morning Sweep and Counter Trend Retracement
At 4:14, the lesson moves to the 15-minute chart. ICT says the 9:30 a.m. New York move ran below an overnight or London-session low and then rallied. In his terminology, that decline was a manipulation leg that removed sell-side liquidity before the upward move.
ICT says he did not participate in the initial rally. Instead, he studied the afternoon pullback. On the five-minute chart, he defines a dealing range from the session low to a subsequent high and asks whether the retracement has entered “discount” (the portion at or below the range’s 50% equilibrium level).
The proposed sequence is:
- Price trades below the overnight lows around the New York open.
- The market rallies and establishes an intraday range.
- A lunchtime high is followed by an afternoon retracement.
- The pullback reaches equilibrium and then trades into discount.
- Price enters an imbalance that ICT labels a fair value gap.
- Lower-timeframe upward displacement is treated as a market-structure shift supporting the counter-trend long thesis.
The equilibrium and fair value gap discussion begins around 6:42. ICT characterizes the bullish move as counter-trend because the larger market had been declining, while his intraday expectation was for a retracement higher.
ICT Counter Trend Confirmation and Simulated Execution
ICT compares several chart intervals before focusing on a two-minute chart at 8:58. There he marks bearish candles as an order block and identifies an adjacent fair value gap. The intended long entry area is where price retraces into those lower-timeframe features after the bullish shift.
He reports buying multiple contracts as price entered the gap, but explicitly states at 9:57 that these were paper trades used to illustrate execution and theory. The transcript cannot independently verify the displayed orders, fills, account balance, or chart data.
The execution review is useful because it is not presented as flawless. ICT says he scaled out of the position and accidentally closed part of it at market while trying to place a limit order from his phone. He uses that mistake to caution against entering or managing complex orders on an unfamiliar mobile interface. He also acknowledges that none of his exits reached the price he had initially wanted and that the larger liquidity objective was not met that day.
Why ICT Calls This a Counter Trend Idea
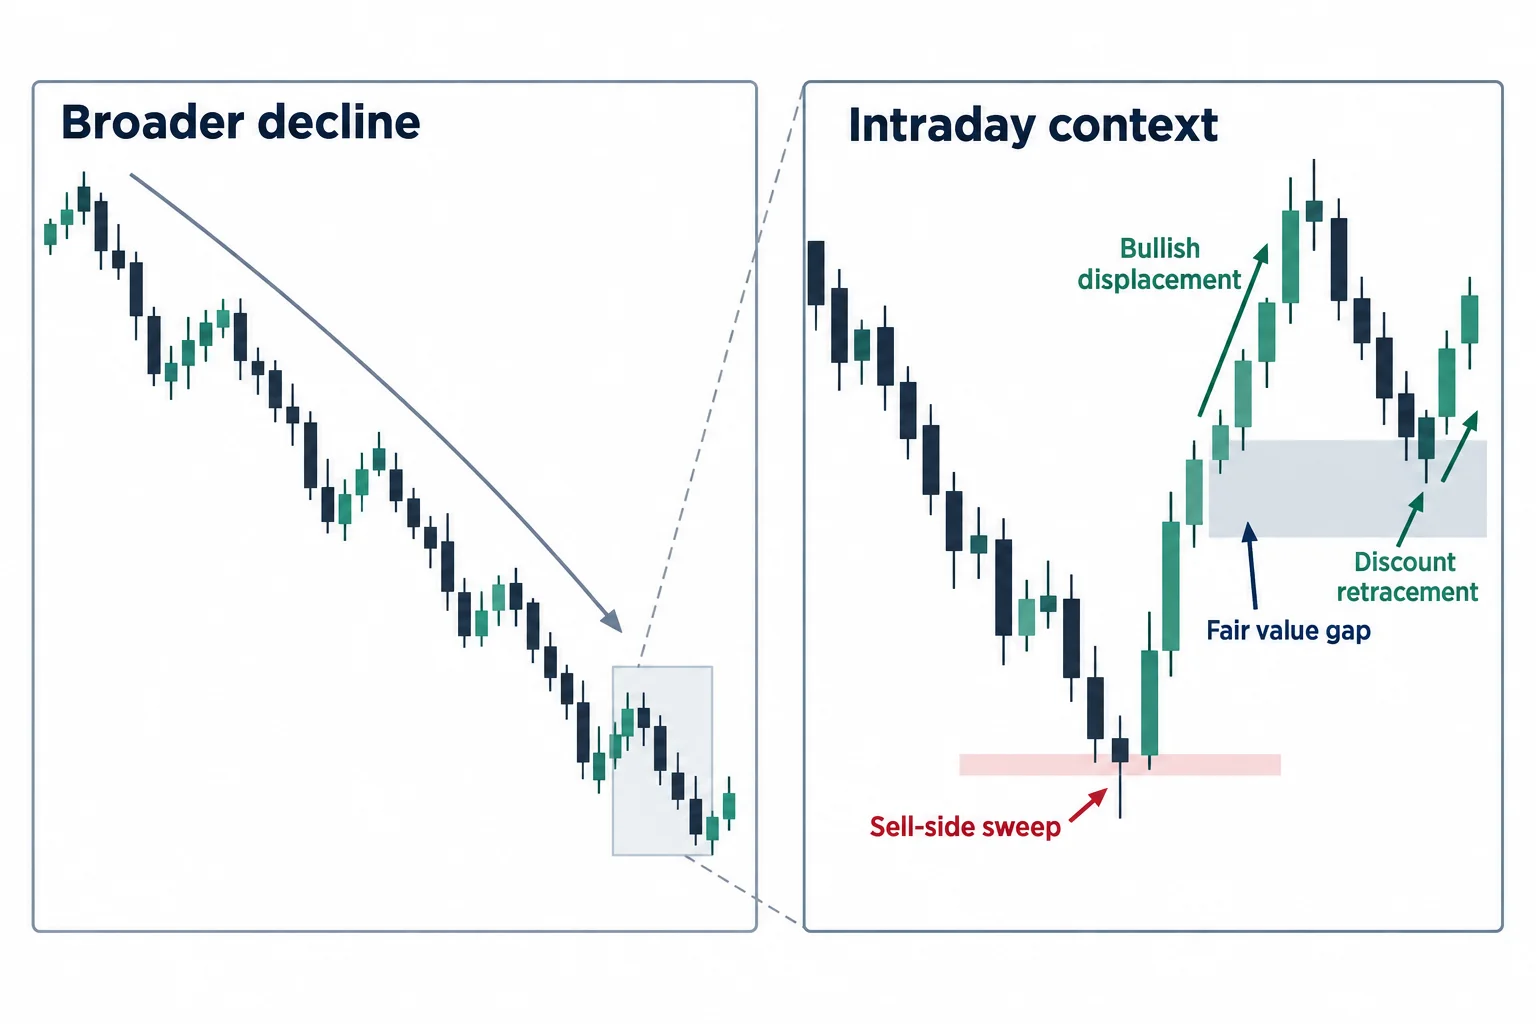
The central lesson is summarized near 12:48. ICT combines a bearish higher-timeframe backdrop with an intraday bullish narrative. In his interpretation, the morning sell-side sweep, discount retracement, fair value gap, and bullish displacement created a framework for a temporary move against the broader decline.
This is not simply an instruction to buy whenever a market has fallen. The setup shown in the lecture depends on several contextual conditions:
- A defined liquidity objective above price
- Earlier removal of sell-side liquidity
- An intraday range that permits an objective premium/discount assessment
- A retracement into a marked area below equilibrium
- Lower-timeframe displacement consistent with the intended direction
ICT contrasts this discretionary counter-trend approach with trading in the direction of the early-session move, referring students back to principles associated with the 8:30–9:30 a.m. window. His larger point is that a fair value gap should not be used in isolation; it is interpreted through directional bias and session context.
ICT Mentorship Counter Trend Chart Review and Journaling
From approximately 14:14, the episode shifts from the setup to study habits. ICT recommends reviewing historical sessions, marking liquidity, ranges, imbalances, displacement, anticipated entries, and possible scaling points. He describes both replay-based review and hindsight annotation as forms of backtesting.
ICT also encourages students to write a first-person narrative explaining what they would have expected at each stage. He claims repeated annotation can make patterns easier to recognize later. That psychological explanation is ICT’s interpretation and is not tested or established by the video. A more conservative educational use is to treat the journal as a structured record: document the hypothesis, define what would invalidate it, and compare it with what the chart subsequently displayed without rewriting the original expectation.
The episode closes with large simulated-account performance claims. ICT repeatedly identifies the account as paper trading and warns that his demo results do not mean another person can reproduce them in a live account. Accordingly, those figures should not be treated as evidence of profitability or as a performance expectation.




