
How we researched this article
BestProps used document-based research from primary firm sources, checked September 25, 2026. The complete source list, scope, limitations, and commercial-state record appear near the end of this article.
What ICT demonstrates in Episode 14
In 2022 ICT Mentorship Episode 14, ICT gives a short execution walkthrough using Micro E-mini Nasdaq-100 futures. The lesson focuses less on profit-and-loss figures and more on how he interprets market structure, a fair value gap, nearby highs and potential exit levels while managing an open position.
This is a compact example rather than a complete treatment of the model. The captions describe ICT’s reasoning, but they do not provide a fully readable chart, independently verified fills or the later course of the market.
The setup described in the video
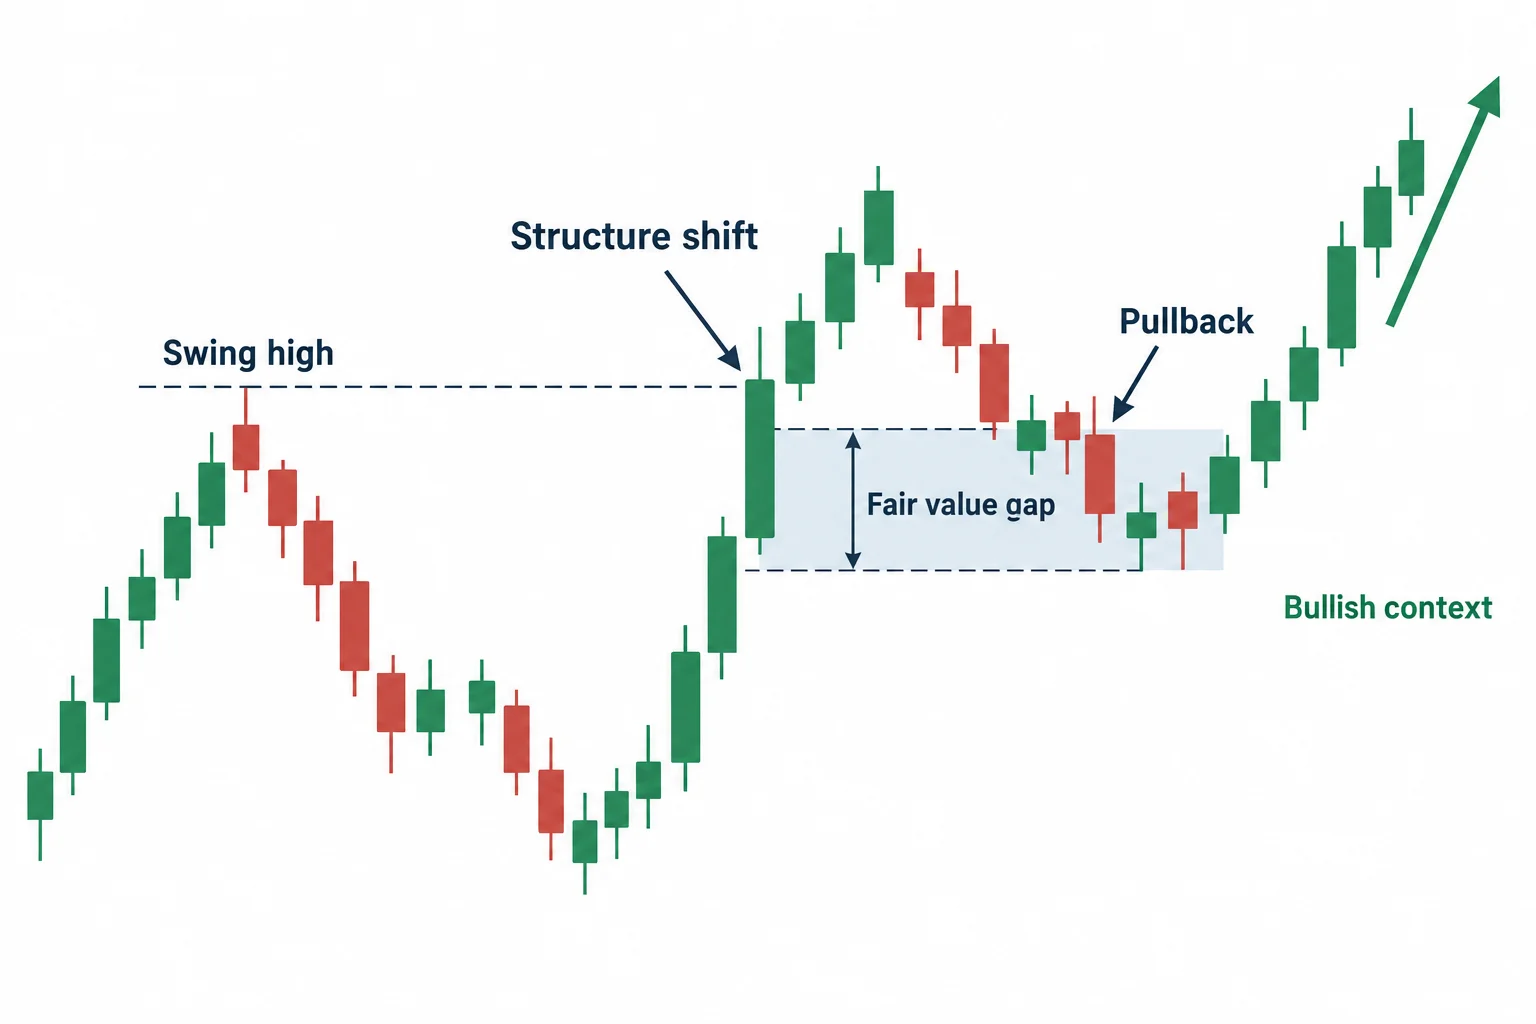
At 0:08, ICT says that he has identified a market structure shift to the upside and is looking for a fill of a gap associated with Friday’s close. He then describes entering long with 12 Micro Nasdaq futures contracts.
His stated expectation is that price will move down into what he calls a fair value gap before expanding higher. In ICT’s terminology, a fair value gap is an imbalance represented by a three-candle price sequence. Here, it serves as the area in which he wants to execute after forming a bullish directional view; it is not presented as a stand-alone signal.
ICT also identifies several upside reference points. The transcript mentions a run above 14,160, an initial area near 14,180 and a possible objective around 14,220. These numbers belong to the session shown in the recording and should not be treated as current market levels.
Watching price rather than the P&L display
After the entry, ICT says the fair value gap has been closed and turns his attention to the candles. At 1:01, he explicitly says he is not watching the profit number. Instead, he watches whether price continues toward another small fair value gap, which the generated captions place approximately between 14,122 and 14,138.
He anticipates that price could consolidate in that region and then reaccumulate for another move higher. To communicate the expected shape, he compares the possible pause to a bull flag. This is ICT’s real-time interpretation of the displayed price action, not proof that such a pattern will reliably resolve upward.
Using liquidity and nearby markets as context
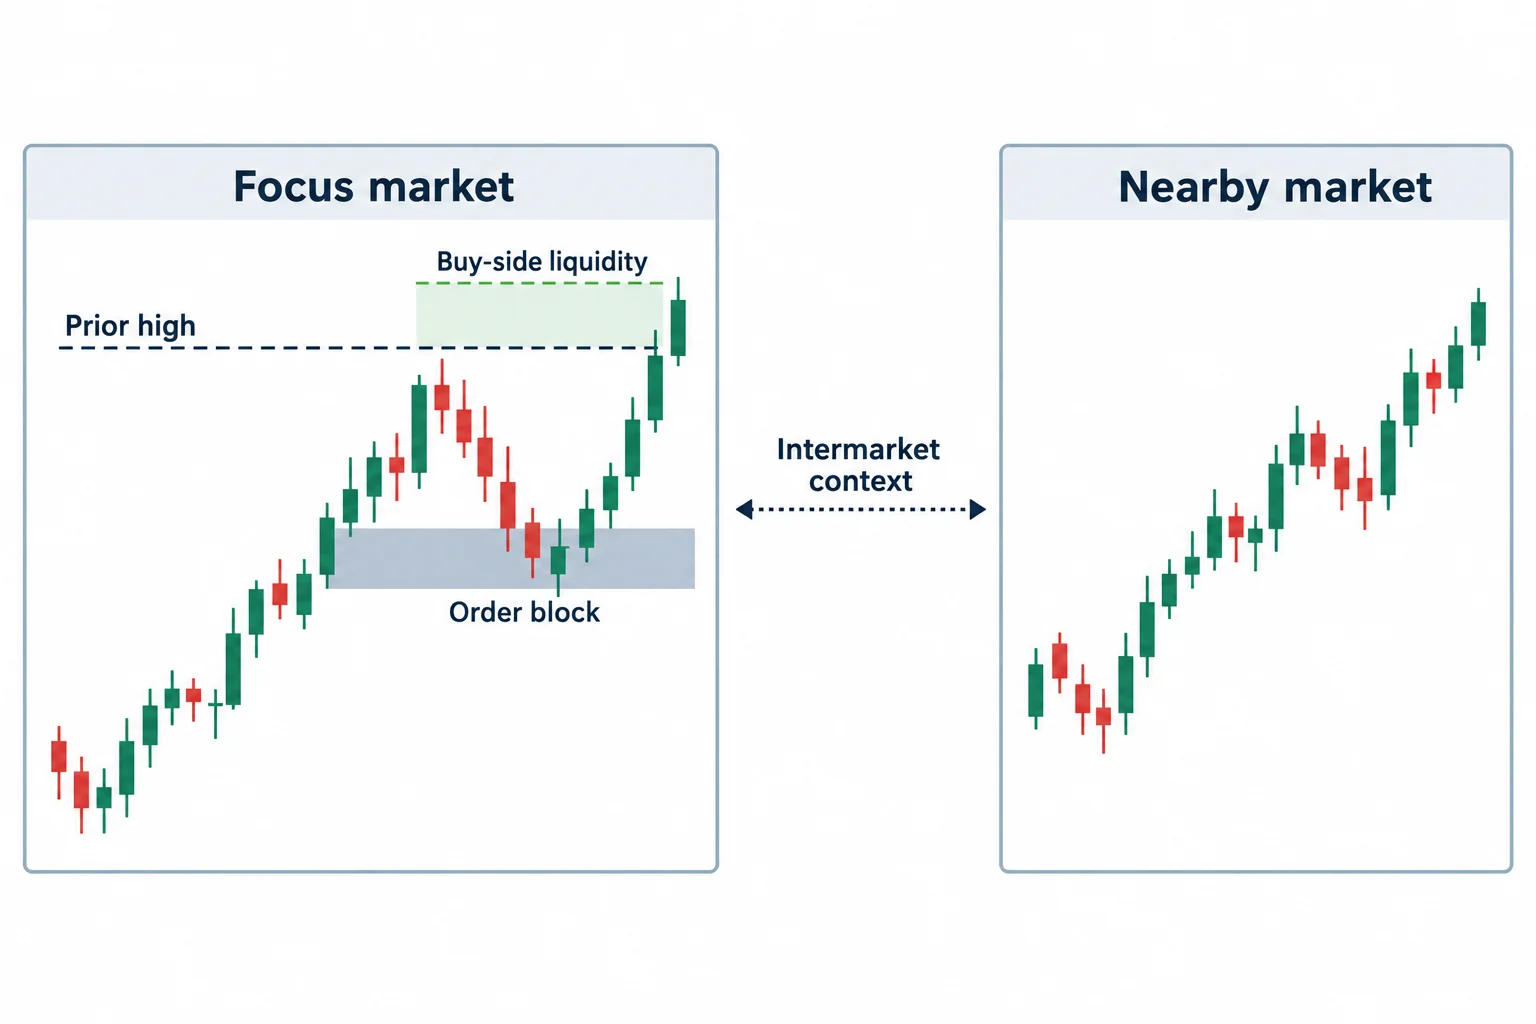
At 2:20, ICT describes “buy-side” around 14,160 as being in his crosshairs. In the context of his teaching, this refers to liquidity he expects may rest above a prior high. He contrasts that view with a conventional resistance interpretation, arguing that some traders might sell because price previously declined from the area while he expects price to break through it.
This contrast is part of ICT’s market interpretation. The transcript does not establish that either framework has a generally proven advantage.
Later, at 3:26, ICT says price is reaching into an order block. He also checks the Micro E-mini S&P market for context and says its apparent strength gives him more confidence in the Nasdaq scenario. This illustrates an intermarket confirmation process: he is not treating the Nasdaq chart in isolation, but looking for broadly compatible movement in another equity-index futures market.
The position-management plan
ICT outlines a staged management approach rather than relying on a single all-or-nothing target:
- He begins with 12 micro contracts.
- He considers taking six contracts off above the nearby high.
- He says that partial exit would “fund the position.”
- His plan is then to move the stop to breakeven.
- He considers leaving the remainder for the higher objective near 14,220.
At 3:02, he explains this partial-exit and breakeven plan. It shows how the model combines an entry narrative with predefined management decisions. It also demonstrates that his plan is conditional: he says he will watch how price trades above a short-term high rather than assuming the furthest objective must be reached.
Changing the decision as price develops
Near the end, ICT revises his plan. At 3:49, he says he is changing his mind and closing because price is getting close to filling the gap. He still comments that 14,220 appears possible “for general principles,” distinguishing a broader forecast from his immediate decision to reduce or close exposure.
The final captions refer to a limit order being filled and show the entry and an exit marker at 4:07. Because the chart and order interface cannot be reconstructed from captions alone—and the wording around the final orders is somewhat ambiguous—it is safest to treat this as a demonstration of execution and discretionary management rather than calculate a trade result.
General educational takeaway
The central lesson is the sequence of decisions: establish directional context, wait for price to revisit a defined area, monitor the reaction, identify nearby liquidity, plan a partial exit and remain willing to change the target. ICT also emphasizes observing price behavior instead of fixating on the fluctuating P&L display.
This episode documents ICT’s own terminology and interpretation of one setup. It does not by itself test the model, establish expected profitability or provide enough information to reproduce the trade. Futures trading involves risk, and the video should be studied as educational commentary rather than investment advice or a performance promise.





