
Key takeaways
2022 ICT Mentorship Episode 10 presents a top-down Nasdaq trading framework that starts with Forex Factory event timing, especially 8.30 a.m.
Read the full summary
2022 ICT Mentorship Episode 10 presents a top-down Nasdaq trading framework that starts with Forex Factory event timing, especially 8.30 a.m. U.S. releases, then combines higher-time-frame daily bias, the daily and midnight New York opens, liquidity, fair value gaps and Power of Three. A selected dealing range is split at 50%, with premium above and discount below. Bearish bias expects an open, rally above the open and downward expansion, while bullish bias expects the inverse. Power of Three consists of accumulation near the opening range, manipulation opposite the expected direction and distribution through the daily range. For bearish setups, ICT measures the open-to-session-high distance and projects it below the open to define a potential entry zone. Intraday confirmation requires a swing high to be exceeded, a swing low to break with force and a retracement into an imbalance. ICT prefers the 15-minute chart for context, then checks the 5-, 4-, 3-, 2- and 1-minute charts for a fair value gap, with no gap meaning no trade. The lesson uses simulated trading, warns that low intraday margin can encourage excessive leverage, highlights Nasdaq volatility, slippage and worse-than-expected stop fills, and recommends defining bias and setup boundaries before the session, avoiding late entries and reviewing annotated historical charts weekly. The transcript does not independently verify the chart formations or demonstrate a repeatable edge, and ICT acknowledges invalid setups, losing trades and uncertain outcomes.
How we researched this article
BestProps used document-based research from primary firm sources, checked September 25, 2026. The complete source list, scope, limitations, and commercial-state record appear near the end of this article.
What ICT Teaches in Mentorship Episode 10
2022 ICT Mentorship Episode 10, uploaded on February 18, 2022, connects scheduled economic events with ICT’s interpretation of the daily open, directional bias and the “Power of Three.” The lesson uses a Nasdaq chart and a February 17 economic calendar as its principal examples.
The central idea is that traders should not examine intraday price action without first checking when potentially market-moving reports or speeches are scheduled. ICT then places those times inside a broader framework: establish a higher-time-frame directional thesis, observe how price behaves relative to the daily opening price and look for lower-time-frame patterns that agree with that thesis.
2022 ICT Episode 10 Economic Event Calendar
At 0:11, ICT introduces the lesson as an explanation of how to combine economic-calendar events with the open. He says he checks the calendar before a trading session because a scheduled release can produce an abrupt increase in volatility.
He uses Forex Factory in the demonstration but explicitly notes that it is a personal preference rather than the only available calendar. The practical point is to know the day’s event schedule and impact classifications. In the session under review, ICT highlights 8:30 a.m. as a common release time for U.S. economic data. His interpretation is that price can move ahead of a release and then accelerate or reverse when the data becomes public.
This is a framework for organizing observations, not proof that news mechanically determines direction. The transcript also does not provide enough information to verify the charts visually or test how often the described behavior occurs.
ICT Episode 10 Daily Bias and Liquidity
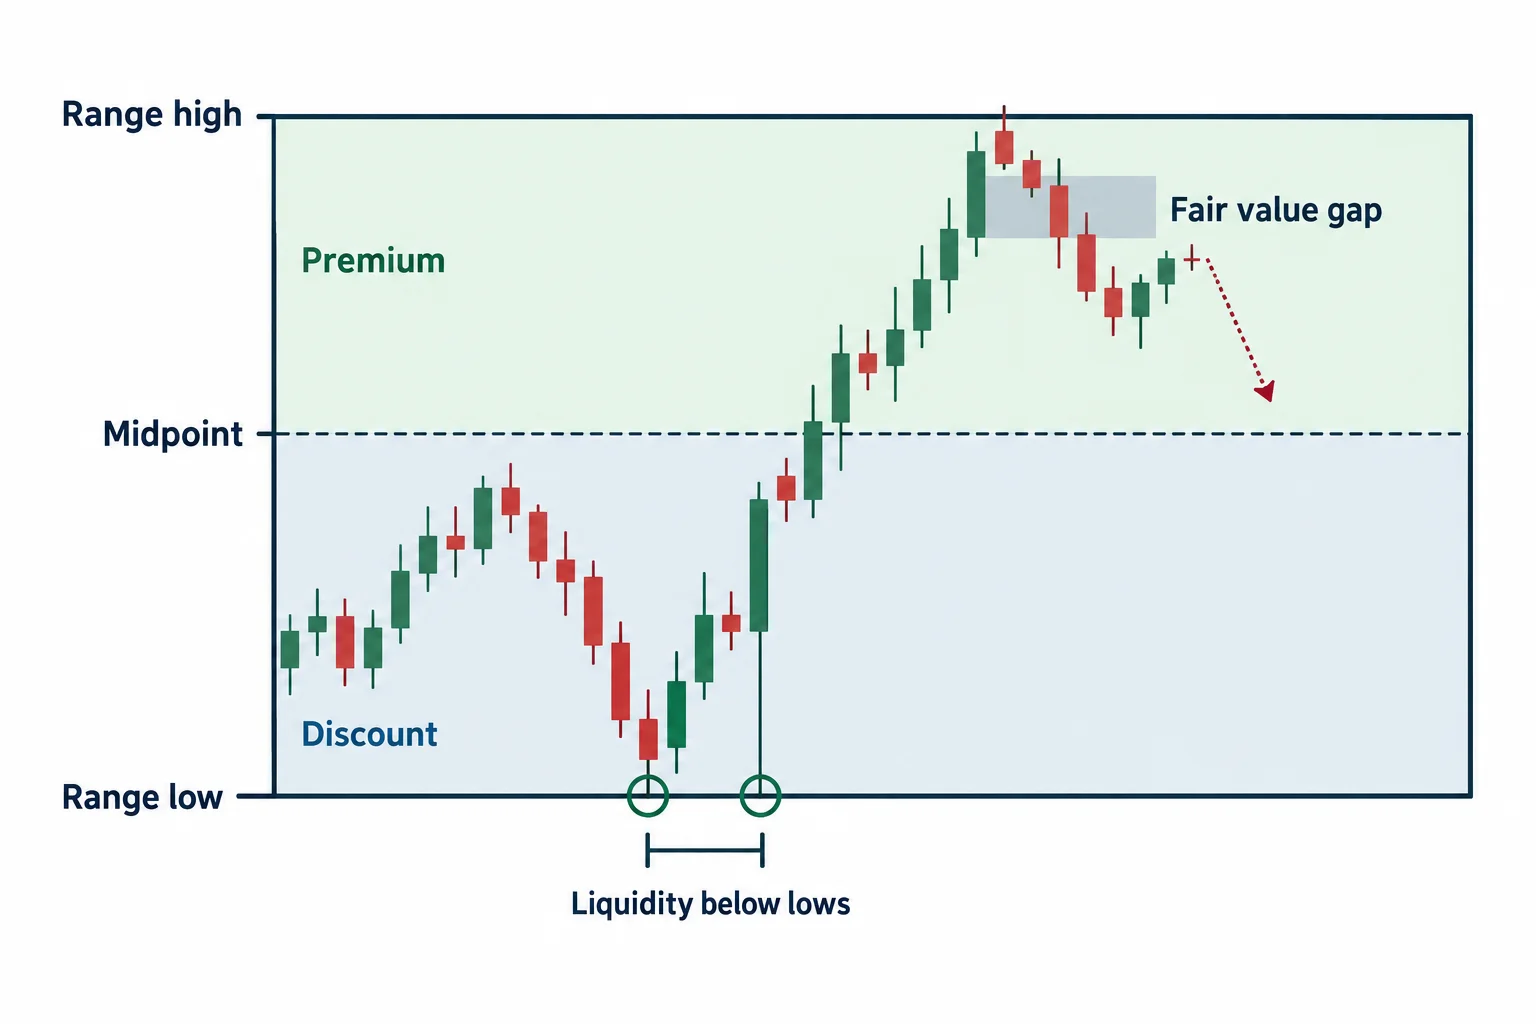
Beginning around 2:32, ICT moves to a Nasdaq daily chart. He divides a selected dealing range at its midpoint: above 50% is termed “premium,” while below 50% is termed “discount.” He combines that location with what he calls fair value gaps, swing points and pools of liquidity above highs or below lows.
In the example, ICT maintains a bearish interpretation after price retraces into an imbalance near the upper portion of the selected range. He treats lows beneath the market as possible objectives. This illustrates an important feature of his method: the presence of a bullish-looking lower-time-frame pattern is not enough by itself. For ICT, a setup is considered within the prevailing higher-time-frame narrative.
At 7:57, he simplifies daily bias into a question about expansion from the open. Under a bearish thesis, the anticipated daily sequence is an open, a rally and then downward expansion. Under a bullish thesis, the sequence is reversed: price trades beneath or near the open before expanding upward. ICT acknowledges that individual candles can contradict the larger move and that losing trades remain possible.
ICT Episode 10 Power of Three
ICT defines Power of Three at 12:48 as:
- Accumulation: positioning around the opening portion of the range.
- Manipulation: an initial move that appears to point in the opposite direction from the anticipated expansion.
- Distribution: the subsequent directional movement through the daily range.
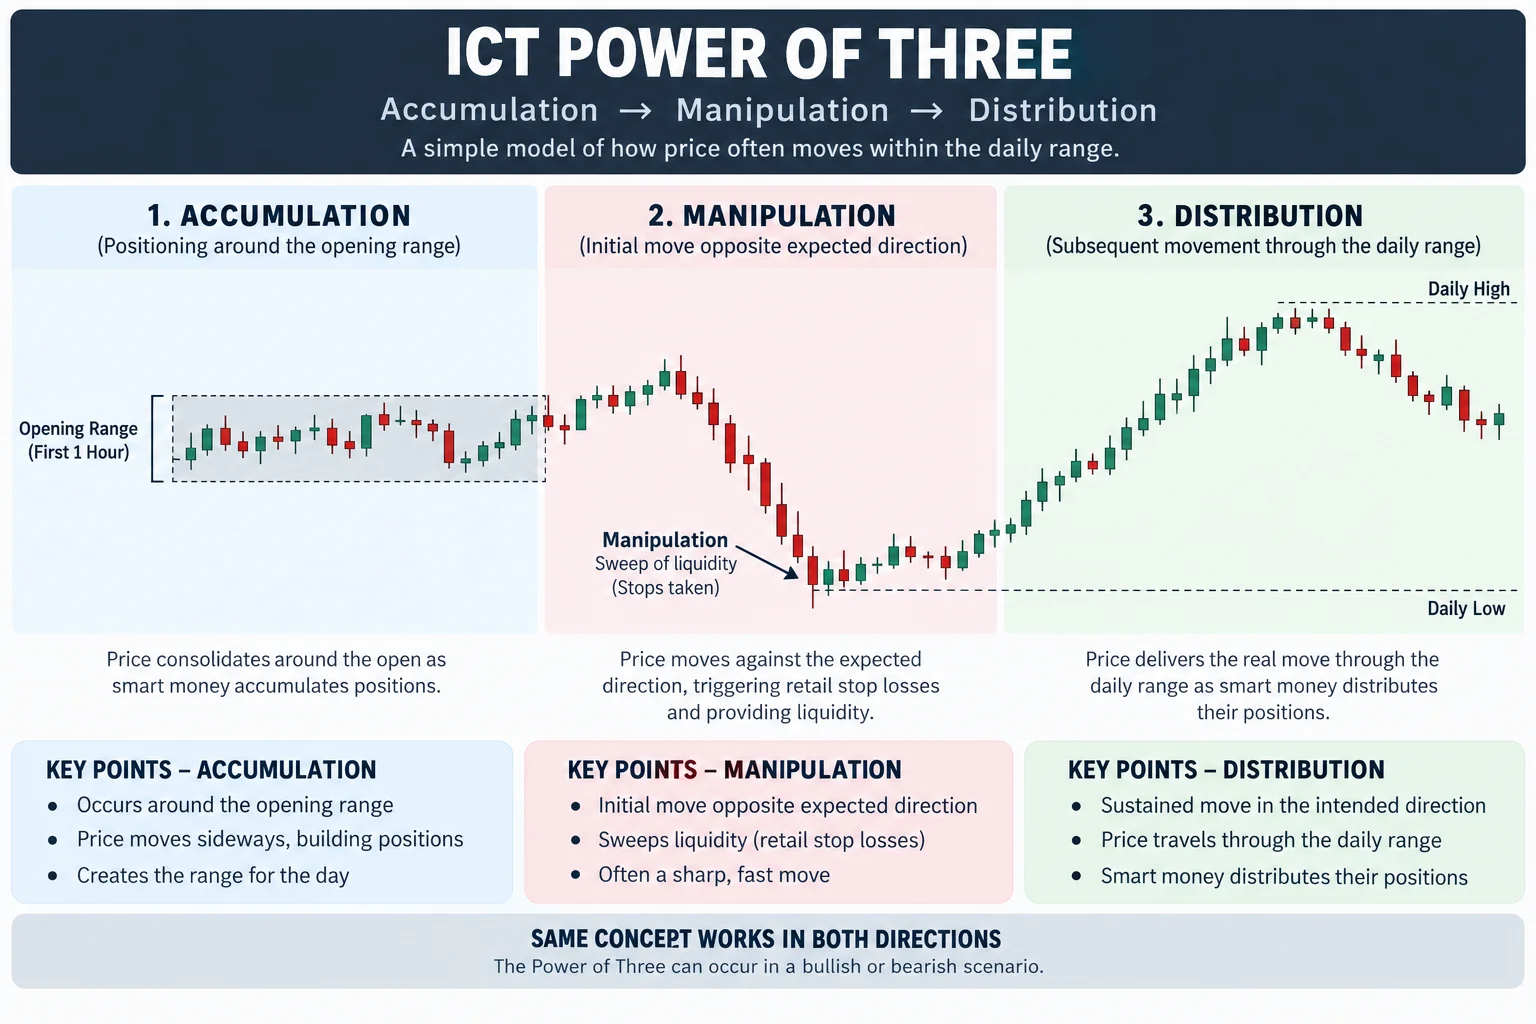
For a bearish day, ICT describes the move above the opening price as the area where short opportunities may develop, followed by a decline toward the day’s lower range. For a bullish day, he presents the inverse model. He stresses that a student does not need to predict the exact closing price; the more basic task is deciding whether expansion above or below the open appears more likely.
He also introduces an “opening range” construction. In the bearish example, he measures the distance from the open to the session high and projects that distance below the open. ICT says this gives him a zone in which a later short entry may still be considered without chasing a move that has already extended too far.
ICT Episode 10 Daily Bias for Intraday Setups
At 29:09, the lesson shifts to the morning session. ICT combines a bearish daily interpretation, the midnight New York open and a rally ahead of an 8:30 release. He interprets the advance above the open as the manipulation phase of a bearish Power of Three sequence.
The lower-time-frame process includes identifying a swing high that is exceeded, a subsequent swing low that is broken with force and a retracement into an imbalance. At 37:33, he describes stepping down from the five-minute chart through the four-, three-, two- and one-minute charts until a fair value gap is found. If none appears, his rule is that there is no trade under that setup.
ICT calls the 15-minute chart his preferred overview for intraday trading, while the smaller intervals are used to refine a prospective setup. Because the source is an audio transcript without chart verification, the precise boundaries, fills and visual formations discussed in this section cannot be independently confirmed from the transcript alone.
ICT Episode 10 Risk and Practice Lessons
The latter part of the video includes a paper-trading account demonstration. ICT clearly labels it simulated and warns against treating low intraday margin as permission to use excessive leverage. He discusses sudden Nasdaq moves, slippage and the possibility that a stop order may execute at a worse price than expected. The unusually large simulated return he displays is not evidence of expected live performance and should not be generalized.
At 59:55, ICT returns to process and discipline: define the directional thesis before the session, identify the permitted setup area and do not chase price after it leaves that area. He closes with a journaling exercise at 1:01:59, recommending that students annotate historical charts with what they would have expected and review those notes each week.
2022 ICT Mentorship Episode 10 Takeaways
Episode 10 is best understood as a top-down decision framework. The calendar identifies periods of event risk; the daily chart supplies ICT’s directional narrative; the opening price organizes the expected daily range; and lower-time-frame displacement and imbalances provide possible execution criteria. ICT repeatedly concedes that the interpretation can be wrong and that some sessions will not produce a valid setup. These concepts are educational market interpretations, not a demonstrated trading edge or a promise of profitability.




