Key takeaways
In this September 30, 2025 review, ICT works through the US Dollar Index, EUR/USD and GBP/USD before turning to the December E-mini Nasdaq futures contract, where he gives the first public description of a structure he calls a suspension block: one candle with a volume imbalance at its upper end and another at its lower…
Read the full summary
In this September 30, 2025 review, ICT works through the US Dollar Index, EUR/USD and GBP/USD before turning to the December E-mini Nasdaq futures contract, where he gives the first public description of a structure he calls a suspension block: one candle with a volume imbalance at its upper end and another at its lower end, which he says behaves much like a fair value gap even when earlier wicks already crossed the same area. He frames the block as bullish or bearish depending on candle direction, narrative and order flow, says its character can change after a reversal, and closes by calling the session unusually difficult to read, with the practical point being to recognise when not to risk money. The levels he reads out and the trade he says he shared on X are his own account, not verified fills or results.
How we researched this article
BestProps used document-based research from primary firm sources, checked September 14, 2026. The complete source list, scope, limitations, and commercial-state record appear near the end of this article.
In ICT Suspension Block & Review September 30, 2025, ICT reviews the US Dollar Index, EUR/USD, GBP/USD and the December E-mini Nasdaq futures contract. The central teaching is his first public description of what he calls a suspension block. He presents it as a price-delivery structure bounded by volume imbalances and says he reads it much like a fair value gap, even when overlapping wicks mean it would not satisfy his classic fair value gap definition.
The recording is also a case study in difficult conditions. ICT repeatedly characterises the session as irregular, resistant to clean analysis and better suited to caution than aggressive participation. Those are his interpretations of the charts he displayed, not independently tested evidence of a trading edge.
This review works from a timestamped automatic transcript of the recording’s full original audio, produced locally from the video’s audio track rather than from the channel’s own captions. Specialised terms and spoken numbers therefore carry transcription risk, and the chart annotations the speaker refers to were not available for independent visual inspection. The timestamp links below point to the moments being described.
Forex review: dollar sensitivity and uneven price action
The review begins with the Dollar Index. At 0:43, ICT identifies the September 22 daily open and a daily bullish order block. He says the index traded down into an older imbalance and the order-block level, where he expected possible sensitivity. In his framework, a reaction in the dollar could place downward pressure on EUR/USD and GBP/USD, although he explicitly allows for either a reaction or continued consolidation.
ICT then walks through lower-timeframe fair value gaps, an inversion fair value gap, relative equal lows and candle-body behaviour. His emphasis is that the bodies remain inside what he calls a PD array rather than simply reacting to a conventional horizontal support or resistance level.
Beginning at 3:59, he answers a viewer question about why the dollar index looks unruly by pointing to geopolitical tension, and he contrasts the dollar’s range-bound behaviour with strength in gold. This is discretionary market commentary: the transcript cannot establish manipulation, causation, or a stable inverse relationship between the two markets.
EUR/USD and GBP/USD
In the EUR/USD section at 6:21, ICT tracks price through several structures that he labels fair value gaps, inversion fair value gaps, a daily wick quadrant and a reclaimed bullish fair value gap. The review focuses on how a previously bearish or violated area may be reclassified when price returns through it and subsequently reacts from the other side.
His GBP/USD assessment is much less constructive. At 8:29, he calls the pair a “mess” trapped between two older wick-derived levels. Although he notes liquidity runs around relative equal highs and lows and an inversion fair value gap, he does not present the session as a clean setup.
What ICT calls a suspension block
The Nasdaq discussion starts at 9:33. ICT first places the December E-mini Nasdaq contract within what he regards as a larger bullish market and identifies levels derived from daily premium wicks, wick quadrants and consequent encroachment.
He calls the segment his first public mention of the idea at 10:42 and names it at 10:53. Based on his spoken explanation, its key features are:
- A single candle sits between what ICT describes as a volume imbalance at its upper boundary and another at its lower boundary.
- The structure need not qualify as a classic fair value gap.
- Earlier wicks may overlap or pass through the same area without invalidating the structure under his definition.
- He projects the area forward and watches its boundaries, midpoint or “consequent encroachment”, and quadrants for subsequent reactions.
- He says the concept can be bullish or bearish depending on candle direction, narrative and order flow.
ICT explains the name by saying the candle is “suspended” between the two imbalances (11:40). At 12:52 he marks two examples of different size, and from 13:11 he reiterates that prior back-and-forth delivery or overlapping wicks do not, in his view, remove the remaining inefficiency. He describes the Nasdaq levels around 24,819.25 with 24,857 and 24,863 as further references he watched above it. Those numbers are read from automatic transcription of the audio and should be checked against the recording before being reused.
Change of character after a reversal
A further point appears at 14:46. ICT says a suspension block can change character after a reversal, functioning in a way he compares with an inversion fair value gap. He then reviews candle bodies and reactions around the block’s low, high, quadrants and midpoint.
He also says the trade in that sequence was recorded and that the full presentation at regular speed, including where he placed the stop and how he managed it, was posted on his X account rather than on YouTube. Nothing in the transcript verifies an entry, an exit, a fill or a result.
This section should be read as an explanation of ICT’s chart taxonomy. Because the source is an automatically transcribed audio track without verified chart images, it does not independently show whether every marked candle meets the verbal definition.
The larger lesson: recognising when not to trade
The final portion is less about finding a setup and more about identifying poor conditions. At 18:15, ICT says a first-presented fair value gap showed little consistent influence. He links that behaviour, along with simultaneous overnight declines in the dollar, gold and Nasdaq, to what he calls “high resistance liquidity run conditions”.

He describes the day as difficult to read, with repeated movement through reference areas instead of clean directional delivery. His practical conclusion arrives at 21:22: struggling in such a session is not necessarily evidence of poor execution, because the price action itself was unusually difficult within his framework. He closes by emphasising that a trader’s most valuable skill may be recognising when not to risk money.
Educationally, the video offers two connected ideas: a label for a candle bounded by upper and lower volume imbalances, and a reminder that analytical structures do not require participation in every session. Neither the pattern nor the surrounding commentary should be treated as a promise of predictive accuracy or profitability.
How to study a suspension block
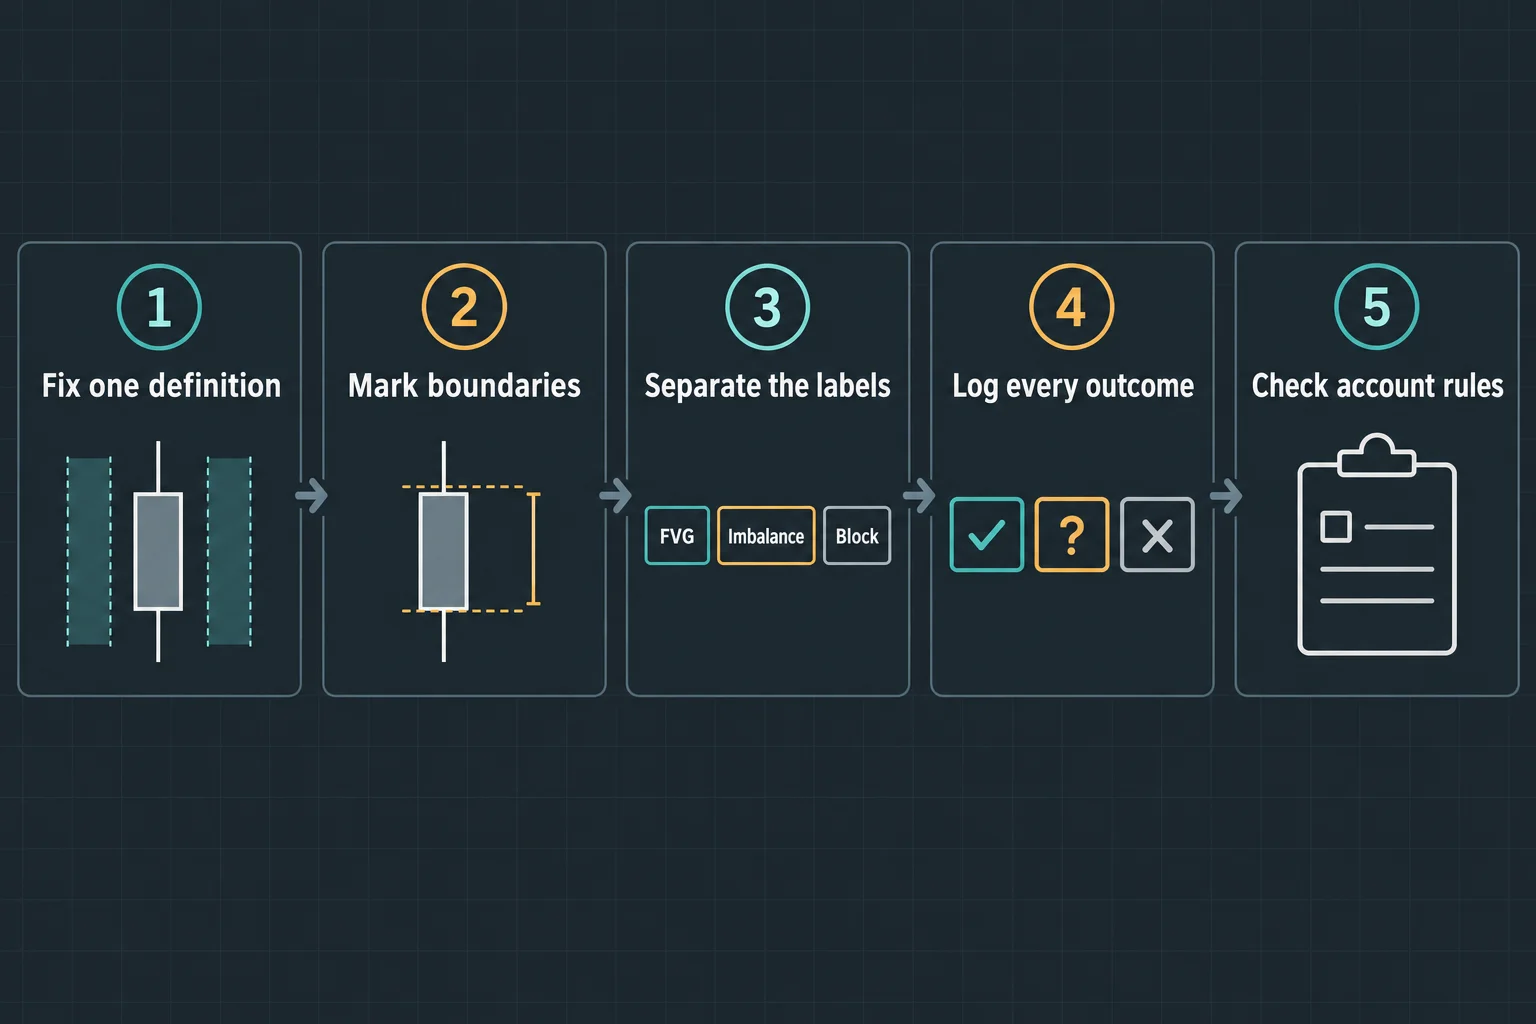
Because the concept is described verbally over annotated charts, the only way to build a usable sample is to fix one interpretation first and apply it the same way every time:
- Write the definition down before looking at outcomes: one candle with a volume imbalance at its upper end and another at its lower end, as the recording describes it.
- Mark the boundaries the same way in every case, and record whether they are the candle body or a wider interval.
- Keep the labels apart. Fair value gap, volume imbalance, inversion and suspension block are separate objects in the speaker’s vocabulary.
- Log outcomes in three groups: structure met with a reaction, structure met without a reaction, and structure not met.
- Check the account rules that apply to you before sizing anything. Nothing in this recording establishes a statistical edge.
Watch the original lesson
This article draws on the timestamped transcript of ICT Suspension Block & Review September 30, 2025. A transcript is evidence of what the speaker said, not independent proof of the levels he described, the trade he says he took, or any later outcome. The recording’s own chart annotations remain the primary reference when following the explanation.
Watch the original lesson on YouTube
The video cannot be played inside another website: when its embedded player was loaded from a BestProps page on 14 September 2026, the player surface returned “Video player configuration error” carrying error code 153 and offered a “Watch video on YouTube” prompt, with no duration and no playback progress reported. That surface does not identify which setting produces the error, so no cause is asserted here; the recording itself is available directly on YouTube.
Watch ICT Suspension Block & Review September 30, 2025 on YouTube ↗
Primary source and further reading
- The original Inner Circle Trader recording: the source for every timestamp link in this article.
- The presenter’s announcement post on X, September 30, 2025: a first-party post carrying this title and a link whose video identifier matches the recording.
- YouTube Help: Restrict embedding: platform documentation of the owner-side control that can block embedding on any website; the embedded player returned a configuration error rather than identifying which setting produces it, so the watch card above replaces a player without asserting a cause.
- TradingView: ICT Suspension Blocks by flasi: an unofficial third-party open-source script that automates one author’s interpretation of the label. It is not affiliated with the presenter or with BestProps and it was not installed, tested or compared against this recording.
BestProps is not affiliated with The Inner Circle Trader, YouTube or TradingView, and no source listed here endorses this article, this site or any setup. Suspension block, volume imbalance, fair value gap, inversion fair value gap, order block, PD array, liquidity, premium, discount and consequent encroachment are used on this page only as descriptive study terms, in the sense the speaker uses them in the recording. No entry, stop, target, size or result is presented here as verified fact, and no statistical reliability is claimed for the formation. This is independent educational commentary, not investment advice.