Key takeaways
ICT Price Action Chronicles – The Science Of Anticipation In Price Action is a roughly 51-minute Inner Circle Trader recording in which the speaker narrates a live intraday session rather than market replay.
Read the full summary
ICT Price Action Chronicles – The Science Of Anticipation In Price Action is a roughly 51-minute Inner Circle Trader recording in which the speaker narrates a live intraday session rather than market replay. He first marks daily-chart reference points — a volume imbalance into the previous day’s low, an old high and what he calls a daily inversion fair value gap — then drops to a one-minute chart inside the premarket window he says he teaches students to focus on, roughly 7:00 to 9:00 a.m. New York time. His stated entry is the midpoint he calls the consequent encroachment of a small premarket gap he labels a suspension block, with a protective stop just beneath the level he is trading from and a first objective at relative equal highs above. The recording is more useful as a method than as a signal: state a directional premise, define what price must do for it to remain valid, name the footholds that would confirm it, and decide management in advance. It also contains a candid execution error — he had not set his stop when he first described the trade — a long digression arguing that non-farm payroll data is widely misinterpreted, and an extended case for honouring a stop that has been moved rather than widening it. The captions read for this article are automatic speech recognition, so specialised terms and the price level he reads off his own chart are reported as spoken, not independently verified.
How we researched this article
BestProps used document-based research from primary firm sources, checked September 14, 2026. The complete source list, scope, limitations, and commercial-state record appear near the end of this article.
ICT Price Action Chronicles: The Science of Anticipation in Price Action is a lesson published on The Inner Circle Trader’s YouTube channel. Unlike an earlier version of this page, this article is written from the recording’s own timestamped captions, which were read in full, together with the watch page’s metadata. Everything here describes what the speaker says in that session or what a cited external document states; it is not a claim that the framework predicts markets.
Three limits belong up front. First, the captions are automatic speech recognition, not a human transcript, so specialised vocabulary such as “suspension block” and “consequent encroachment” and any number read off a chart should be treated as reported rather than confirmed. Second, the captions never name the instrument being traded; the speaker refers to index-style levels, and identifying the contract is not something the transcript establishes. Third, several of his statements — about algorithms, about liquidity, about how much probability a daily level confers — are his interpretations of price action, presented here as attributed views and not as verified market mechanics.
ICT Price Action Video Summary
The recording runs about 51 minutes and opens on a review of an “enormous rally off of FOMC,” which he calls the move that set up the session he is about to walk through. He reminds viewers of his earlier call that the previous week’s low was in, notes that price has come back softer, and says he does not expect the day to close down but does expect an attempt to continue higher. He frames a pause after a hard rally as normal rather than as a reversal signal.
The teaching order matters. He builds context on the daily chart first — the areas he is monitoring, the levels he wants price to overcome, and the inefficiencies he intends to carry forward — and only then moves down to a one-minute chart. He also stresses that the session is a live feed with executions and not a replay, and returns to that point more than once; the captions support that he said it, though no caption can demonstrate what appeared on his screen.
On dating: the watch page lists a publication date of 2026-08-06 and was public rather than unlisted when read on 2026-09-13. The recording’s own references — an FOMC event the week before, and non-farm payroll ahead with “today and tomorrow” to go — are consistent with a session recorded in the first week of a month, but the transcript does not pin an exact calendar date, so none is asserted here.
ICT Price Action After the FOMC Rally
The daily review begins with a volume imbalance running up to the prior day’s low, which he treats as one edge of a daily range of inefficiency. He then points out an area with no volume imbalance, and works left across the chart to what he calls the inversion of a fair value gap, sitting at an old high. A wick further left becomes the specific level he says he wants to see price overcome before he would trust continuation.
Two distinctions are worth keeping. The fact that a rally followed an FOMC event does not establish that the event caused the sequence, and a scheduled announcement is a known date rather than a direction. The Federal Reserve’s own meeting page is the place to confirm when a decision was actually released; it says nothing about how price will respond.
He also gives a session-timing preference he says is aimed at beginners: in non-farm-payroll weeks he considers Monday, Tuesday and Wednesday up to around 11:00 a.m. the cleanest conditions, and he repeats several times that low experience is not something to hide. That is a personal guideline, not a tested statistic, and the recording offers no sample to support it.
ICT Price Action Long Setup
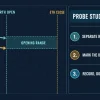
The execution portion starts in the premarket window he identifies as the 7 o’clock period the session had just entered, and which he later restates as the 7:00 to 9:00 a.m. New York window he teaches students to focus on. After dropping to a one-minute chart he identifies a small gap that he calls a suspension block and says he will go long into it.
His stated entry is precise in his own terms: he enters at the consequent encroachment of that gap, after price has hit the daily inversion fair value gap, and he argues the combination of a daily area, a fast decline into it and a lower-timeframe inefficiency is what makes a reaction reasonable to expect. The upside references are the relative equal highs above price, and the wick on the daily chart acts as the threshold the move has to clear.
What follows is a sequence of conditional checks rather than one forecast. He wants price to show willingness to hold above the midpoint of the decline, with candle bodies laid above it. He describes placing a limit order to take a single contract off above a short-term high, and rolling the protective stop up beneath successive lows as the move develops — at one point saying he will move it far enough to cover commission costs. Those are his narrated intentions and his account of events; the captions cannot confirm the orders, the fills or the platform state behind them.
He also pauses at a price level he reads as 29,390.75, noting that the open of those candles and the low of one candle were the same number, and uses it to argue that he did not need order-flow or depth-of-market tools for the decision. That reading comes from his own chart, and an index level of this kind is exactly the sort of number an automatic transcript can mishear, so treat it as what he said rather than as a level checked against the exchange’s own data.
Key ICT Price Action Concepts
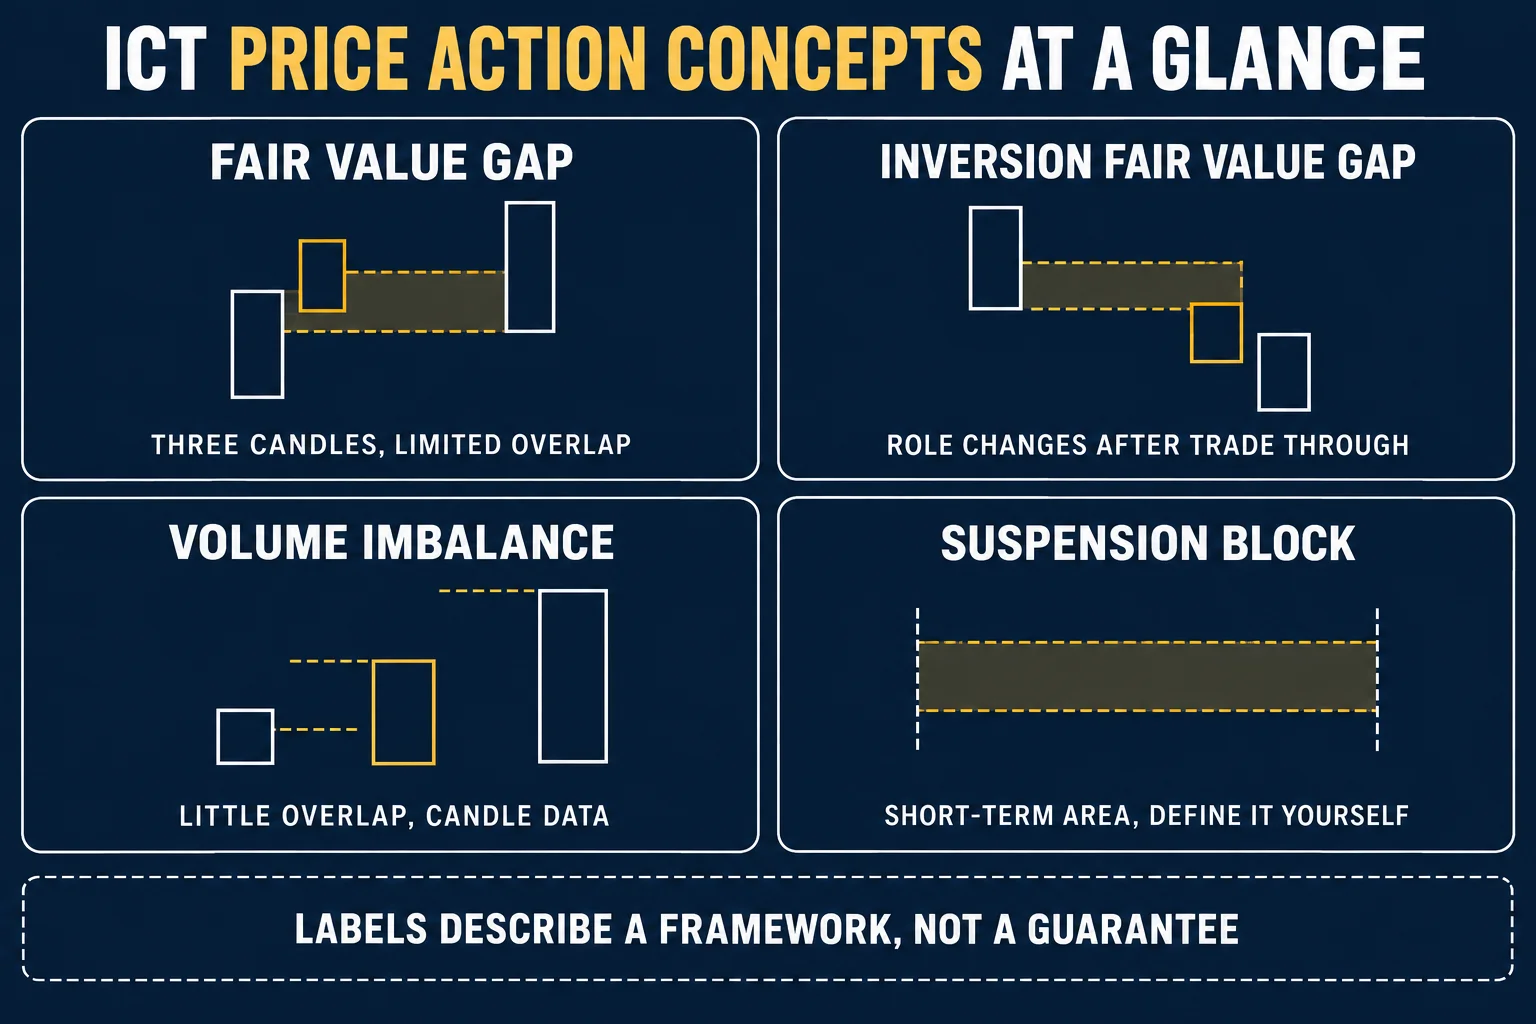
The recording uses a specific vocabulary. The definitions below follow what he actually says in this session, with the limits of each term stated alongside it.
ICT Fair Value Gap
A fair value gap is a three-candle formation in which the middle candle moves quickly enough that the surrounding candles overlap only partially, leaving a narrow band of price with little trading. He works from that band on the daily chart and again on the one-minute chart. Nothing in the recording — and nothing in the framework itself — obliges price to return and fill it, and the label does not describe an objective valuation of the market.
ICT Inversion Fair Value Gap
He refers throughout to a daily inversion fair value gap, meaning a gap that price has already traded through and that he then monitors in the opposite role, so that an area originally read as supply is treated as potential support. He acknowledges that price may close outside such a gap and calls that permissible rather than invalidating. The concept resembles the older chart idea of resistance becoming support; the specific identification rules remain those of the educator applying them.
ICT Volume Imbalance
In this session a volume imbalance is described structurally: a section where the bodies of adjacent candles do not connect or overlap. It is identified from candle bodies on a chart, not from a consolidated view of executed volume, so the name describes price delivery rather than a measured quantity of transactions.
ICT Suspension Block
This is his own term and he defines it narrowly here: when a volume imbalance appears at both the high and the low of an inefficiency, he calls that a suspension block. The gap he enters from in the premarket session is the example he uses. Because the definition is the speaker’s and is stated once, a reader should compare the chart against his explanation rather than treat any short glossary entry as universal.
ICT Consequent Encroachment and Midpoints
He uses consequent encroachment for the midpoint of a gap or a wick, and it is the single level his session depends on most: the entry, the stop placement, and the later test of whether bodies hold above the halfway point all reference it. He argues at one point that he would want price to stay in the upper half of a particular gap, on the reasoning that an unwillingness to trade lower is itself evidence of strength. That is the framework’s logic, not a demonstrated statistical edge.
ICT PD Arrays and Liquidity
PD array is his umbrella label for the price features he treats as reference points. He counts three of them in this setup: an old high, the upper half of a buy-side imbalance, and a wick. Liquidity, in his usage, means chart areas where resting orders are believed to sit — above prior highs or below prior lows — which he says price is drawn toward. Claims about where orders actually rest, or about algorithmic intent, are interpretations of a chart rather than observations from an order book.
ICT Rejection Block
Introduced late in the session, the term describes the highest up-close price within a swing high. He uses it to explain why the move stopped where it did and why he took a partial exit rather than holding for a further target.
One attribution note: he states partway through that a particular idea — using the upper half of a gap formed this way as the strongest source of buying — is his own and not drawn from better-known educators whose material circulates online. This article records that he made the claim; it does not adjudicate the lineage of the idea.
Price Action Anticipation Is Not Prediction
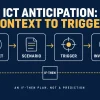
The most portable part of the session is a distinction he makes explicit: he is not asserting where price will go, he is defining what price must do for his premise to survive. He builds it as an if-then clause, and the clearest example is his own wording about a fallback area — if price drops below one level, then he needs it to react from a second; if it does not, the bullish read for the session is finished. Near the close he puts the same idea as a set of questions a trader should answer in advance: when is a move likely, how should it begin, and what continuing evidence would show the move is sustainable.
If price reaches the preselected area, behaves as the plan requires and leaves the invalidation level intact, the setup can be considered. If those conditions are absent, there is no trade under that plan.
He is equally clear about what a key level does and does not buy. At one point he says a daily key level puts probability on your side in the sense that a credible price run becomes more likely — and then says directly that this does not mean the trade will be profitable. He frames the real requirement as movement: without motion in price there is no opportunity to profit at all. His closing line, that there is a technical science behind the approach, is his own characterisation of the method, not a result established anywhere in the recording.
ICT Price Action Risk Controls
The session contains a useful mistake. Well into describing the trade he realises he had not set a stop loss because he was talking, apologises for it, and then places it at the level he is trading from and just beneath it. The order of those sentences is the point: narration and execution compete for attention, and the risk definition came after the entry intention.
His management argument is that once a stop has been moved into profit, widening it again gives away what has already been earned. At the moment he describes pulling a stop back down he calls it giving back all of the unrealized potential gain, and he makes the case that a stop moved to a paying level should be left to do its job. He ties this to composure rather than to chart reading, noting that traders who fiddle with protective orders tend to show it physically.
Partly motivated by a losing stretch earlier in his career, he also recommends taking something off when a trade has moved favourably and anxiety is building, a habit he summarises as “give yourself the cookie”. The mechanical trade-offs are unstated in the recording and worth spelling out: a partial exit reduces exposure and also reduces participation in a larger move, and a stop that is trailed quickly converts ordinary fluctuation into an early exit. Neither is free.
For a funded trader there is a further layer the recording does not cover. Whether a plan like this is even usable depends on daily loss limits, consistency rules, restricted periods and how drawdown is calculated on that account. Those belong to the provider’s current documentation, not to a lesson about anticipation, and they should never be inferred from a chart example.
ICT Price Action Study Checklist
Use this to review the recording or to test a similar process without assuming the setup carries an edge:

- Open the original recording and confirm the instrument, session and timeframes, none of which the captions name.
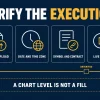
- Read the daily chart before looking at the lower-timeframe result, the way the session itself does.
- Write down the directional premise and the specific evidence behind it.
- Mark each gap, imbalance and liquidity reference he names, including the inversion gap and the wick he wants overcome.
- State the entry condition in your own words, then check it against what he says at the midpoint of the gap.
- Define invalidation in both price terms and account-risk terms.
- Note where the automatic transcript is uncertain, especially around specialised terms and the level read off the chart.
- Log the setups that never triggered, not only the ones that did.
- Keep execution costs, spreads and missed fills in the review, because none of them appear in the narration.
- Judge the process over a meaningful sample rather than from one recorded session.
A journal is only useful if it separates what was written before the move from what was explained afterward. Timestamps, screenshots and a written scenario make that distinction auditable, and they are also the only way to test claims of the kind this lesson makes.
ICT Price Action FAQs
What does the Science of Anticipation lesson cover?
A single narrated session of roughly 51 minutes: a daily-chart review, a premarket one-minute execution using the midpoint of a gap, position management as the trade develops, and extended commentary on non-farm payroll, fundamental analysis and trading psychology. The captions were read in full for this article, so the detail above reflects the recording rather than a summary of it.
Does anticipation mean knowing where price will go?
No, and the speaker is explicit about the difference. Anticipation in his usage means naming the conditions under which a scenario holds, then waiting for evidence and accepting invalidation. Markets remain uncertain and no chart model fixes a path.
Is the recording a transcript I can quote from?
No. The material behind this article is an automatic speech-recognition transcript of the full audio, which is what makes timestamped citation possible, and it is also why specialised vocabulary and any price read off the chart should be treated as reported rather than verified. The private transcript is not published here, and this page is not a transcript.
Do traders need a one-minute chart?
There is no universal rule. He uses a one-minute chart in this session and says it leaves no room for imprecision, which is also why it demands more attention and generates more noise. A timeframe should match a tested process and the risk limits of the account in use.
Do ICT concepts prove institutional activity?
They provide a framework for interpreting price. The recording asserts that price is drawn to resting orders and that algorithms act at certain levels; nothing in the transcript demonstrates institutional intent, and those statements are attributed interpretations rather than verified market mechanics.
Can this setup guarantee funded-account results?
No. A recorded session cannot show a repeatable edge, an evaluation pass or a payout. Outcomes depend on market conditions, execution, risk management and the rules of the specific programme, and the speaker’s own framing is that a high-probability level is not a profitable trade.
ICT Price Action Takeaways
Read as a method rather than a signal, this recording is coherent. He selects a location on the higher timeframe, states a directional premise, waits for a defined lower-timeframe trigger at a specific level — the midpoint of a small gap, in this case — and then treats each subsequent candle as evidence for or against the premise instead of as a reason to move the risk. He also demonstrates, unintentionally, why that discipline is hard: he was talking when the stop should have been set, and the trade was already underway before the risk was defined.
For a funded trader the transferable part is the structure, not the levels. Confirm the account rules first, size the risk before the entry, keep execution costs in the review, and treat a live demonstration as something to test on many sessions rather than as proof that the same chart pattern will produce the same outcome.
Related source video: ICT Price Action Chronicles – The Science Of Anticipation In Price Action
The mapped source for this article is ICT Price Action Chronicles – The Science Of Anticipation In Price Action on the channel The Inner Circle Trader. This BestProps page is independent educational commentary. It is based on that recording’s timestamped captions, but it is not a transcript of the video, not an official ICT publication, and not evidence that any level, order, fill or outcome described in the recording occurred as described.
Watch the original lesson on YouTube
This video cannot be played inside another website: the embedded player itself reports “Playback on other websites has been disabled by the video owner.” That response was read from the live player on 2026-09-13 and re-tested on 2026-09-14, so no player is embedded here and no blank frame is left behind. The lesson is available directly on YouTube.
Watch ICT Price Action Chronicles – The Science Of Anticipation In Price Action on YouTube ↗
Sources for price-action anticipation and the rules that apply to a funded account
Four references support this article: the source recording itself, this site’s drawdown comparison page, the Federal Reserve’s own meeting calendar, and the exchange’s product page for the futures contract the examples are associated with.
Check the recording and its own disclosures first
The mapped upload ICT Price Action Chronicles – The Science Of Anticipation In Price Action was read directly for this article. Its captions were retrieved as an automatic transcript of the full audio — 620 timestamped segments covering 51 minutes 19 seconds, with no segments flagged as low-confidence — and every timestamped reference above comes from that transcript. The watch page was checked on 2026-09-13 and showed a public, not unlisted, video credited to The Inner Circle Trader with a publication date of 2026-08-06.[1] Page metadata settles the title, channel and listed date; it does not settle what appears on the chart, and because the transcript is machine-generated, wording and any number read aloud should be confirmed against the recording itself before being relied on.
Confirm the account rules before applying any of it
The BestProps page Prop Firm Drawdown Rules by Calculation Method compares trailing, end-of-day, static and balance-based drawdown calculations across named programmes from provider documents. Read its own disclosure: it describes itself as document-based research, states its sources were checked on August 1, 2026, labels itself stale and asks readers to recheck before relying on it, and reports no first-hand account purchase, trading or payout testing.[2] Whether an anticipation plan is usable in a given account also depends on rules that page does not cover, including daily loss limits, consistency terms and restricted periods. Your own dashboard and the provider’s current document are final.
Date the event from the official calendar, not from the chart
The Federal Reserve’s FOMC meeting calendars, statements and minutes page states that the FOMC holds eight regularly scheduled meetings during the year and other meetings as needed, and that minutes of regularly scheduled meetings are released three weeks after the date of the policy decision.[3] Use it to confirm when an announcement actually happened before describing a move as post-FOMC. Knowing the dates in advance does not tell you the direction of a reaction, and the calendar is not a trade signal.
Use the exchange page for the contract, not for a forecast
The CME Group product page E-mini Nasdaq-100 Overview lists a contract unit of $20 x Nasdaq-100 Index, priced in U.S. dollars and cents per index point, and gives CME Globex trading hours of Sunday 6:00 p.m. to Friday 5:00 p.m. ET with a daily maintenance period from 5:00 p.m. to 6:00 p.m. ET.[4] The recording never names its instrument, so this page is cited for contract mechanics and trading hours only, not as a claim about which contract appears in the video. Position sizing, margins and hours can change, so check the contract specification before sizing anything.
Sources
- [1] YouTube: ICT Price Action Chronicles – The Science Of Anticipation In Price Action – The Inner Circle Trader (source recording; automatic captions read in full, page metadata read 2026-09-13: public, not unlisted, listed publication date 2026-08-06, embed disabled by the video owner when re-tested 2026-09-14)
- [2] BestProps: Prop Firm Drawdown Rules by Calculation Method (document-based comparison; page states sources checked 2026-08-01 and labels itself stale)
- [3] Federal Reserve Board: FOMC meeting calendars, statements and minutes (official meeting and release schedule)
- [4] CME Group: E-mini Nasdaq-100 Overview (exchange product page for contract unit, price quotation and Globex hours)
BestProps is not affiliated with The Inner Circle Trader, the Federal Reserve or CME Group, and no source listed here endorses this article, this site or any setup. Anticipation, context, scenario, trigger, invalidation, fair value gap, inversion fair value gap, volume imbalance, suspension block, consequent encroachment, rejection block, liquidity and PD array are used on this page only as descriptive study terms. Nothing here demonstrates a tested, repeatable or profitable result, and no claim is made that any level, session or sequence repaints less, predicts price or was verified on a live account. Statements about algorithms, liquidity and probability are the speaker’s interpretations, reported as such.