How we researched this article
BestProps used document-based research from primary firm sources, checked September 14, 2026. The complete source list, scope, limitations, and commercial-state record appear near the end of this article.
In ICT Chain Of Custody Of Price, ICT presents a lecture on tracking price from one price-delivery array — “PD array” — to the next. He works with a Nasdaq September 2026 E-mini futures chart, starting on a naked daily chart before dropping to a one-minute view, and he frames the lesson as advanced material that assumes familiarity with his array vocabulary (1:26).
This is ICT’s interpretation of price behaviour, presented with his own terminology, not independent proof that markets follow a deterministic algorithm or that the method produces a trading edge. The article was built from an automatic speech-recognition transcript of the recording’s audio — not from the video’s captions — so the wording, times and numbers below carry that caveat, and the charts themselves were not inspected. Timestamps mark where each passage begins.
What “chain of custody” means in this lesson
The phrase is used twice in the recording as a label for the whole exercise. At 37:50 he introduces “the chain of custody and control of price” while arguing that the behaviour he is demonstrating is his algorithm “doing exactly how it’s coded,” and at 55:50 he defines the study explicitly: “we’re studying the chain of custody from one PD array to the next, we’re not studying buying and selling pressure.”
At 57:32 he extends it: the chain of custody of price action is how one PD array, formed by a specific candlestick at a particular time and price, leads to price being unable to continue higher — or being allowed to continue. Start with a destination, he says, then trace the sequence of arrays between here and there.
Building the map from the daily chart down
The lecture begins with several weeks of context on the daily chart. He points to two areas he calls suspension blocks and to a particularly stretched candle wick, and explains that he had wanted price to trade below that wick and close below it before expecting lower prices (4:00). He also notes that reaching a midpoint — consequent encroachment — is not by itself enough to justify a directional conclusion (4:47).
He then layers the structures: a sell-side imbalance with buy-side inefficiency, a volume imbalance inside a larger suspension block, and relative equal lows that he treats as a draw on liquidity. He describes the suspension block as carrying a volume imbalance at its high end and another at its low end (8:12), and expresses the sequence as a move from a premium array down to a discount array (9:49).
The homework is stated early: each day you collect information rather than looking for an entry. At 10:12 he starts on the one-minute chart with the regular trading hours opening range gap — the 9:30 a.m. Eastern opening price against the previous day’s settlement — annotates its midpoint, and extends it forward to see how price worked into it. He adds that a Monday’s first presented fair value gap is “crucial information” to carry through the entire week (11:27).
Gradient levels: octants and quadrants
Once a range is chosen, he subdivides it. At 15:58 he walks through the ladder on both sides of the midpoint: consequent encroachment, then an octant, upper quadrant and the extreme octant up to the high of the imbalance; and below the midpoint, lower octant, lower quadrant, lowest octant and the low. He calls these gradient levels and argues they make support and resistance concrete: they remove the doubt about which specific high or low to watch (16:36).
He also flags the environment that makes this messy. During the week he reviews, several opening range gaps from different days sit close together, and he notes that convergence and overlapping of key levels is normal when the market is inside a large daily trading range — the highest and lowest of those clustered levels then effectively define the working range (18:17). He describes that stretch as difficult for a newer trader precisely because it is hard to trust where price will go, which is why he says he waited for something strongly weighted rather than acting on each touch (21:28).
Anchoring from bodies, not wicks
The central mechanical point of the lecture is how to pick the anchors of what he calls an implied or unrealized dealing range. At 27:17 he refuses to use the extreme of a wick, on the grounds that the wick is the part “allowed to do the damage,” and instead grades the candle bodies. Anchoring from the body high of the bearish imbalance down to the anticipated pool of liquidity produces the level he had called out publicly at 28,701 (30:41).

He is explicit that an unrealized dealing range is only a target or draw until price delivers into it, and that the inception of the move therefore has to be defined carefully — a step he says comes from backtesting and record-keeping rather than from the chart alone (28:32). He also insists the anchor must land on a key level that matters on a higher timeframe, in this case the midpoint of a wick discussed the previous week (30:41).
He then applies the same logic to a specific candlestick: the imbalance is important because it is laying on the upper octant of that range, and because its high is a finite, readable number (34:39). He points out a fair value gap forming on that octant (35:19) and, later, a candle resting on the lower octant at 0.375 of the range (43:17).
Consequent encroachment and the measuring gap
Consequent encroachment — the midpoint — recurs as the test level. At 41:51 he identifies the 50% level of the range defined by the bearish order block high down to the 28,701 draw, and notes that a fair value gap formed exactly there. He labels it a measuring gap and expects price to accelerate or consolidate without a deep retracement if the bearish premise holds. He is careful to add that he is not claiming to have invented the measuring gap — only that he tells viewers where one will form before it does, which is his claim to make, not a verified result.
The related test is the body-versus-half rule. Under a bearish reading he wants candle bodies to stay heavy in the lower half of an inefficiency, and under a bullish reading in the upper half (7:34, 9:03). At 40:44 he stresses that the bodies kept respecting a wick he had graded, and that other similar wicks do not count once a level has already been used. He reads repeated failure to leave a body in the upper half as evidence that the position can be held (46:34).
Change in state of delivery
One rule is stated as a trigger rather than a confirmation. At 37:19 he says that when bearish, a candle trading down through its own opening price validates a change in the state of delivery — it need not close below it — and that a subsequent move back up into that area is where he would sell or add to a position. This is the mechanism he uses to explain how a bearish order block is validated even when price never reaches the block’s extreme.
Reported executions
He describes his own week on the chart. At 22:41 he says he tested a reaction from the midpoint of a graded wick, was stopped out, then sold short afterwards, mitigated the loss and finished slightly ahead. Later he reports a limit order at 28,700 that did not fill, an exit at 28,717 — which he describes as 17 handles short of his target — and says he made up the difference by re-using the same gap once it became an inversion fair value gap (47:31).
These are his own account of his trades. The recording shows no order tickets, account statements or independent verification, so the entries, exits and results described here should not be treated as established performance, and he states directly that he cannot promise profitability (3:51).
Timeframes, and keeping the levels honest
He adds a practical note on timeframe selection: use multiples of four when stepping up, since four 15-minute intervals make a 60-minute chart, four 60-minute candles make a four-hour chart and four of those make an eight-hour chart, so a level that looks like a small spike on a higher timeframe is really a small formation on a lower one (51:40).
He closes by describing how he tracks the work: each day he writes the levels on a notepad, keeps a matrix of PD arrays, and reviews how the previous week’s called levels behaved (53:17). He also notes that he expects to provide nothing in advance for the following week, and that the emphasis will be on hindsight review instead (56:51). At 58:43 he compares chart study to learning to track an animal by its footprints: repetition on old data is how the recognition is built.
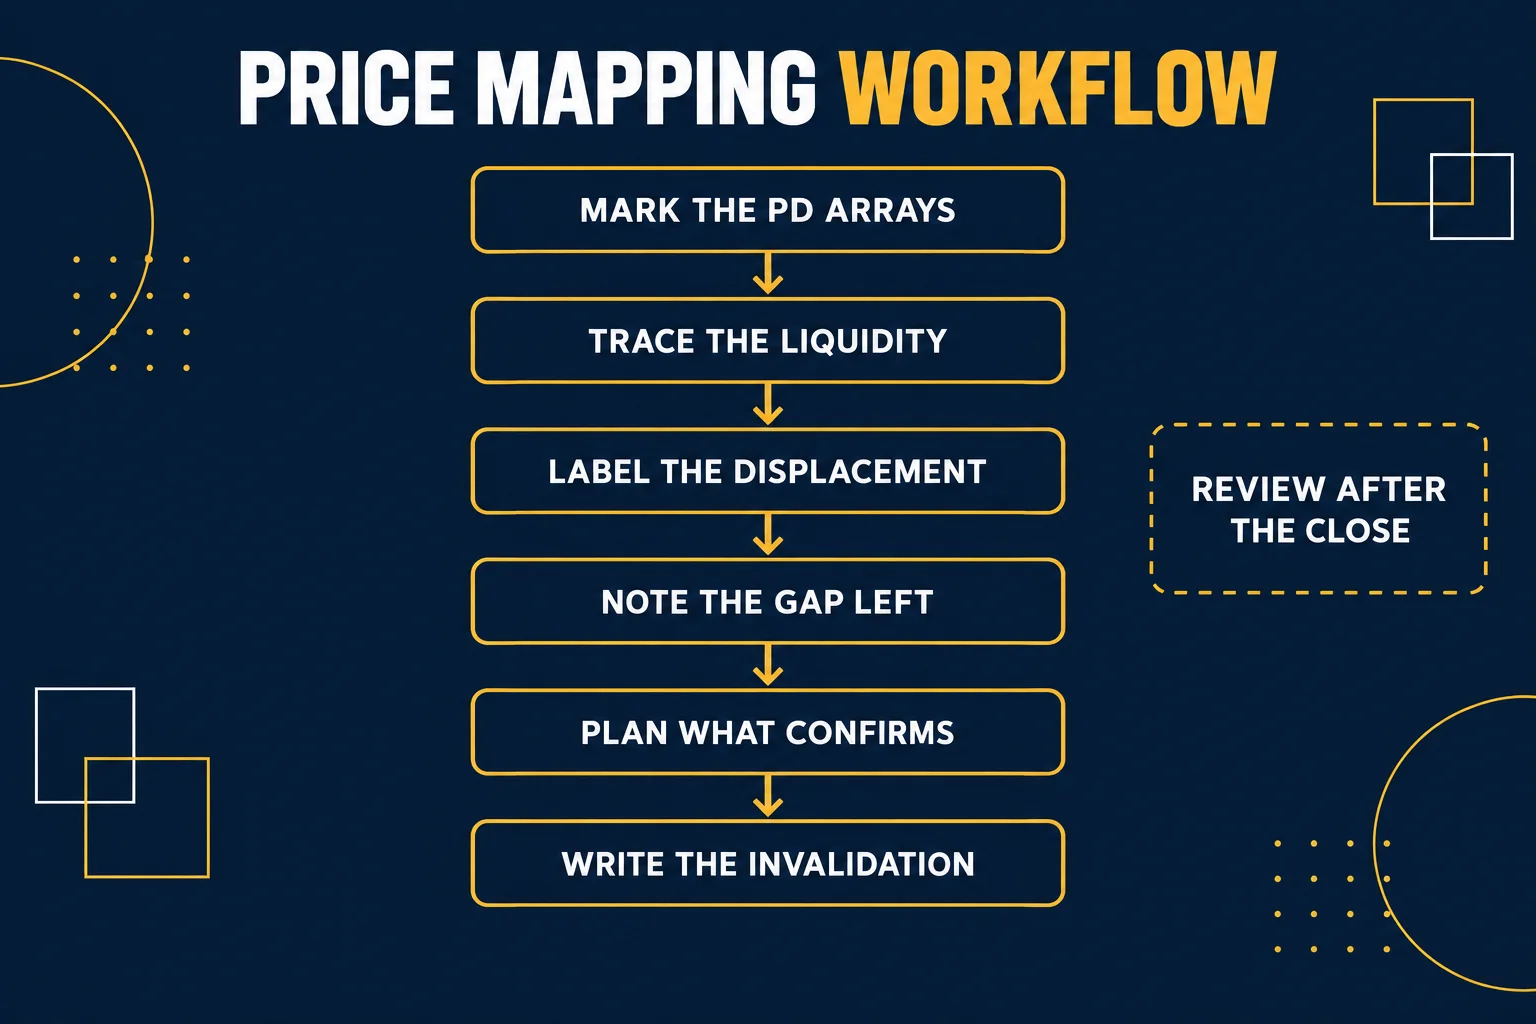
Mapping the chain: a six-step study workflow
Reduced to a written process — as a study method rather than as ICT’s own numbered checklist — the lecture’s sequence looks like this.
- Mark the PD arrays. Record the imbalances, order blocks, volume imbalances and stretch wicks that matter on the higher timeframe, and the midpoint of each (10:12).
- Trace the liquidity. Decide which pool of resting liquidity price is being drawn toward — here, the relative equal lows (26:20).
- Label the displacement. Identify the candle or run that created the inefficiency, and mark where the state of delivery changed (37:19).
- Note the gap left. Mark opening range gaps, fair value gaps and the first gap presented on the week’s opening session, then carry them forward (11:27).
- Plan what confirms. Write down what body behaviour would support the premise — bodies holding out of the upper half for a bearish read, for instance — and what would void it (7:34).
- Write the invalidation. Fix the level at which the reading is wrong before the session, and record partial exits and re-entries rather than only the winning sequence (47:31).
Account rules sit outside the chart work: drawdown, instrument and holding-period limits on a funded account can remove a setup that the chart alone would allow. Reviewing the written record after the close is what closes the loop.
What the recording does not establish
Several things should be treated as unverified. The lecture is retrospective, delivered after the week it reviews, and while ICT says he called the 28,701 level publicly in advance, the transcript cannot confirm the timing or the prior posts; the reference to market replay is answered with his own assurance rather than with evidence the reader can check. No account data, fills or statements appear in the transcript.
Numbers need care because the transcript is machine-generated. The price levels he reads out are rendered unevenly — including a candle high quoted as “28,941 even,” a minor buy-side level given as 28,891.25, a sideways range quoted as “29,330 and 29,310,” the draw at 28,701, and his reported exit at 28,717 — and each should be read off the video rather than quoted from this summary. The same applies to terminology: “sell-side imbalance, buy-side inefficiency,” “consequent encroachment,” “SIBI,” “suspension block,” “octant,” “quadrant” and “PD array” all come through the recognition layer, sometimes inconsistently, so the specialised vocabulary should be checked against the audio and the chart labels.
His wider claims are also interpretations rather than findings. He argues that the market is algorithmic and scripted, that no other school of thought contains this logic, and that his readings are highly accurate; the transcript documents the claims, not evidence for them. Finally, the upload date (25 July 2026) does not by itself establish the calendar dates of the sessions reviewed, and the charts discussed were never inspected for this article.
An educational way to review the lesson
Stripped of the specialised vocabulary, the lecture is about disciplined mapping: fix a higher-timeframe range, keep its midpoint and subdivisions written down, carry the same references across sessions, and judge each new formation against them instead of re-drawing levels after the fact. The most transferable ideas are organisational — a dated level journal, anchors chosen before the outcome is known, and a written invalidation for each reading.
A cautious way to use the material is to backtest it as a rule rather than a story: annotate historical charts without moving the anchors once the result is visible, record both the confirming and disconfirming cases, and keep the failed examples alongside the highlight sequences. The recording itself asks for that kind of repetition on old data, while noting that a newer reader will initially anchor levels a little differently than he does (53:17).
Watch the original ICT lesson
This article draws on an automatic transcript of the audio of ICT Chain Of Custody Of Price. That transcript is a source for the speaker’s words only; it is not the video’s own captions, it is not independent proof of the reported executions, and the annotated charts remain essential if you follow the lesson on the video itself.
Watch the original lesson on YouTube
This video cannot be played inside another website: when its embedded player was loaded and clicked on 14 September 2026, the player reported “Playback on other websites has been disabled by the video owner” and offered only a “Watch on YouTube” prompt, with no duration and no playback progress. That response is why no player is reserved or left blank here; the recording is available directly on YouTube.
Primary source and further reading
- The original Inner Circle Trader recording: use the timestamp links above to compare each explanation with its source passage.
- The speaker’s own post on X linking this recording: the post text is a link to the video, so it confirms the reference but adds no chart detail.
- Third-party X post summarising the term (unofficial and untested): it describes the phrase as sequential tracking from one PD array to the next, which matches the recording’s own wording, but it is not ICT material and has not been verified against his charts.
- TradingView help: how to turn Bar Replay on: background on the replay-versus-live distinction the recording raises about published executions.
- LuxAlgo “Smart Money Concepts” indicator (third-party, unofficial and untested): a community script that approximates similar concepts; it is not ICT’s method and was not tested here.
This is independent educational commentary. It is not official ICT material, a tested trading system, or a claim that the reported executions can be reproduced.