Key takeaways
In ICT 2026 Trading MNQ Futures & CFD US100 — April 28, 2026 he works the same short idea on two feeds at once: at 0:07 he says he is short Micro E-mini Nasdaq-100 (MNQ) and aiming for the relative equal lows formed that morning, and at 0:30 he shadows the same trade on a…
Read the full summary
In ICT 2026 Trading MNQ Futures & CFD US100 — April 28, 2026 he works the same short idea on two feeds at once: at 0:07 he says he is short Micro E-mini Nasdaq-100 (MNQ) and aiming for the relative equal lows formed that morning, and at 0:30 he shadows the same trade on a US100 CFD. His stated point is at 0:40: the two instruments do not print agreeing prices, so he compares structure and destination instead. He wants candle bodies to stay out of the upper half of a marked inversion fair value gap (3:38), marks a “gray pool” built from two wick midpoints (12:11), waits for heaviness below a minor sell-side wick midpoint (18:20), gives the idea a time limit of a few more candles (23:21) and narrates buying part of the CFD short back and taking two MNQ contracts off (27:47). Everything here is read from the transcript of the recording: the source is automatic speech recognition, the chart was not inspected, and the trade he describes is his narration of an unseen screen — not a verified fill, size or result.
How we researched this article
BestProps used document-based research from primary firm sources, checked September 14, 2026. The complete source list, scope, limitations, and commercial-state record appear near the end of this article.
In ICT 2026 Trading MNQ Futures & CFD US100 — April 28, 2026, ICT compares one-minute Micro E-mini Nasdaq-100 futures (MNQ) price action with a US100 CFD chart. His central teaching objective is to show how he maps the same directional narrative and liquidity objective across instruments whose quoted prices do not match exactly.
The recording presents an actively managed short scenario rather than a complete, controlled test of the methodology. ICT discusses entries, stops, partial exits and a downside target while repeatedly comparing the two charts. Because the supplied transcript comes from automated speech recognition and the chart itself was not independently reviewed, exact levels and visually displayed executions should be verified against the video.
The core comparison: MNQ futures versus US100
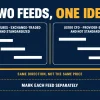
At 0:07, ICT says he is going short MNQ and targeting relative equal lows formed earlier that morning. He then says he is shadowing the same idea on the CFD. The important distinction appears at 0:40: the instruments have different numerical prices, so he compares their price-action structures and intended draw rather than expecting identical quotations.
ICT later explains that both instruments are displayed on one-minute charts with real-time data in his setup. His interpretation is that the corresponding relative lows represent the same type of sell-side liquidity objective on each chart, even though the actual quoted target differs. In practical chart-reading terms, this is a structural comparison: locate the analogous swing points, gaps and candle formations separately on each market.
At 2:27, he tells viewers who use US100 to transpose the ideas demonstrated on MNQ. He also explicitly says that the CFD provider visible on his chart is not a recommendation, partnership or affiliate relationship. That disclosure matters because the platform name appearing in a recording should not be read as an endorsement.
How ICT constructs the bearish scenario
ICT’s stated thesis combines an anticipated draw toward a new-day opening-gap area and relative equal lows with his reading of an inversion fair value gap. Around 3:38, he says he wants candle bodies to remain outside the upper half of a marked inversion fair value gap. Wicks may briefly enter the area, in his framework, but sustained candle bodies in its upper portion would conflict with the desired bearish order flow.
He applies the same test to both charts and notes small discrepancies. For example, at 7:14, he observes that MNQ briefly extends above a boundary while the US100 chart does not. He does not treat every candle as identical; instead, he asks whether the broader structure remains comparable.
ICT also explains the earlier context at 8:23. His account includes an opening move lower, what he calls a Judas swing, interaction with a daily bullish order block, and a subsequent change in delivery. He references order blocks, a propulsion block, gap analysis and a target based on 30% of the previous week’s range, which he labels “TGIF.” These are ICT’s own market interpretations and terminology, not independently validated signals in this transcript.
The “gray pool” and candle confirmation
Beginning near 12:11, ICT marks what the automated transcript renders as a “gray pool.” He describes it as an area derived from two candle wicks and their midpoint or “consequent encroachment” levels. His expectation is that a return to this zone should lead to sharp downside movement if the bearish thesis is operating as anticipated.
He does not rely only on price touching a line. He looks for:
- candle bodies remaining in the lower half of the relevant inversion fair value gap;
- decisive closes below a minor sell-side level or wick midpoint;
- larger, strongly extended bearish candles as evidence of downside urgency;
- limited time spent consolidating near the setup area; and
- confirmation from MNQ while using the CFD chart for detailed annotations.
At 18:20, he says confirmation would involve heaviness below the midpoint of the marked sell-side wick. He also clarifies that, in his interpretation, the CFD responds to the futures market rather than causing the futures market to move.
Time, volatility and position management
The session includes several risk-management observations. At 7:56, ICT says he would normally tighten the MNQ stop but chooses not to because of volatility. Later, around 23:21, he says the market has spent too many candles near the area and suggests that two or three additional candles could function as a time-based limit for seeing the anticipated movement.

After price moves lower, ICT discusses partial exits. At 27:47, he narrates buying back part of the CFD short and then reducing the MNQ position. He identifies the CFD activity as demo trading. The transcript reports his narration of on-screen confirmations, but it cannot independently establish the displayed fills, account details or final result.
Educational takeaways
The most transferable lesson is not that MNQ and US100 print the same prices. It is that ICT compares corresponding structure independently on each feed. His process tracks analogous lows, wick midpoints, gaps and candle-body behavior, then asks whether both charts continue to support the same directional hypothesis.
A second lesson is that his thesis has conditional elements. A failure to remain below the marked gap, weak downside candles or excessive consolidation would make the scenario less consistent with what he expected. Those conditions provide a clearer educational framework than treating any one annotation as a guaranteed outcome.
This video documents one narrated example and ICT’s interpretation of it. It does not establish how often the approach succeeds, account for CFD feed differences across providers or demonstrate long-term profitability. It should be studied as market commentary and terminology, not as investment advice or a performance promise.
The recording this article is grounded in
The mapped recording is ICT 2026 Trading MNQ Futures & CFD US100 — April 28, 2026 on the channel The Inner Circle Trader. Its watch page was read on 2026-09-13 and returned that title, that channel, a publication date of 2026-04-28 at 11:03:00 in the UTC-07:00 offset, a runtime of 1,853 seconds (30:53), a view count of 66,709, and a page status reporting the video as public rather than unlisted or private.[1] The description field carries the uploader’s standard futures risk disclosure, opening with “Government Required Risk Disclaimer and Disclosure Statement” — not a trade record.[1]
Those are publication facts. For this revision the inside of the recording has been recovered as well: the full original audio was transcribed on 2026-09-14 by local automatic speech recognition (whisper-large-v3-turbo), and every substantive statement above is checked against that timestamped transcript. Because the source is machine transcription of speech rather than captions a human checked, two cautions apply. ICT’s specialized vocabulary is mis-rendered in places: the transcript writes “inversion fair bag gap”, “consequent correction” and “gray pool”, and the article keeps the last of those in quotation marks because the formal label is unclear from the audio. Spoken numbers are also unreliable: the recording names a lower-quadrant level, a 184.25 area, a 26,970 area and a target he describes as 30% of the previous week’s range, but those are spoken descriptions of a chart this page has not seen, and machine transcription is not dependable on numbers. They are reported here only as examples of what he says — never as verified chart values — and no dollar figure, tick count, fill or result is derived from them.
Two further limits are worth stating plainly. The title carries the date April 28, 2026 and the upload date matches it, but nothing in the transcript identifies the trading day, so the date is reported as a publication fact rather than as a verified session date. And the page does not claim the reviewer watched the charts: the session is described above exactly as he narrates it, and the on-screen executions he refers to are his own on-screen notifications, not something this page verified.
One point of context comes from the recording itself rather than from any outside source: he says that he is not legally permitted to trade CFDs from the United States, that he does not know off the top of his head which regions are prohibited, and that the CFD activity shown is therefore demo trading.[1] Those are his comments about his own situation. They are not legal or regulatory guidance, and the rules differ by jurisdiction.
Watch the original recording on YouTube
This video cannot be played inside another website: the embedded player itself reports “Playback on other websites has been disabled by the video owner.” That response was re-read from the player on 2026-09-14 from a bestprops.com page origin, so no player is reserved here and no embed is left blank. The recording is available directly on YouTube.
Watch ICT 2026 Trading MNQ Futures & CFD US100 \ April 28, 2026 on YouTube ↗
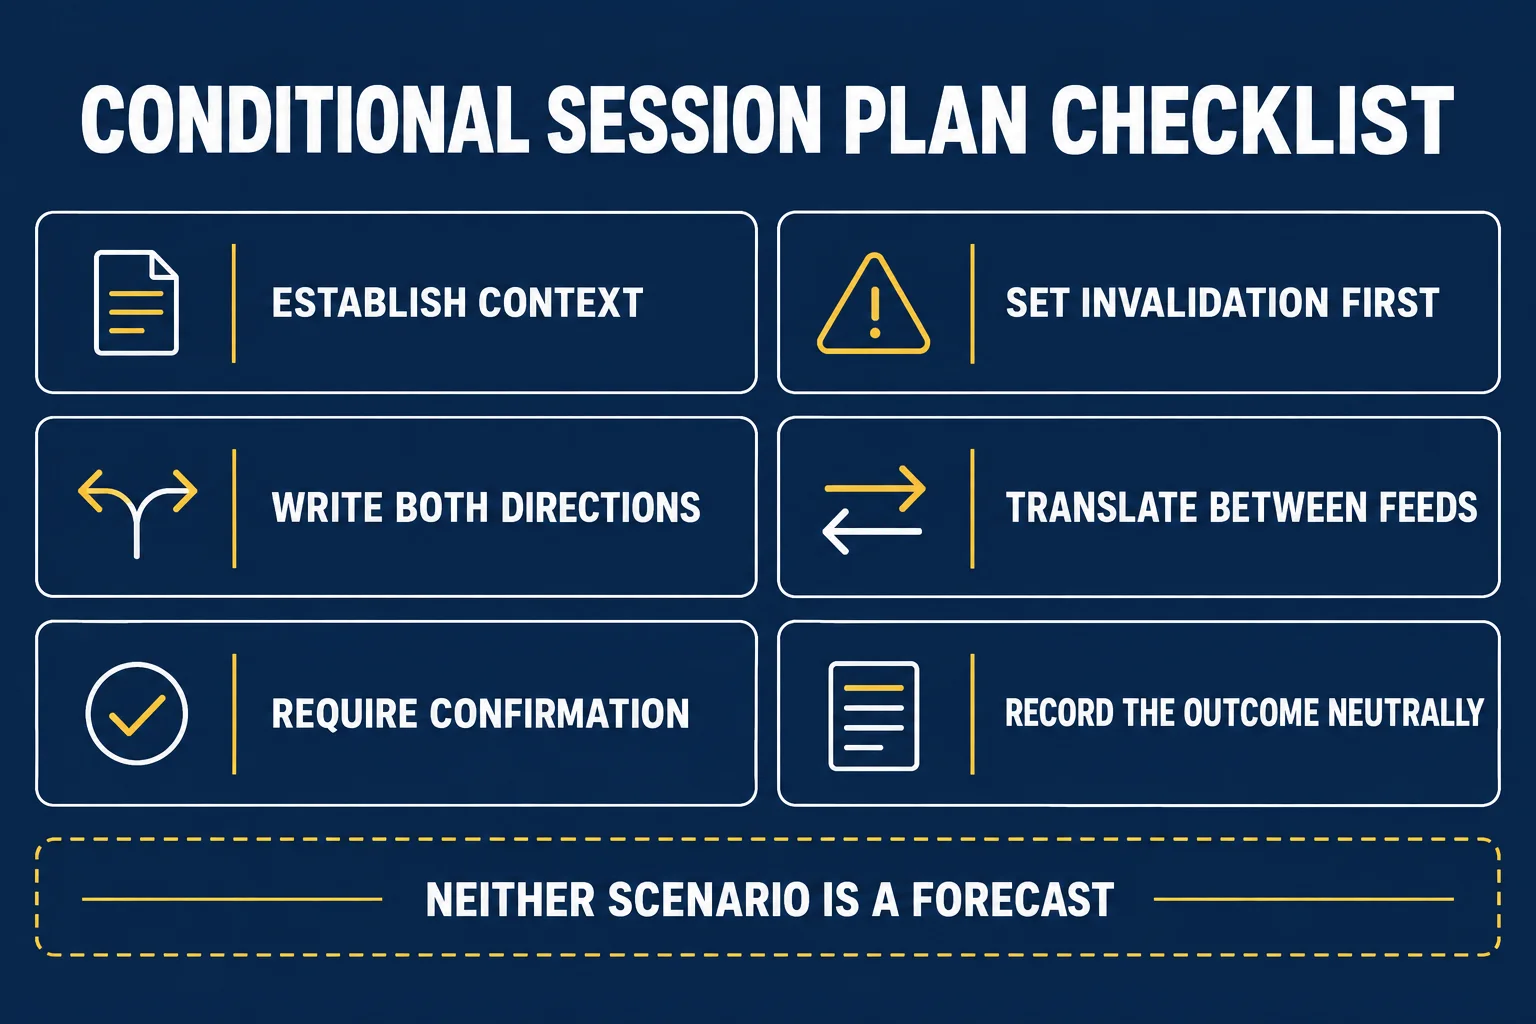
A six-step study sequence for reviewing this comparison
This sequence is this site’s study aid rather than a method the recording sets out, and it follows the questions the session itself raises.
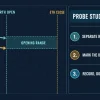
- Establish context. Mark the levels the source actually names — prior-session references, the session open, equal highs and lows, and any opening-range gap — before deciding what the chart is doing.
- Write both directions. State one conditional bearish case and one conditional bullish case, each with the observation that would confirm it.
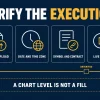
- Require confirmation. In this recording confirmation means candle bodies staying out of the upper half of the marked gap and heaviness below a wick midpoint, not a touch of a line.
- Set invalidation first. Decide what would end the idea, and treat a time-based limit as one of those conditions: he gives the setup two or three more candles before calling it stale.
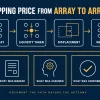
- Translate between feeds. If two instruments express the same idea, mark each feed’s own structure and destination separately, as he does between MNQ and the US100 CFD.
- Record the outcome neutrally. Log what was done and why, including partial exits and what the exercise showed, without turning narration into a performance claim.
Sources and method
Four references support this revision: the mapped recording, the exchange specification for the futures contract on his left-hand chart, a dated regulator record of the EU restrictions applied to contracts for difference, and this site’s own rule-comparison page. Each is used only for the narrow question it answers.
The recording, and what its page settles
The mapped upload ICT 2026 Trading MNQ Futures & CFD US100 — April 28, 2026 was read directly for this revision: channel The Inner Circle Trader, published 2026-04-28 at 11:03:00 in the UTC-07:00 offset, runtime 1,853 seconds, view count 66,709, public rather than unlisted or private.[1] The page therefore settles existence, title, channel, publication date, length and visibility, and nothing about the market. The recording’s contents are established here by its transcript, transcribed locally for this revision, which is the source for every session detail above.
What the exchange establishes about MNQ
The CME Group specification for Micro E-mini Nasdaq-100 futures describes MNQ as a smaller-sized version of the benchmark E-mini contract, quoted as $2 × the Nasdaq-100 Index with a minimum tick of 0.25 index points.[2] That describes the instrument he is trading on the left-hand chart. It says nothing about a CFD, whose quote, spread, financing and contract terms are set by the provider, and this page asserts no equivalence between the two beyond what the recording shows him doing.
Why the two feeds are not the same instrument
The recording is unusual in that it states the problem itself: he says he is comparing and contrasting real-time MNQ futures price action with the CFD price shown beside it, and that the prices do not agree even though the two charts target analogous lows.[1] For regulatory background, the EU regulator’s own 2018 notice records that from 1 August 2018 CFD sales to retail investors in the EU were restricted, with leverage limits, a per-account margin close-out rule, per-account negative balance protection, a ban on trading incentives and a standardised risk warning.[3] That page is a dated regulator record of the 2018 adoption: it does not state whether those measures remain in force, how they have changed, or what applies outside the EU, and nothing on this page is legal or regulatory advice. His own remark that he cannot trade CFDs from the United States is reported as his comment, not verified here.[1]
What the prop-firm rule page is for
Nothing in the recording is a prop-firm evaluation, so no rule compliance is claimed. For readers who do trade an evaluation, this site’s rule-comparison page sets out that rule sets differ by firm across daily loss limits, drawdown type, consistency requirements, payout gates, news and weekend restrictions and position limits, and it describes itself as a rule-risk scanner rather than a recommendation to buy an account.[4] Futures and CFDs both carry substantial risk, and a narrated session establishes nothing about how often any approach works.
Sources
- [1] YouTube: ICT 2026 Trading MNQ Futures & CFD US100 \ April 28, 2026 – The Inner Circle Trader (mapped source recording) (mapped source recording; watch page read 2026-09-13: public, not unlisted, channel The Inner Circle Trader, published 2026-04-28 at 11:03:00 in the UTC-07:00 offset, runtime 1,853 seconds, view count 66,709, description field is the uploader’s standard futures risk disclosure; embedded player re-tested 2026-09-14 from a bestprops.com origin and again reported that playback on other websites has been disabled by the video owner)
- [2] CME Group: Micro E-mini Nasdaq-100 Index Futures Contract Specs (exchange operator’s own product specification for the contract the recording trades on the left-hand side: $2 x the Nasdaq-100 Index with a 0.25 index point minimum tick)
- [3] ESMA: ESMA adopts final product intervention measures on CFDs and binary options (01/06/2018) (a dated regulator record (01/06/2018) of the EU product-intervention measures applied to contracts for difference from 1 August 2018; it states the 2018 measures and their start dates, not their current status in any jurisdiction, and it is not legal advice)
- [4] BestProps: Compare Prop Firm Rules Before You Buy (this site’s own rule-comparison page: it documents per-firm daily loss, drawdown, consistency, payout, news and position limits and describes itself as a rule-risk scanner rather than a recommendation)
Editorial note: what changed in this revision
The earlier version of this page was written without the recording. Its opening stated that the page was “not an official April 28, 2026 ICT lesson or market recap” because “no livestream, transcript, charts, timestamps, catalysts, entries, exits, or results were supplied”, and its FAQ answered that no official lesson had been provided or verified for this draft. The mapped upload is a first-party video on The Inner Circle Trader channel, published 2026-04-28 and public, and it has now been transcribed in full from its own audio.[1] The generic preparation framework, the “details to verify” list and the FAQ were therefore replaced with the transcript-grounded article above: the recording supplies an actual worked example, told in his own words with timestamps, which is more useful than a plan for a session nobody had seen.
Two matters are recorded rather than smoothed over. The transcripts of his special vocabulary are unresolved in places — “gray pool” in particular is kept in quotation marks because the formal label cannot be settled from the audio — and no level, fill, position size or result from the session is treated as verified, because the page relies on speech, not on the screen. The measurement claims in the old framework about MNQ contract mechanics have been replaced by the exchange’s own specification rather than restated from memory.[2]
BestProps is not affiliated with The Inner Circle Trader, CME Group, Nasdaq, ESMA or any broker or prop firm, and no source listed here endorses this article, this site or any setup. No broker appearing in the recording is recommended, and nothing here implies a partnership with one. ICT terminology used on this page — liquidity, inversion fair value gap, gray pool, sell-side liquidity, order blocks — is descriptive study language for third-party educational concepts, is not an official ICT publication, and has not been tested first-hand by this site. A single narrated session cannot show how often an approach works, and nothing here is investment advice.