Key takeaways
This is Part 2 of ICT’s discussion of how to probe a low-probability opening range, published for 07/14/2026 and recorded shortly before an 8:30 a.m.
Read the full summary
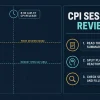
This is Part 2 of ICT’s discussion of how to probe a low-probability opening range, published for 07/14/2026 and recorded shortly before an 8:30 a.m. ET CPI release, with PPI expected the following day. Working from the episode’s own automatic transcript, this article sets out how he says he chose one specific downside reference (relative equal lows sitting inside the low end of a daily-chart volume imbalance), the regular-hours low he reports as 29,325.75 and describes as one tick from his level, an overnight London sequence he labels with a sweep, breaker, order block and fair value gap, and the two upside references he expected price to explore — Monday’s opening range gap and an incompletely closed new week opening gap. He closes by saying he will not participate around CPI or PPI and by arguing that holding positions into those releases is not disciplined risk management. The transcript is machine-generated, the instrument is never named in it, no chart was viewed for this review, and none of the numbers or reactions below is independently verified.
How we researched this article
BestProps used document-based research from primary firm sources, checked September 14, 2026. The complete source list, scope, limitations, and commercial-state record appear near the end of this article.
The keyword phrase ICT part 2 how to probe low probability RTH opening ranges 07/14/2026 points at one recording: Part 2 \ How To Probe Low Probability RTH Opening Ranges 07/14/2026 on The Inner Circle Trader, YouTube video ID bz4QNPcpmWE. This page is an independent, transcript-based review of that recording. It is not a transcript of the episode, not an official lesson, and not a claim about the channel’s or anyone else’s results.
What the recording is
- Title: Part 2 \ How To Probe Low Probability RTH Opening Ranges 07/14/2026
- Channel: The Inner Circle Trader
- Length: about 15 minutes (15:04 on the watch page; 904 seconds of audio in this review’s cached source)
- Session types named: regular trading hours (RTH) and electronic trading hours, the latter referred to after the 4:15 p.m. Eastern resumption
- Instrument: never stated in the transcript. The single level it captures numerically is rendered as 29,325.75, which is futures-scale, but the symbol and contract month are not established here.
Timing. At 0:08 he says he is reworking a lesson he had given his son the previous day, at 0:26 he says the CPI number is due at 8:30 a.m. Eastern “just a little under an hour away”, and at 13:06 he says that if the levels he is watching are not reached today he expects them tomorrow “on the PPI number”. That sequence is consistent with the 07/14/2026 date in the title and with a CPI release on the recording day, but the platform’s displayed date and the session being discussed can differ, so this article treats the timeline as the speaker’s own account rather than as an independently verified publication time.
Source basis. The recording was transcribed from its full original audio by local automatic speech recognition (whisper-large-v3-turbo) on 2026-09-14: 189 timestamped segments, complete audio, no low-confidence spans flagged. That is machine transcription, not human-verified captions, and it visibly garbles specialised terms and numbers. No chart, price scale or annotation was viewed during this review.
The starting point: a daily-chart area, not an intraday pattern
At 0:55 he says a particular area on the daily chart was his immediate focus and that he had named the whole range to the downside, because the exercise is probing a low-probability opening range: how far can it go? At 1:33 he reads values off his chart that the transcript renders only as “931.25” and “37.75”; those are not usable as levels and are not repeated here as facts. At 1:43 he explains that price was already below the upper volume imbalance, which is why he set that reference aside and worked with the lower imbalance instead.
The methodological statement comes at 4:38 and 4:58: he goes back through older data to find a higher-time-frame key level where a session or daily higher low might form, working predominantly from the daily chart because, in his words, without a daily-chart perspective you do not have the highest degree of probability in your favour. Whether the daily chart deserves that status is his claim, not a finding of this review.
How he says he selected the reference low
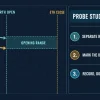
He then drops to a one-minute view at 2:35, anchored to the 9:30 a.m. opening candle on the 13th, and at 3:50 identifies the relative equal lows he had chosen — the feature he says sits inside the low end of that daily volume imbalance. Between 5:25 and 5:38 he compares the candidate lows on the chart and says he wanted the one that was first encountered when dropping down from where price was at 9:30.
He also claims foresight from the earlier upload. At 6:16 he notes that his video the previous day was published before the daily bar was complete and says that low became the low of the day, adding at 6:35 that volume profile, Elliott Wave and another commentator did not identify it. That is a self-assessment made in hindsight; a transcript cannot establish what a completed or incomplete chart showed at the time, and no external record of the earlier call was checked here.
The reported sequence that follows, in his narration: price traded down through those lows, he expected them to be knocked out and price then to come back up into Monday’s opening range gap (6:44), the regular-hours session settled there, and the electronic session later went lower still (6:57). At 7:51 he states the low he had been pointing at as 29,325.75, describing it at 8:01 as one tick away from the level he had identified, after which price rallied and took out relative equal highs. Read that as his own reported reading of an unseen chart: the level is machine-transcribed, the phrase “one tick away” is not precise here, and the contract he was charting is never named.
One further ambiguity is worth recording rather than resolving: at 10:49 he refers to sums of money that the transcript renders as “14,000, 13,000, 15,000”. Those figures are unreliable as transcribed and are not treated as results anywhere in this article.
The overnight sequence he labels
From 8:09 he describes a sell-off at the peak of the Asia session, another sweep of the low, and a rally back through the imbalance he had highlighted in yellow; around 8:27 he ties the sequence to the midnight open and points out the London opportunity at 8:46.
The labels he applies, in order: a trade lower into a breaker, described as a low-high-lower-low sequence (8:52); a retracement into an order block, with the open called a change in the state of delivery (9:12); then a breaker with a fair value gap at the same location, which he calls another “unicorn” (9:29); and a willingness to trade higher with a further small gap, from which he says higher prices were expected (9:43).
These are ICT methodology terms applied to a chart this review could not see. The overlap of a breaker and a gap is his reading, not a measured event, and the sequence is presented here as an example of how he frames overnight delivery rather than as a repeatable setup.
Where he says price was being drawn
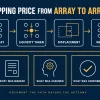
Two upside references dominate the second half. The first is Monday’s opening range gap: at 10:09 he identifies its low as 9:30 a.m. Eastern the previous day, the opening price of that session. The second is the new week opening gap, which he says did not fully close (12:51), a condition he reads as “decidedly weak” after a Sunday-night sell-off into sell-side liquidity.
Between those, at 11:46 he says the prior opening range gap is the level price wants to gravitate back to, and at 12:20 he names a level the transcript renders as “consequent quarter return” at around 29,881.5, followed by the upper half of that range and then the new week opening gap. The transcribed term is almost certainly not the label he used, and the level itself rests on machine transcription of his speech rather than on anything verified here; it should be checked against the audio and chart before being reused.
He summarises the session’s own behaviour at 11:10: the 9:30 open, a push into the lowest part of the opening range gap, a move lower to the regular-hours imbalance, and then, after the 4:15 p.m. Eastern resumption, a lower low in the electronic session followed by a market structure shift. His stated expectation was for price to reach those upper areas today, or tomorrow on the PPI number (13:12), and at 13:28 he says plainly that he could be wrong.
The part he stresses most: not trading the release
The closing minutes are the clearest message in the recording and the reason the lesson stands on its own apart from any level. At 13:12 he says he will not be participating. His argument, in order:

- “Your stop loss isn’t going to save you and it’s still a gamble” around these releases (13:21).
- Unrealized open profit can evaporate immediately and put a trader into a net loss, because extreme price runs tend to follow these reports (13:52).
- He has also seen quiet releases that did nothing, but says the risk is not worth taking if a position is in profit (13:58).
- He will not congratulate a viewer who catches a move into those levels, because he does not consider that sound behaviour for a risk manager, and he groups CPI and PPI with non-farm payroll as reports to stay out of (14:15) and (14:46).
Presented as his opinion and coaching, this is the most transferable part of the episode, and it is also the part that costs nothing to test: a trader can decide independently whether to be flat around scheduled releases. It does not establish anything about the outcome of the levels he named.
How to study a lesson like this
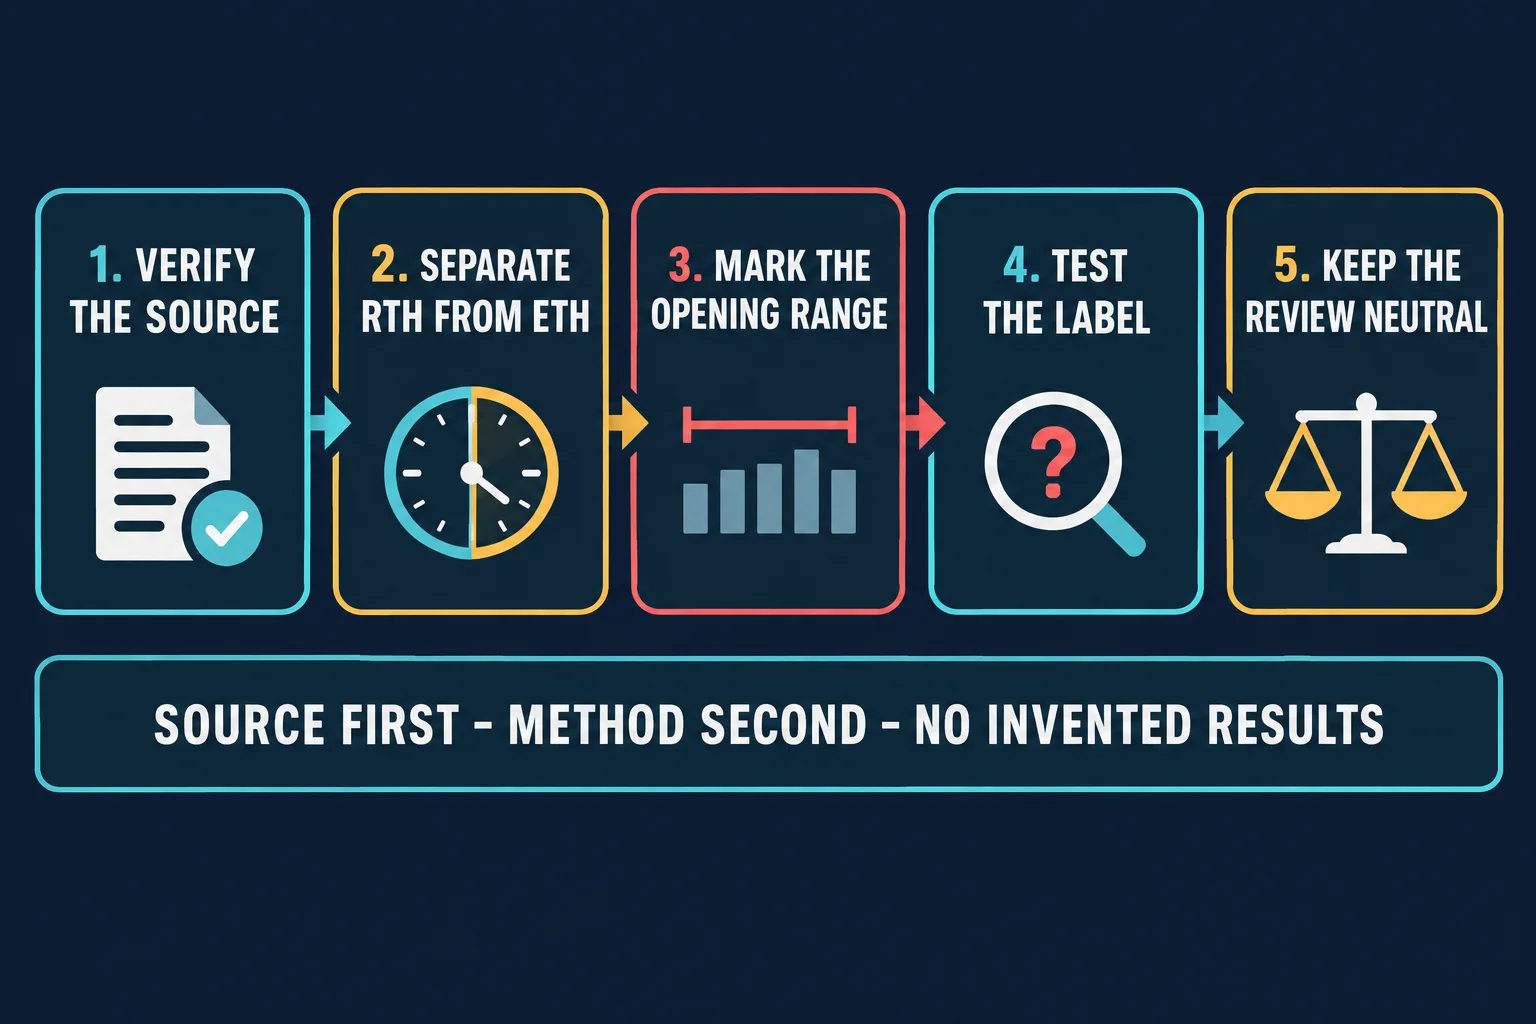
- Name the instrument and the session. The transcript never states the symbol or contract month, and RTH versus electronic hours changes which lows, opens and gaps you are looking at. Nothing here should be reused without that confirmed.
- Separate the primary source from the framing. The recording is the source; a summary of it, including this page, is secondary.
- Treat the numbers as provisional. Levels such as 29,325.75 and 29,881.5 come from machine transcription of speech, and other figures in the recording did not survive transcription cleanly at all.
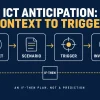
- Keep conditional language conditional. “It could come back up into Monday’s opening range gap” is a scenario, and the speaker says himself that he could be wrong.
- Do not promote a reported low or a claimed early call into a verified result. No fills, account data or outcome for these sessions is established by the transcript.
- Check your own rules. Funded traders should confirm current news-trading, maximum-loss, trailing-drawdown and position-size restrictions before taking scheduled-release risk, and note that the drawdown method in your programme may be calculated on unrealised profit.
Watch the original recording on YouTube
This recording cannot be played inside another website. An embedded player test run on 2026-09-13 from a BestProps page origin returned, from the player itself, “Playback on other websites has been disabled by the video owner”, so no player area is reserved here and no blank embed is left behind. The recording remains available directly on YouTube.
Watch Part 2 \ How To Probe Low Probability RTH Opening Ranges on YouTube ↗
Sources for contract, session and rule context
Four references were read in a browser on 2026-09-14 for this article. None of them reports a market reaction, a price for the sessions discussed, or anything about the recording itself, and none is connected to the channel.
- [1] CME Group: E-mini Nasdaq-100 futures contract specifications (official exchange reference for the contract most often charted in this kind of lesson; read 2026-09-14). Cited for contract and session context only. The transcript does not name the instrument, so this link does not establish what he was charting.
- [2] U.S. Bureau of Labor Statistics: schedule of releases for the Producer Price Index (official calendar for the release he says follows the recording; read 2026-09-14). Cited because the episode is built around CPI and PPI timing, not as data about any session.
- [3] NinjaTrader: trading hours templates (vendor documentation for separating regular from extended session hours; read 2026-09-14). Third-party platform documentation, listed as a practical reference for the RTH-versus-electronic distinction the lesson depends on.
- [4] BestProps: prop firm drawdown rules by calculation method (this site’s own reference page; read 2026-09-14). Relevant because unrealised profit sits inside many drawdown definitions, which is the practical form of the risk point he makes in the closing minutes.
The primary source for everything attributed to the speaker above is the recording itself, Part 2 \ How To Probe Low Probability RTH Opening Ranges 07/14/2026, reviewed through its own timestamped transcript. BestProps is not affiliated with The Inner Circle Trader, CME Group, NinjaTrader or the U.S. Bureau of Labor Statistics, and no source listed here endorses this article, this site or any setup. No trading result described in the episode is verified on this page, the levels quoted carry the uncertainty of automatic transcription, and nothing here demonstrates a tested or repeatable edge.