Key takeaways
The Inner Circle Trader’s 9 March 2026 recording (17:17 of audio, public and first-party) walks through a bullish Micro E-mini S&P 500 (MES) setup he repeatedly calls a demo or paper trade.
Read the full summary
The Inner Circle Trader’s 9 March 2026 recording (17:17 of audio, public and first-party) walks through a bullish Micro E-mini S&P 500 (MES) setup he repeatedly calls a demo or paper trade. He names an inversion fair value gap at 0:11, requires that no candle body close below his invalidation level, rolls the stop up below each candle low once a short-term high is taken, and targets the day’s intraday high. The arithmetic he sets out for practice is one micro contract at $5 per handle, $50 a day across twenty sessions. He also states that he is in the United States, refers to the CFTC, and says he is not a regulated trade advisor. Nothing here reports a fill, a quoted price or a settled result: the recording establishes what he said about the setup, not what executed.
How we researched this article
BestProps used document-based research from primary firm sources, checked September 14, 2026. The complete source list, scope, limitations, and commercial-state record appear near the end of this article.
In ICT 2026 Micro Emini S&P 500 Live Trade Execution March 09, 2026 on the channel The Inner Circle Trader, the speaker walks through a bullish Micro E-mini S&P 500 (MES) position that he repeatedly calls a demo or paper trade. This article is grounded in a full-length automatic transcription of the recording’s audio, so the setup, the stop management and the stated objectives below are his words and his numbers, in the order he said them.
Two different questions are kept apart on this page. The recording’s existence, creator, publication date and instrument are page facts that can be checked. What happened inside the position — an entry, a fill, a result — is not established by the audio at all, and nothing here presents it as a verified execution. The recording’s charts were not examined for this article, so no price level is read off a screen; every level is described the way the speaker described it.
What the source is
The mapped upload is public and first-party: published 9 March 2026 at 08:22:20 in the UTC−07:00 offset, credited to The Inner Circle Trader, with a stated runtime of 1,037 seconds — about seventeen minutes.[1] That is consistent with the session he narrates. He refers to “today, Monday” and takes Friday’s settlement as one end of the regular-hours gap, which fits the Monday 9 March 2026 date carried in the upload’s own title. Here the upload date and the session being described fall on the same calendar day, so there is no date discrepancy to explain.
The transcript behind this article is automatic speech recognition of the full original audio, not YouTube captions. Its timestamps are approximate and it mishears words in places, so each passage paraphrased below links to its moment in the recording and is flagged where the wording is genuinely unclear. This is what the speaker said, not a reading of his chart.
The setup he describes: an inversion fair value gap
He opens at 0:04 saying he is looking for “a run to the buy side”, and at 0:11 he identifies part of the recent price action as an “inversion fair value gap” — a gap that first acted in one direction and is now being used to frame a trade the other way. A stop is referenced below a candle’s low (0:28), and at 0:44 he says he entered while price was trading down into that area. The automatic transcript renders that phrase loosely, so treat it as his description of entering at market rather than a quoted fill.
The condition attached to the area matters more than the area itself. At 1:14 he points to a candle wick, and at 1:26–1:37 he says the body has not been inside the range and that what he is watching for is a close, or a body laid down, below his level. In his framework a wick trading into a level is a different event from a body accepting below it, and only the second would invalidate the idea.
His stated sequence is:
- price trades down into the area he has marked;
- no candle body closes below his invalidation level;
- a short-term high is taken out;
- the stop moves up as each intermediate high is cleared;
- the objective is the day’s intraday high.
Later in the recording, after price has run, he returns to the same candle and identifies it as a bullish order block (16:14).
Rolling the stop up as highs are taken
At 1:44 he says that if the nearby high is taken he will move the stop to just below a candle’s low. At 2:20, once that high has been taken, he does it, describing the risk left in the position as less than the cost of having a pizza delivered (2:33). His stated objective is a return to “today’s intraday high” (2:40).
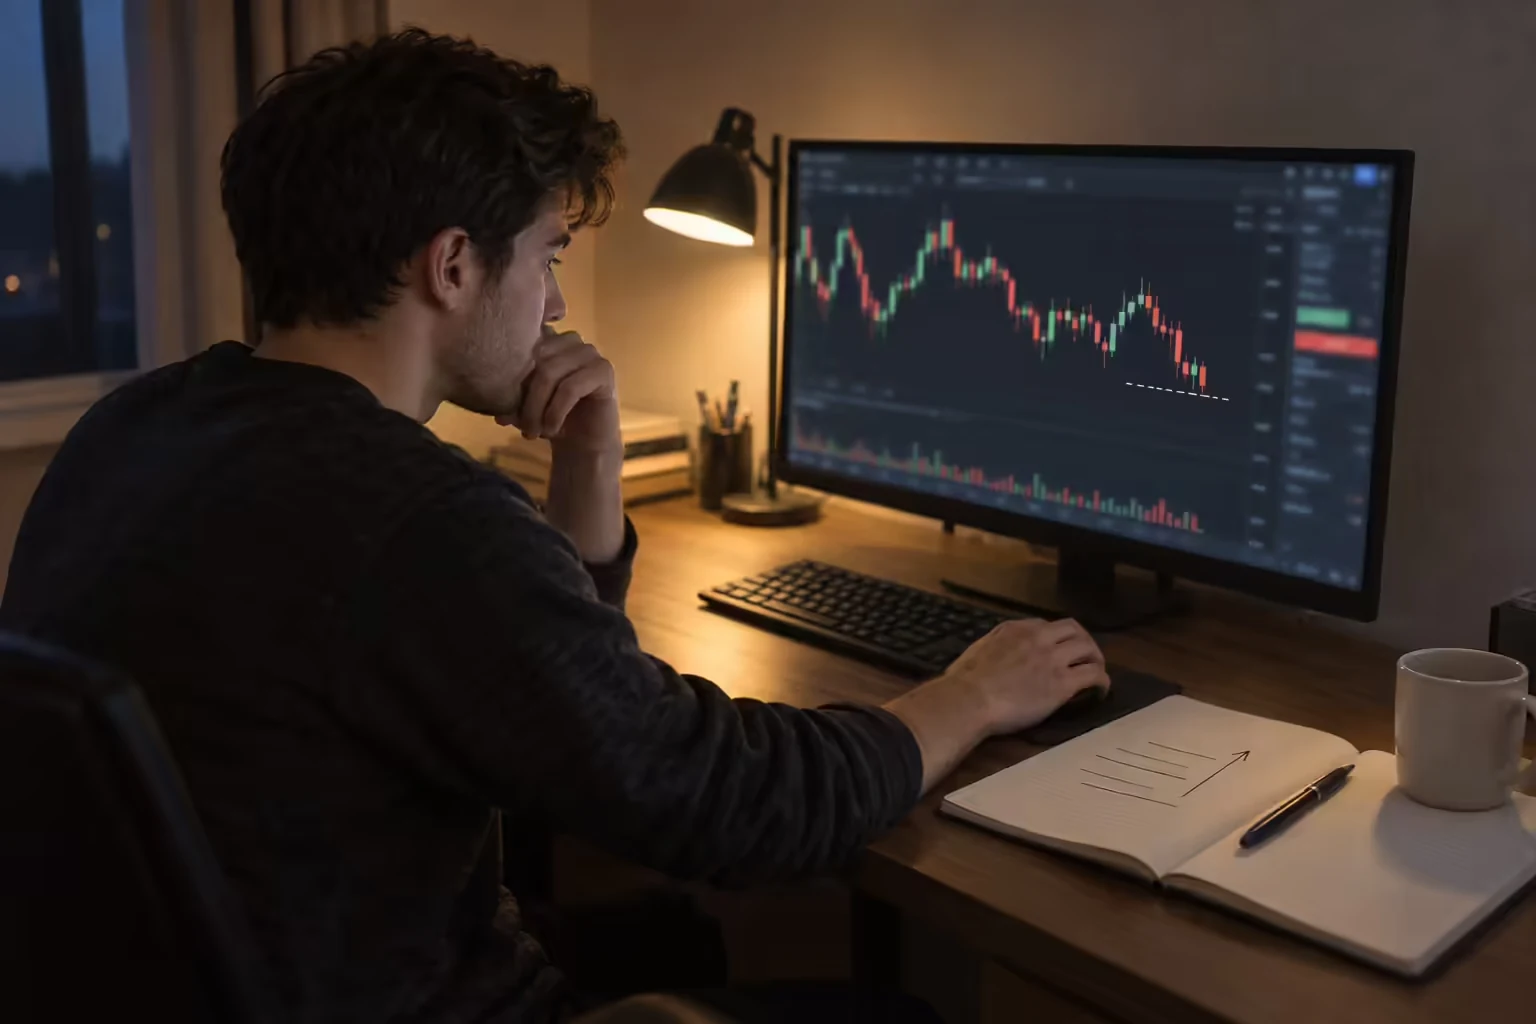
The sequence repeats later: price running higher off a down-close candle, then the stop moved above the prior high, which he says locks in “a good portion” of what he expects for the week (11:00–11:25), and another roll at 12:41. Two of those rolls come with dollar figures: he says he has “banked hypothetically” $50 for the day if he is stopped out (12:53–13:01), and later that a further stop adjustment would protect about $100 after commission, again “hypothetically” (13:49–14:01). Those are his contingent descriptions of a demo position at his own stop levels, not reported fills or realized results.
The regular-hours gap and the “consequent encroachment” fold
At 2:53–3:17 he switches to a session view: the regular-trading-hours gap is measured from Friday’s settlement to Monday’s 9:30 open, and he also marks what he calls consequent encroachments inside that range. In ICT usage, consequent encroachment refers to the midpoint of a range; he later refers to price arriving in its “upper quadrant” (13:19), the half of the range between that midpoint and the high. He is explicit that traversing the whole gap is not his requirement — his nearer objective is a run at the high where he believes traders who are already short will be forced out (3:20–3:37). That is his reading of positioning; the transcript cannot establish who held what.
He closes the loop near the end, at 13:19–13:38: price came down into the consequent encroachment’s upper quadrant, he used the open of that candle, and price then ran through two liquidity pools he had mentioned earlier. This review of a favourable sequence comes after the move it describes, and it is his narration of his own model rather than an independent finding about the session.
One micro contract, four weeks, $50 a day
The lesson is framed as an exercise rather than a one-off call. At 8:33 he states that the Micro E-mini S&P 500 contract is “$5 per handle”. At 8:43–9:11 he sets out the arithmetic he wants viewers to try on a demo account: one micro contract, a $50 win per day, and twenty trading days, which he presents as a $1,000 four-week figure. He then says that at that moment he is more than 10 handles to the good, that closing would be “over 60 bucks”, and that he would be done for the day (9:47–10:02) — but he says he will hold for the things he teaches instead.
He supplies two pieces of context himself. An earlier Micro Nasdaq version of the same exercise, captured in screenshots on X after his streaming setup failed on him, produced “$176 in a demo” (4:50–5:20), and he points viewers to an assignment he gave the previous evening in the Trader Roundup podcast on X (5:26–5:31). He also notes at 4:39 that discount-brokerage commission costs are part of his figuring. The $1,000 is his described net figure for the period; the arithmetic he states ($50 × 20 sessions) does not by itself deduct costs, which is one reason to read it as a practice target rather than a projection.
Risk framing: precision instead of heavy-handed betting
Between the position management and the arithmetic sits the part of the lesson that travels beyond ICT’s terminology. From 11:40 he argues against what he calls over-leveraging and heavy-handed betting, describing leverage as a double-edged sword: it flatters a lucky streak, and the same position that took time to build can, in his words, be given back in half that time or less when it goes against you. At 15:40–16:00 he contrasts being “highly precise with small bet sizes” against heavy betting that wipes traders out. He also presents the two markets he uses — Micro Nasdaq, which he says he trades most, and the Micro E-mini S&P 500, which he says draws the most questions — as one approach applied twice (5:55–6:06).
His own account of what the recording is
The recording pulls against its own title in two directions, and the transcript shows both. The title says “live trade execution”. He states that the price action is real rather than a replay — “always real live price action, never market replay” (4:28), repeated at 10:44 and again at the end (17:03). But he also says plainly that it is a demo trade (4:50) and calls it “a paper trading example” (14:01).
Those are not the same claim. “Not market replay” speaks to where the price data comes from: a live feed rather than a replay tool. “Demo” or “paper” speaks to whose money is behind the position. A recording can use a live feed and still contain no funded order, which is what he describes here. Between 14:01 and 15:15 he adds his own compliance framing: he says he is in the United States, names the Commodity Futures Trading Commission, and says he is not a regulated trade advisor, not licensed to give trade or financial advice, and operating under the umbrella of paper trading. The transcript renders one abbreviation there as “CFT”, which in context is presumably CTA.
What the recording does not establish
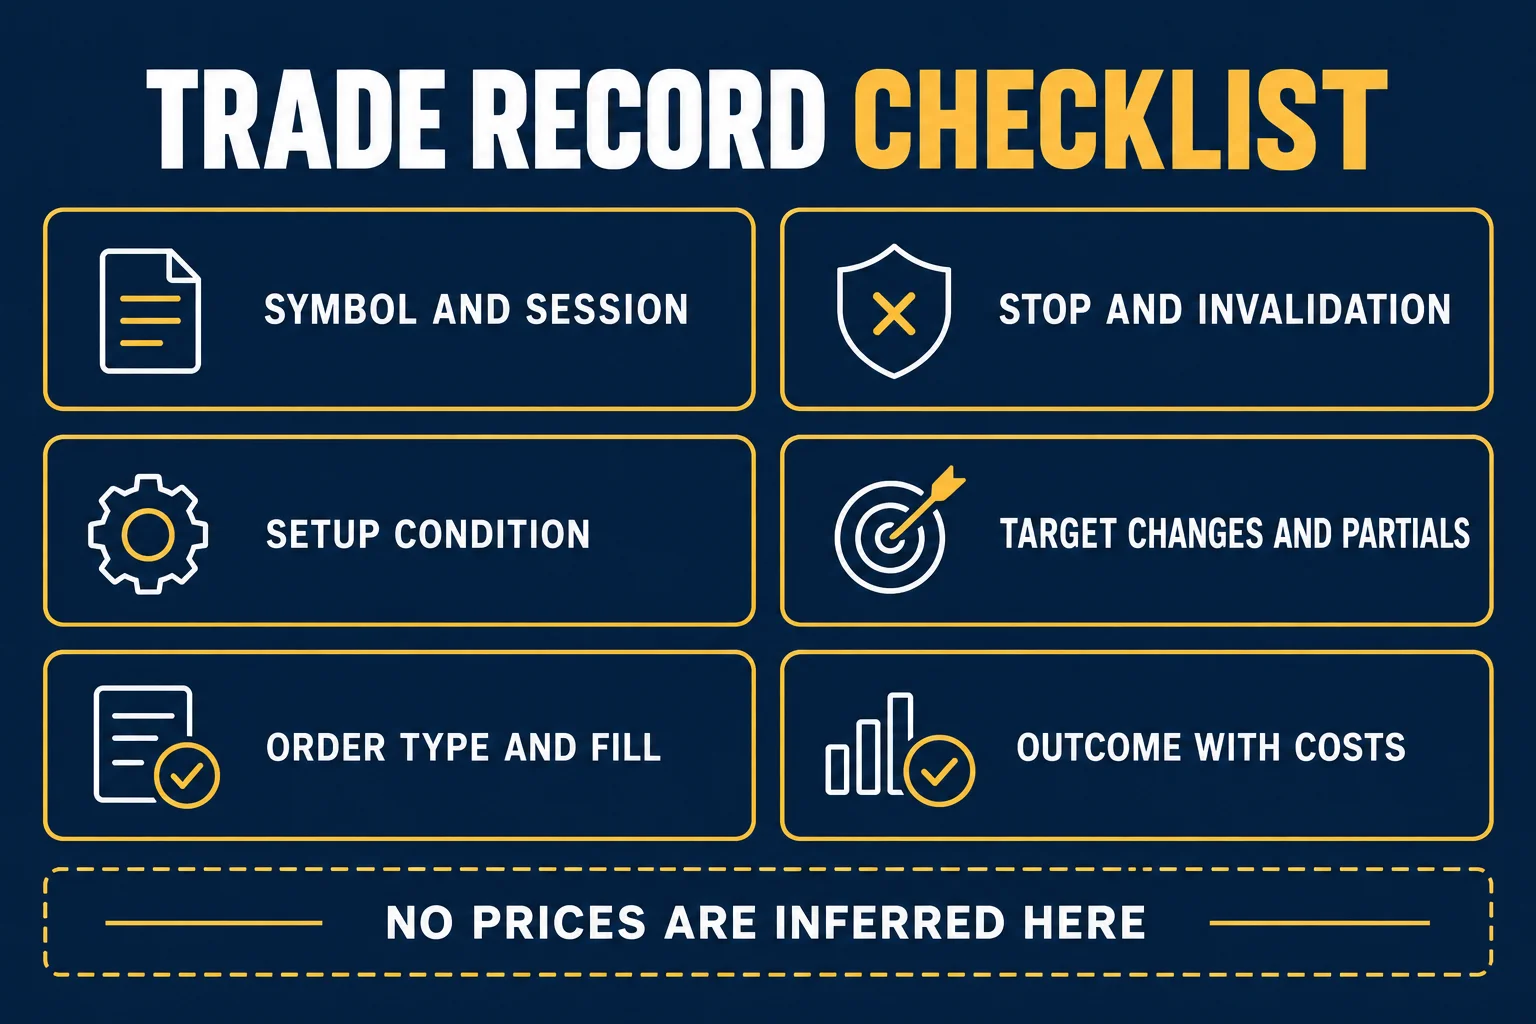
- No fill record. Nothing in the audio shows an order ticket, a fill price, a contract count, a broker statement or a closing result. The dollar amounts he mentions are his own descriptions of hypothetical stop exits on a demo position.
- No price levels. Every level he refers to is relational — a wick, a candle’s low, a short-term high, the day’s high, the gap from Friday’s settlement to the 9:30 open. Without the chart, none of them converts to a quoted price, and this article asserts none.
- Transcription limits. The transcript is automatic, so specialized terms can be misheard; the two places where the wording was unclear are flagged above.
- No verification of the chart. The candles, annotations and order lines on screen were not examined for this article, so no claim is made about what appears there, including where any entry was actually marked.
- His interpretation, not causation. Liquidity, order blocks and pushing out traders who are already short are his model of why price moved. The transcript cannot establish why any participant acted.
- One session is not an edge. A single narrated demo sequence, favourable or not, says nothing about the reliability of a strategy or about what another trader would achieve.
Watch the original recording
This article draws on the timestamped automatic transcript of the mapped recording. The transcript carries the speaker’s words, not his chart, so the recording itself remains the place to follow the annotations.
Watch the original lesson on YouTube
This video cannot be played inside another website: when the embedded player was opened from a bestprops.com origin and clicked on 14 September 2026, the player itself reported “Playback on other websites has been disabled by the video owner.” and settled on a “Watch on YouTube” prompt with no duration and no playback progress. That is why no embed is reserved here and no frame is left blank. The recording is available directly on YouTube.
Watch ICT 2026 Micro Emini S&P 500 Live Trade Execution March 09, 2026 on YouTube ↗
Primary source and further reading
- [1] The recording: ICT 2026 Micro Emini S&P 500 Live Trade Execution March 09, 2026 — The Inner Circle Trader (the primary source; the timestamp links in this article open each moment in it. Watch page metadata read for this article: public, not unlisted, not private, published 9 March 2026, runtime 1,037 seconds).
- [2] CME Group: Micro E-mini S&P 500 Index Futures Contract Specs (the exchange’s own product page: the contract is quoted at $5 × the S&P 500 Index with a minimum fluctuation of 0.25 index points. That is the instrument-side check on the “$5 per handle” figure he uses, and it shows a full index point to be four ticks. Contract specs are exchange facts, not evidence about this session).
- [3] 17 CFR 4.41 (eCFR) (the CFTC rule text on advertising simulated or hypothetical performance, which states that such results do not represent actual trading. It is the regulatory backdrop for treating a paper-trading example as an illustration rather than a performance record; this site is not the speaker’s publisher and makes no claim about his compliance).
- [4] BestProps: Drawdown Rules Explained (this site’s own explainer on balance-versus-equity reference points and static-versus-trailing thresholds. It is illustrative rather than a firm’s rule document, and it is the reason a demo exercise cannot be read as evidence that a funded account could hold the same position).
BestProps is not affiliated with The Inner Circle Trader, CME Group or any prop firm, and no source listed here endorses this article or this site. ICT terms used on this page — liquidity, fair value gap, inversion fair value gap, order block and consequent encroachment — are descriptive study language for third-party educational concepts; none has been tested first-hand by this site and none is presented as official, validated or free of repainting. No trade, fill, size, price, profit or loss is reported anywhere on this page except the speaker’s own stated hypothetical figures, which are attributed to him and presented as contingent. Nothing here is investment advice or a recommendation to trade futures, and nothing in futures trading is without substantial risk of loss.