How we researched this article
BestProps used document-based research from primary firm sources, checked September 14, 2026. The complete source list, scope, limitations, and commercial-state record appear near the end of this article.
In Focus On Forex & Index Futures September 29, 2025, published on Monday 29 September 2025 at 12:37 p.m. Pacific time and running 23 minutes 19 seconds, ICT works through the US dollar index, EUR/USD and GBP/USD on daily and five-minute charts, then turns to the December E-mini Nasdaq-100 contract on a daily chart and a one-minute regular-trading-hours chart. He opens with “Happy Monday… This is September 29th, 2025” and says this is the first review where he is focusing on forex (0:11).
The lesson is a chart-reading exercise rather than a trading plan. ICT repeatedly asks viewers to reproduce each annotation on their own charts instead of relying on his (0:52), and he does not state an entry, a stop, a position size or a result for any of the markets he reviews. The terminology, levels and market readings below are his; the transcript records what he said, not what the charts showed or what happened afterwards.
Source note: this page is grounded in the timestamped transcript of the recording linked below — automated speech recognition of its full audio (local Whisper large-v3-turbo), not YouTube captions. The recording is a screen-share chart review, and no chart imagery was available to the reviewer, so timestamp links point to what the speaker says rather than to independently verified levels or candle boundaries.
Dollar index: a premium wick, then the middle of a range
ICT begins with a daily premium wick that he grades with internal levels, and he explains why he picked that particular candle: it is the tallest one on the chart, with gradient levels drawn across it (0:58). He says the market rallied off an inversion fair value gap that he had called “before it even formed” (1:06), and that the retracement lower followed his Thursday X post telling readers to be content and not to look for anything further on the upside (1:17). Friday, he says, was an inside day with downside follow-through (1:26).
The levels he quotes are 97.937 for the consequent encroachment of the premium wick, which he draws in red to distinguish it from the blue level, 98.012 for the upper quadrant of that wick, and 97.786 for the low of the wick on the candle he is working from (1:39, 3:28, 4:04). He describes Asia and London opening with minor buy-side liquidity and relative equal highs (1:47), then a sell-side imbalance / buy-side inefficiency taking out sell-side liquidity (2:04), with stops accumulated below on the opening kill zone before a rally and a shift in market structure back into an inversion fair value gap that he re-reads as a bullish price-delivery array (2:15). He notes that the candle bodies largely respected the consequent encroachment rather than closing beyond it (2:28).
After the rally attacked the Asian and London-open buy-side liquidity (2:39), price traded into an inefficiency, broke lower into what the transcript renders as a “SIBI” — his shorthand for a bearish fair value gap in this passage — and returned up to the 98.012 upper quadrant (3:12). It then broke lower aggressively and he switched to grading the opposite, discount wick (3:47), with price reaching 97.786 on the close of the session he is reviewing.
His conclusion on the dollar index is about location rather than direction. He says the market is consolidating inside a large high and low, that price is in “no man’s land” where it becomes a fifty-fifty proposition (4:36), and that this is the point at which he is hands-off rather than looking for a forex position (4:52).
EUR/USD: quadrants, breakers and a return into an old imbalance
The EUR/USD section starts at 4:54 with a daily chart on the left and a five-minute chart on the right. He says an old buy-side imbalance was not shaded correctly in his Thursday review and that he had deliberately kept it green, and that price is now drawing back up into it (5:09). He also explains part of his method: the white lines grade one candle’s high and low, he shows only the upper and lower quadrants rather than the high, low and midpoint, because the dashed drawing tool already marks the midpoint of the rectangle (5:31).
He then walks through the sequence: sell-side liquidity from the Asian session, relative equal highs into the London open kill zone, a move down attacking the sell side inside a bullish fair value gap where the lower quadrant was overshot slightly while the bodies stayed in the upper half, which he reads as bullish (6:19), a return into a sell-side imbalance, a break lower, and a rally that hit the upper quadrant of the inefficiency (6:52). He describes anchoring a Fibonacci-style tool to the low of that fair value gap — from one candle’s high to the next candle’s low — and says the upper quadrant was hit “dead bang on” (7:05).
For the upside, he points to a buy-side imbalance that formed after a shift in market structure and to a breaker he describes as a low, a high and a lower low (7:15). When that low is taken out, he explains, the same structure is read in the opposite direction as a bearish breaker (8:20). He follows the rally up into an older buy-side imbalance that he now treats as an inversion fair value gap (7:44), a dip into a bullish order block, and a rally that fell just short of the upper quadrant at 1.17550 (8:00). Price then broke lower again with the bodies staying in the lower half of the old daily gap before returning to an older inefficiency (8:09).
Two attributed claims are worth separating from the chart description. First, he says that when highs are being made you should look for a buy-side imbalance / sell-side efficiency because those will act as inversion fair value gaps “about 80% of the time” (8:51). No sample, period or test method is given anywhere in the recording, so that figure is his own estimate, not a measured statistic. Second, he suggests that a reversal-pattern trader uneasy about selling above old highs can instead wait for price to return into the inversion fair value gap and place a stop there rather than far above the high (9:09). Immediately afterwards he criticises traders who run 20 or 30 contracts on funded accounts, calling that over-leverage rather than trading (9:26).
GBP/USD: discount wicks and a change in the state of delivery
Cable begins at 10:05, and it includes one of the more useful admissions in the recording: he says he does not know where one of his annotations is anchored and suspects he cut it off, telling viewers to look at their own charts to work out what it should be (10:24). He also describes a gap between two candlesticks’ high and low that he says is not annotated on his chart at all but is worth being mindful of (10:50); the transcript renders his word for it as “civvy”, so the term should be checked against the recording.
He explains how the visible levels were built: the thicker dark lines are the gradient levels of one discount wick on the daily chart and the thinner lines belong to a different discount wick, and the price labels on the chart are what let you verify which is which (11:00). In the London session he identifies a sell-side liquidity pool, a rally, a break lower through a sell-side imbalance plus a breaker, and a bearish fair value gap whose consequent encroachment price wicked through while leaving a small portion unfilled (11:46). He says price then hit the consequent encroachment of the discount wick at 1.34248 perfectly (12:12), retraced into the buy-side imbalance with bodies staying in its upper half, and ripped through the buy-side liquidity into a discount wick whose low he puts at 1.34534 (13:07).
The concept he spends the most time on here is what he calls the change in the state of delivery. He identifies the last closed candle before price traded lower and treats its opening price as the reference, insisting it is not a demand zone, not a buy zone and not an engulfing candle (13:30). His practical instruction is to find where price was travelling in a direction and then rotated, take the last reference point from that interval — on the five-minute chart, that opening price — and carry it forward (14:10). He adds his own interpretation that high-frequency systems begin looking for shorts once that level is reached and price breaks lower through an inefficiency (14:31); the recording offers no order-flow evidence for that claim.
He then describes price digging through the inefficiency, ramping through a small fair value gap, failing to reach the consequent encroachment, and reaching a low during the London close. The transcript renders that low as “1.04166”, which is almost certainly 1.34166 given the 1.34xx levels quoted around it; he describes it as the low of that candle’s discount wick or of the day itself, and says the market then consolidated for the rest of the session (15:02).
December E-mini Nasdaq futures and the regular-hours opening range gap
He moves to index futures at 15:19, naming the December mini NQ, or E-mini December contract, and setting up a daily chart beside a one-minute chart configured to show regular trading hours so that the gap between Friday’s regular-session close and Monday’s 9:30 a.m. Eastern open is visible (15:36).

He refers viewers back to his X posts from the previous week, where he says he flagged a discount wick to grade and a fair value gap to watch, and tells them to read the posts themselves rather than be hand-held (15:50). He says price then traded down into the upper quadrant inside that fair value gap, leaving a small portion between the low and that candle’s high open (16:24), and he jokes sarcastically that a meme post timed with the level proves nothing more than that he “got lucky” (16:47). He then splits that wick in half as the consequent encroachment and says Friday traded down into it “beautifully” at 24,529 before rallying back up (16:54).
Friday was an inside day — Thursday’s high and low containing Friday’s high and low — and he says that inside days, combined with the directional hint he had given, are usually indicative of continuation and can be explosive in the direction of the bias (17:19). He notes that the regular-hours opening range gap was large while the separation from the 6 p.m. Sunday open was not, because price had already travelled through Asia and London before the 9:30 a.m. open (17:38).
From there he walks the session: price rallied immediately and created the first presented fair value gap and another before doing business higher up (18:17), then broke down through a potential shift in market structure that he says turned the level into an inversion fair value gap — but he stresses that price spent a long time inside it, which he calls time distortion, luring longs in before rolling over (18:55). A bearish reclaimed fair value gap and a break lower followed before price traded back up into the consequent encroachment, where he says he wants to see the level fail to be touched if the read is bearish (19:07). The first presented fair value gap had been a buy-side imbalance, so trading down through it converted it into a bearish inversion fair value gap (19:28), and price went on to take the sell side below the low of the regular session so far (19:52).
Price then drew into that liquidity, consolidated, and began working from the opening range high, which he says is the actual opening price, before creating relative equal lows and highs (20:05). It ripped lower through the upper quadrant and fell short of the consequent encroachment of the opening range (20:17). At this point he corrects himself: he had briefly confused the opening range gap with a premium wick level, and the level he settles on is 24,816, the high of a premium wick, which he says price returned to (20:38). He notes that the chart image in the recording was captured at 2:00 p.m., that the area looked “a little too smooth”, and that if price rotates lower he would deal with it in the next session (21:12).
Risk remarks and what the session does not show
His closing remarks are risk commentary. He says many participants want to be short with stops stacked above, which he argues makes it easy for price to push up into them (21:30), and he tells inexperienced traders to avoid being short in a market trading at all-time highs because repeated attempts to sell into it can be punished (21:45). He then asks what price reaches for, pointing to a small reference above the old high in electronic trading hours and an older area of order flow, and says price gave up and returned to the 24,816 premium wick high (22:07). He calls it a tricky day and mentions that he worked with a trader called Caleb, who he says did some trades around the first presented fair value gap (22:41).
That is as far as the evidence goes. No entries, stops, position sizes, fills, costs or account results are stated for any market in this recording, and the Nasdaq chart is an in-session snapshot taken at 2:00 p.m. rather than a settled close, so nothing here can be scored as a completed or profitable trade. The “about 80%” remark about inversion fair value gaps is the speaker’s estimate with no supporting dataset. The transcript is automated speech recognition, so the terms it garbles — “consequent encouragement” for consequent encroachment, “civvy” for the gap he describes between two candles, and the “1.04166” low discussed above — were normalised only where the surrounding levels make the intended reading clear, and are otherwise flagged in place.
Turning a review like this into notes
The recording is built as homework: ICT names the levels he is grading but asks the viewer to reproduce the markup rather than copy it. A short note template keeps that exercise honest and keeps forex and futures separate, which matters because the two groups differ in trading hours, contract structure and price increments.
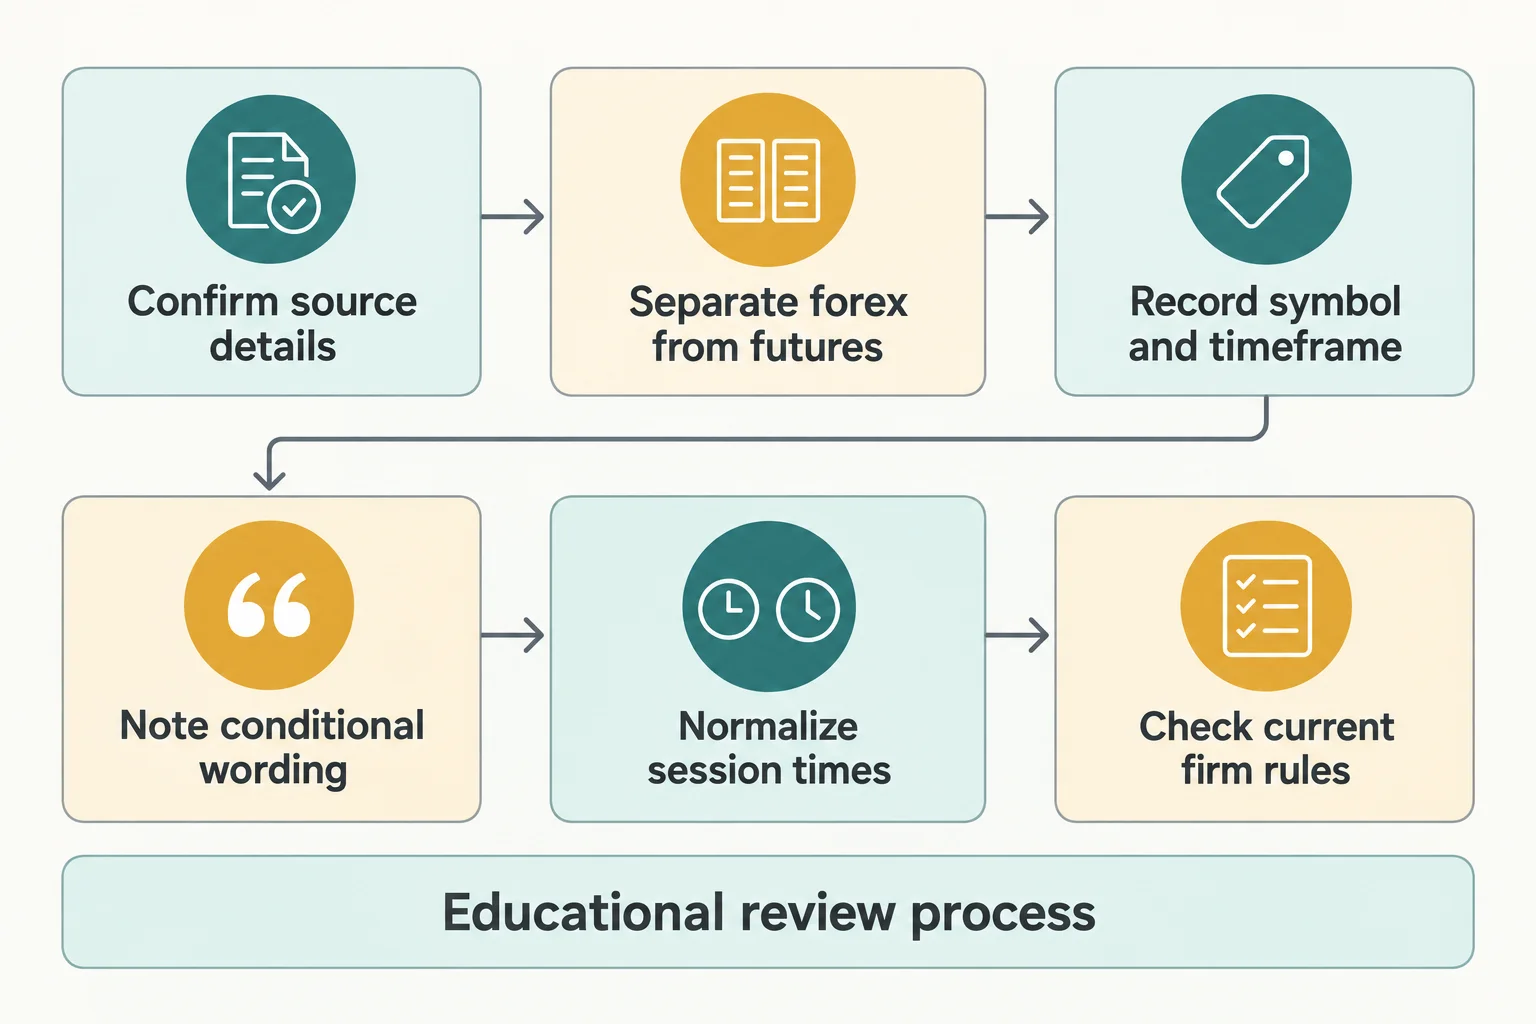
- Source and date. This page concerns the first-party upload of 29 September 2025; the recording itself states the date at 0:11, so title and content agree.
- Keep the markets apart. The dollar index, EUR/USD and GBP/USD section rests on foreign-exchange sessions; the Nasdaq section rests on regular trading hours at the futures exchange.
- Record symbol and timeframe. ICT works from daily context into five-minute and one-minute charts, and the level he quotes for a market is only meaningful with that timeframe attached.
- Note conditional wording. Much of the commentary is conditional — “if it rotates lower, we will deal with it”, “you want to see it fail to touch that if it’s bearish” — so a note that turns these into predictions changes the meaning.
- Normalise session times. Asia, London open, New York open and the 9:30 a.m. Eastern regular open are references to his own chart templates; a session boundary is a chart setting, not a shared fact.
- Check current firm rules. His own leverage warning applies most directly to funded accounts, where permitted instruments, loss limits, news restrictions and holding rules are set by the firm and change over time.
Watch the original lesson
This article draws on the automatically transcribed English audio of Focus On Forex & Index Futures September 29, 2025 (1,399 seconds, 23:19). The transcript is a source for the speaker’s words, not independent proof of the chart work, the levels or any result.
Watch the original lesson on YouTube
The video cannot be played inside another website: when its embedded player was opened and clicked on 14 September 2026, the player itself reported a video player configuration error with error code 153 and settled on a “Watch video on YouTube” prompt, with no duration and no playback progress reported. That message is the reason no embed is left blank here; the recording itself is available directly on YouTube.
Watch Focus On Forex & Index Futures September 29, 2025 on YouTube ↗
Primary source and further reading
- Focus On Forex & Index Futures September 29, 2025: the primary source, on the channel The Inner Circle Trader. Its watch page was read on 14 September 2026 and reported a publish and upload time of 2025-09-29T12:37:17-07:00, a runtime of 1,399 seconds, a view count of 68,740, public non-unlisted availability, and no live archive. The timestamp links above jump to the passages they summarise.
- The first-party post that links to the recording (read 14 September 2026): attributed to @I_Am_The_ICT, titled “Focus On Forex & Index Futures September 29, 2025”, and pointing to the same video identifier as the upload mapped to this article. ICT refers to these weekday posts repeatedly in the recording, so they are cited here as the material he is pointing viewers back to.
- BestProps: prop firm rules (read 14 September 2026): this site’s rule tracker states that prop firm rules are “the account conditions traders must follow to pass an evaluation, keep a funded account, and request payouts”, and lists daily loss limits, maximum drawdown, trailing drawdown, consistency requirements, payout buffers, news trading, weekend holds and position limits as the areas that usually catch traders out. It is cited for the funded-account risk point above, and firms control their current wording.
- NinjaTrader Support: Trading Hours Templates — Desktop (article updated 14 August 2026; read 14 September 2026): the charting documentation states that trading hours templates “dictate the session start and end times for an instrument displayed on a Chart” and that a template’s time zone and session start and end times are editable. It is cited for why a London-open or 9:30 a.m. Eastern reference is a chart setting rather than a shared fact, not for any level discussed above.
Method note: captions were not available for this upload, so this article was written from the automatically transcribed English audio of the full recording (local speech-to-text, Whisper large-v3-turbo). That transcript is a rendering of speech, not a verified document, and it garbles some specialist vocabulary — for example “consequent encouragement” for consequent encroachment, “SIBI” used for a bearish fair value gap, “civvy” for a gap between two candlesticks, and a cable low printed as “1.04166” that reads as 1.34166 within a 1.34xx series. The reviewer did not see any chart in this recording, so every level and quadrant reference above is quoted as spoken rather than confirmed against the screen.
This is independent educational commentary on one dated market review. It is not official ICT material, not a transcript, not a tested trading system, not investment advice, and not evidence that the approach described produces the results the speaker reports. BestProps is not affiliated with The Inner Circle Trader, YouTube, X, NinjaTrader Group or any prop firm, and no source listed here endorses this article or any setup. Terms such as liquidity, displacement, market structure, fair value gap, inversion fair value gap, breaker, consequent encroachment and change in the state of delivery are used on this page only as descriptive study terms from the general ICT vocabulary; none is presented as official, tested or free of repainting, and nothing here has been replayed, backtested or measured.