Key takeaways
In Futures Market Commentary June 18, 2026 (The Inner Circle Trader, 21:21), ICT runs a deliberately short higher-time-frame review rather than publishing trade signals.
Read the full summary
In Futures Market Commentary June 18, 2026 (The Inner Circle Trader, 21:21), ICT runs a deliberately short higher-time-frame review rather than publishing trade signals. He revisits a bullish US dollar index idea from his June 7 commentary, reads EUR/USD and GBP/USD as bearish order flow, describes crude oil as the mirror image of the dollar and says the downside objective he had pointed to there was reached, observes that continuous ES and NQ had printed higher highs while the expiring June and front-month September contracts had not, and applies his “event horizon” targeting idea to Bitcoin. The reusable lesson is process: finish analysis on the monthly, weekly and daily charts, mark liquidity and inefficiencies, compare objectives by how far price has to travel, and treat every level as an idea rather than a requirement.
How we researched this article
BestProps used document-based research from primary firm sources, checked September 14, 2026. The complete source list, scope, limitations, and commercial-state record appear near the end of this article.
This page is a plain-language summary of what the recording says, organised so a reader can check each point against the video. It is written from the automatically transcribed audio of the full original recording, not from YouTube captions, and no chart in the video was reviewed. Numbers, terms and any visual detail therefore come with the caveats noted below, and nothing on this page is a verified fill, a verified result or a recommendation to copy any idea in the commentary.
ICT opens by saying he does not have much time this afternoon and will get through the material “as succinctly as possible”, then frames the session as a brief follow-up to a review he gave on Sunday, June 7 (0:10). He also warns that he may not be able to record the next day’s commentary. Before closing he says he intends to rest over the weekend and get back to lectures and lessons after that (21:11).
Higher-time-frame analysis as the starting point
The session begins with a recap of the dollar-index view he had already published. He describes how price had interacted with a volume imbalance, where the buy side sat above the market, and how the market rallied from the midpoint of an inefficiency that he describes as behaving like a sell-side imbalance / buy-side inefficiency — a SIBI in his terminology — and later as an inversion fair value gap (1:41). He adds that trading back through the midpoint, or consequent encroachment, of an inefficiency can still be permissible inside his framework, and that he would have preferred the market to leave part of that gap unfilled.
The broader teaching point arrives at 5:12: he says analysis should be finalised on the higher time frames — monthly, weekly and daily, with particular weight on the daily — and that deciding where a market is likely to go from there is what lets a trader narrow daily and session bias. He contrasts this with intraday requests he says he has been receiving for years, and notes the trade-off: higher-time-frame ideas take time to play out, so he deliberately leaves viewers to watch them rather than trying to call every intraday swing.
He repeats throughout that these are ideas, not requirements. At one point he tells viewers not to be “hard and fast” about whether a market reaches a level before the end of the week.
EUR/USD and GBP/USD: bearish order-flow interpretations
Turning to the euro at 3:11, he points to nearby lows as a minor sell-side liquidity pool and describes a further drop as his “best case scenario” for the short term rather than his long-term view. His practical instruction is aimed at traders already short: he says he would be inclined to take considerable profit at that nearby pool and then treat the next level as another partial. He stresses that this is short-term trading of volatility, inefficiencies and higher-time-frame liquidity, not a longer-horizon euro call.
Directly after the euro remarks and before the pound-dollar review, he walks through a chart without naming the market aloud in the recording. On that chart he points out an inversion fair value gap, says the candle bodies never returned to consequent encroachment, calls the read “bearish” and “algorithmic”, and describes strong displacement below relative equal lows (5:50). The transcript alone cannot establish which instrument that chart was, so nothing on this page attributes it to a specific market.
The pound-dollar review starts at 6:35. He again describes bearish order flow: price traded outside an inversion fair value gap, broke down from it, retraced back toward an imbalance, and then worked lower. He applies the same rule he uses elsewhere — a bullish imbalance or inefficiency should act as an inversion fair value gap — and notes a heavy sell-off after a failed attempt to trade up. He links the pound and euro readings to his bullish dollar view, describing a “teeter-totter” effect in which the dollar index rising pressures cable and crude oil (8:21).
Two timing cautions stand out. Because the next session was a Friday, he tells shorts not to be greedy and to accept a partial move below the nearer pool, and he says a gap below the referenced low on Sunday would be a welcome development but that reaching it before the end of the week is not required for the idea to be valid.
Choosing a realistic liquidity objective
The most transferable segment of the recording is his method for choosing between competing downside levels. At 9:34 he explains that on a daily chart he wants to know which referenced low is easiest for price to reach, and that if the bearish idea requires less travel to a nearer pool, the nearer pool is the more realistic objective. He calls this a “low-hanging fruit” objective built from the same concepts he teaches, and says it helps decide when to take an idea seriously and when to leave it alone.
The sequence he describes is straightforward:
- Start with a directional hypothesis formed on the higher time frame.
- Mark more than one plausible liquidity pool, not just the most convenient one.
- Compare how much range price has to cover to reach each pool.
- Prefer the nearer objective where conviction or time is limited, and treat it as conservative rather than certain.
- Reserve distant objectives for cases where the analysis genuinely supports allowing more room.
He also mentions toggling chart displays on and off to make volume imbalances easier to see. Because the recording is summarised here from audio rather than from a visual review, that chart operation is described only as he narrates it — the exact boundaries of the areas he marks should be checked in the video.
Crude oil: separating price delivery from headlines
He moves into crude oil at 8:46, describing it as broadly the opposite of the dollar index and therefore part of the same framework. His read is that a return into what he calls a sell-side imbalance / buy-side inefficiency, or “pseudo volume imbalance”, should be viewed as bearish, that candle bodies failed to reach the midpoint of that area, and that price then displaced lower (10:57).
He then contrasts that chart reading with the news cycle. His stated interpretation is that public comments about escalating action against Iran were accompanied by a higher oil price for traders to chase, and that his dollar and crude-oil analysis pointed the other way, which is why he says he told readers to “fade” that move (11:51). This is ICT’s own market interpretation of a headline-driven move. It is not independently established that any headline was intended to move prices in a particular direction, and the transcript does not establish why crude oil actually traded as it did.
He frames the size of the move he had been describing as a range from roughly 92.50 down to about 74 and puts that at close to $20,000 per contract (13:48). Treat those figures as his spoken approximations from an automated transcription: the closing print, the exact high, his position size, whether he held anything and any realised result are not established anywhere in the recording. He does say he was satisfied with the crude-oil sequence and that a previously referenced low had been cleared, adding that the move need not have happened on a closing basis.
ES and NQ: contract selection matters
He turns to the equity indices at 14:59. On ES and NQ he says the continuous charts had made higher highs, while the expiring June contract and the front-month September contract he compared did not show the same higher high (16:04). He states a preference for trading the front month and names the quarterly index-futures month codes he uses: H for March, M for June, U for September and Z for December (16:49).

The educational point is that a continuous series and a specific delivery month are not interchangeable. Rollover construction, data feed and contract choice all affect the highs, gaps and session boundaries a trader sees, so two screens can disagree while both are correct for the settings they use. That is also why an archive record of any commentary should name the contract month next to the ticker.
His conclusion was that the continuous-contract structure supported another push higher, and he referenced a new all-time high on the September NQ contract at 31,100 (18:10). He qualified it immediately: he says he is not comfortable promising it before the close of the week, that a gap higher could make it difficult to participate without holding over the weekend, and that if the market failed there he would not treat that failure as the final high. No outcome is established by the transcript, which ends before any of it could be resolved.
Bitcoin and the event-horizon concept
Bitcoin is the last market he covers (18:47). He says price failed to reach a nearby imbalance before selling off, notes relative equal lows and a fresh sell-side area, and then applies what he calls his event-horizon concept: an old low acts as the first reference, with lower pools of liquidity becoming subsequent targets (19:47).
He reads two candlestick highs in the 67,418 and 67,253 area and says the market never reached the imbalance above them (19:11), then hesitates over a lower target that lands near 54,333 (20:22). The Bitcoin figures are the weakest part of the transcript: the digits come from automatic speech recognition and he audibly hesitates and corrects himself while reading one level. Check those exact numbers on the video before reusing them.
Reviewing this commentary against your own charts
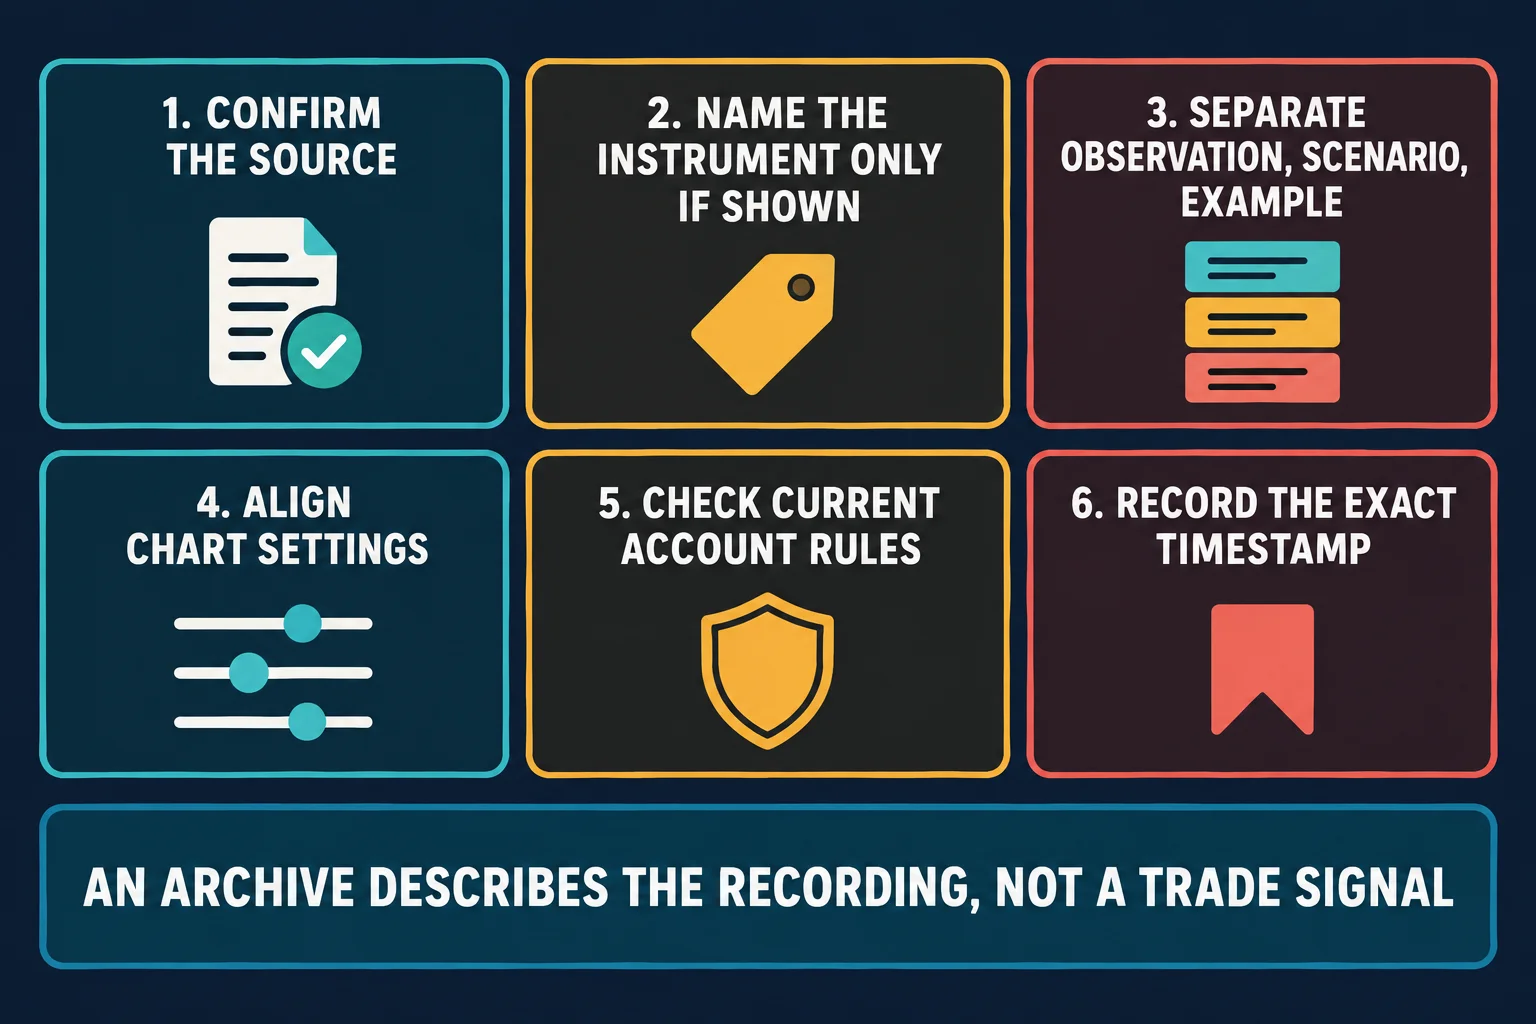
The steps above are the reviewer’s checklist this page has followed, and they matter more than usual here because the recording is a spoken review of charts. Four habits keep a review honest:
- Name the instrument only when the source does. Where the commentary does not say which market a chart belongs to, the correct note is that the market is unstated — not a guess based on the order in which markets were discussed.
- Separate observation, scenario and execution example. A description of price that has already traded is not the same as a conditional path, and neither is the same as an entry, stop or target discussed as a teaching example.
- Align chart settings before comparing anything. Contract selection and rollover construction change the highs and gaps visible on a daily chart, and session templates and time zones change where a session begins. Time-zone reference data is revised over time, so a written offset is more durable than a local clock time.[3]
- Check your own account rules before testing an idea. News windows, permitted products, trading hours, position and loss limits, consistency requirements and holding rules are set by the firm or platform and change — the wording that applies is the one published for your account, not a general description.[4]
Related ICT video: Futures Market Commentary June 18, 2026
The recording this article summarises is Futures Market Commentary June 18, 2026 from The Inner Circle Trader, published 18 June 2026 with a runtime of 21:21. Its title, channel, publication date and runtime were read from the watch page, and the player was tested: the page is public, and the embedded player renders a video player configuration error carrying error code 153 with a prompt to watch the video on YouTube instead of playing, so it cannot be embedded here. This article is a summary of that recording’s spoken content; the video remains the only place to see the charts and to settle the figures flagged above.
Watch the original recording on YouTube
The embedded player renders a video player configuration error (error 153) with a prompt to watch the video on YouTube instead of playing, so the recording cannot be played inside this article. The same surface appears when the player is tested directly. Open the video on YouTube to review it yourself.
What this summary does and does not claim
Every substantive point on this page is taken from the timestamped recording and reflects ICT’s own statements and interpretations. The transcript used is a local automatic speech transcription of the full original audio, not human-verified captions; it carries a provenance header and it was produced without any review of the charts on screen. Where the speaker’s terminology is inconsistent in that transcription — terms such as SIBI, volume imbalance, fair value gap, consequent encroachment and inversion fair value gap — the wording was normalised only where the surrounding explanation supported it, and the Bitcoin figures are flagged as unresolved.
The recording does not establish any trade entry, fill, position size, stop, risk control or realised result. Nothing here should be read as evidence that the ideas described were profitable, that any level predicted anything, or that a reader should copy a stated bias. The transcript also stops before the markets resolved, so no claim is made about what happened afterwards, and references to June 2026 market events or headline context are reported as the speaker’s framing rather than independently verified facts.
On third-party ICT and SMC indicators: any indicator, script or tool marketed as detecting fair value gaps, opening ranges, liquidity, displacement, premium and discount, or market structure on this article’s behalf is an unofficial third-party interpretation. No such indicator is named, linked, tested or recommended here, no result is reported for one, and no claim is made that any of them repaints less, times entries better or would have improved any outcome.
Sources
- [1] YouTube: Futures Market Commentary June 18, 2026 — The Inner Circle Trader (primary source recording; watch page read and player tested, embedded playback returns a player configuration error with error code 153; audio transcribed for this summary)
- [2] CFTC: Basics of Futures Trading (official education on what a commodity futures contract fixes at the time of agreement, including delivery month)
- [3] IANA: Time Zone Database (the local-time and offset data behind chart session clocks, revised periodically)
- [4] BestProps RuleWatch: Prop Firm News Trading Rules (documented news windows, source status and source gaps across firms)
Further reading, unofficial: independent third-party coverage exists for this period of ICT’s output and for June 2026 futures markets in general, for example the ICT Archivist entry for June 22, 2026 and a third-party June 2026 futures recap. Neither of those pages is the source for this article, neither was used to establish what was said on June 18, 2026, and their content, accuracy and any claims they make have not been tested or endorsed here.
BestProps is not affiliated with The Inner Circle Trader, YouTube, the CFTC or IANA, and no source listed here endorses this article, this site or any setup. Nothing on this page claims that any level predicts price, that any session was verified on a live or funded account, or that any approach produces a reliable result, and nothing here is individualised investment advice.