Key takeaways
In Enigma FVG Projections & Protractions & Review | June 27, 2026, The Inner Circle Trader (“ICT”) teaches how he projects objectives out of a fair value gap: he measures the same inefficiency two ways — one from the wick, one from the candle body — and calls the nearer result the “low-hanging fruit objective”…
Read the full summary
In Enigma FVG Projections & Protractions & Review | June 27, 2026, The Inner Circle Trader (“ICT”) teaches how he projects objectives out of a fair value gap: he measures the same inefficiency two ways — one from the wick, one from the candle body — and calls the nearer result the “low-hanging fruit objective” and the farther one the “extreme”. He then projects the measured range forward into what he calls an unrealized dealing range, and works out the midpoint of his two projected levels, the consequent encroachment, which he says lined up with the Dollar Index high he was watching. The lesson ends with a multi-market review of EUR/USD, GBP/USD, gold, silver, oil, Bitcoin, the Dow, S&P 500 futures and Nasdaq futures. Every level, target and dollar figure below is his commentary on charts that are not part of the source used here; no order record or account statement was inspected, nothing here is verified performance, and none of it is a recommendation to copy a trade.
How we researched this article
BestProps used document-based research from primary firm sources, checked September 14, 2026. The complete source list, scope, limitations, and commercial-state record appear near the end of this article.
This page is a review of the recording itself, not of somebody else’s summary of it. Every attributed statement comes from an automatic speech-recognition transcript of the recording’s full audio, so the timestamp links below point at the moment each point is spoken. Because that transcript is machine-generated, ICT-specific terms were normalised to the recording’s own vocabulary only where repeated context supports it — the audio renders “consequent encroachment” as “consequent quarrel” at 2:01 and as “consequence encouragement” at 20:57 — and the places where the audio stays genuinely ambiguous are marked in the text rather than smoothed over.
What “Enigma” means in this recording
He opens by naming his approach “Enigma” (0:18) and says directly what it is not: it is not something that is out there for you to copy or purchase with someone else having coded it (0:26). Throughout the recording it functions as his way of measuring price and anticipating where the algorithm will engage with price delivery, not as an indicator, script or setting list.
The premise he asks viewers to hold for the duration is that price delivery follows algorithmic logic, and that the same logic is implemented in every individual market (4:30, 9:44). That is his interpretation, argued from the repetitions he displays in the lesson; the transcript does not establish it. He also credits the origin of the logic to someone other than himself — “all the glory goes to him” (24:14) — and says he codified how imbalances pair with algorithm price delivery (29:43).
Two ways to measure the same inefficiency
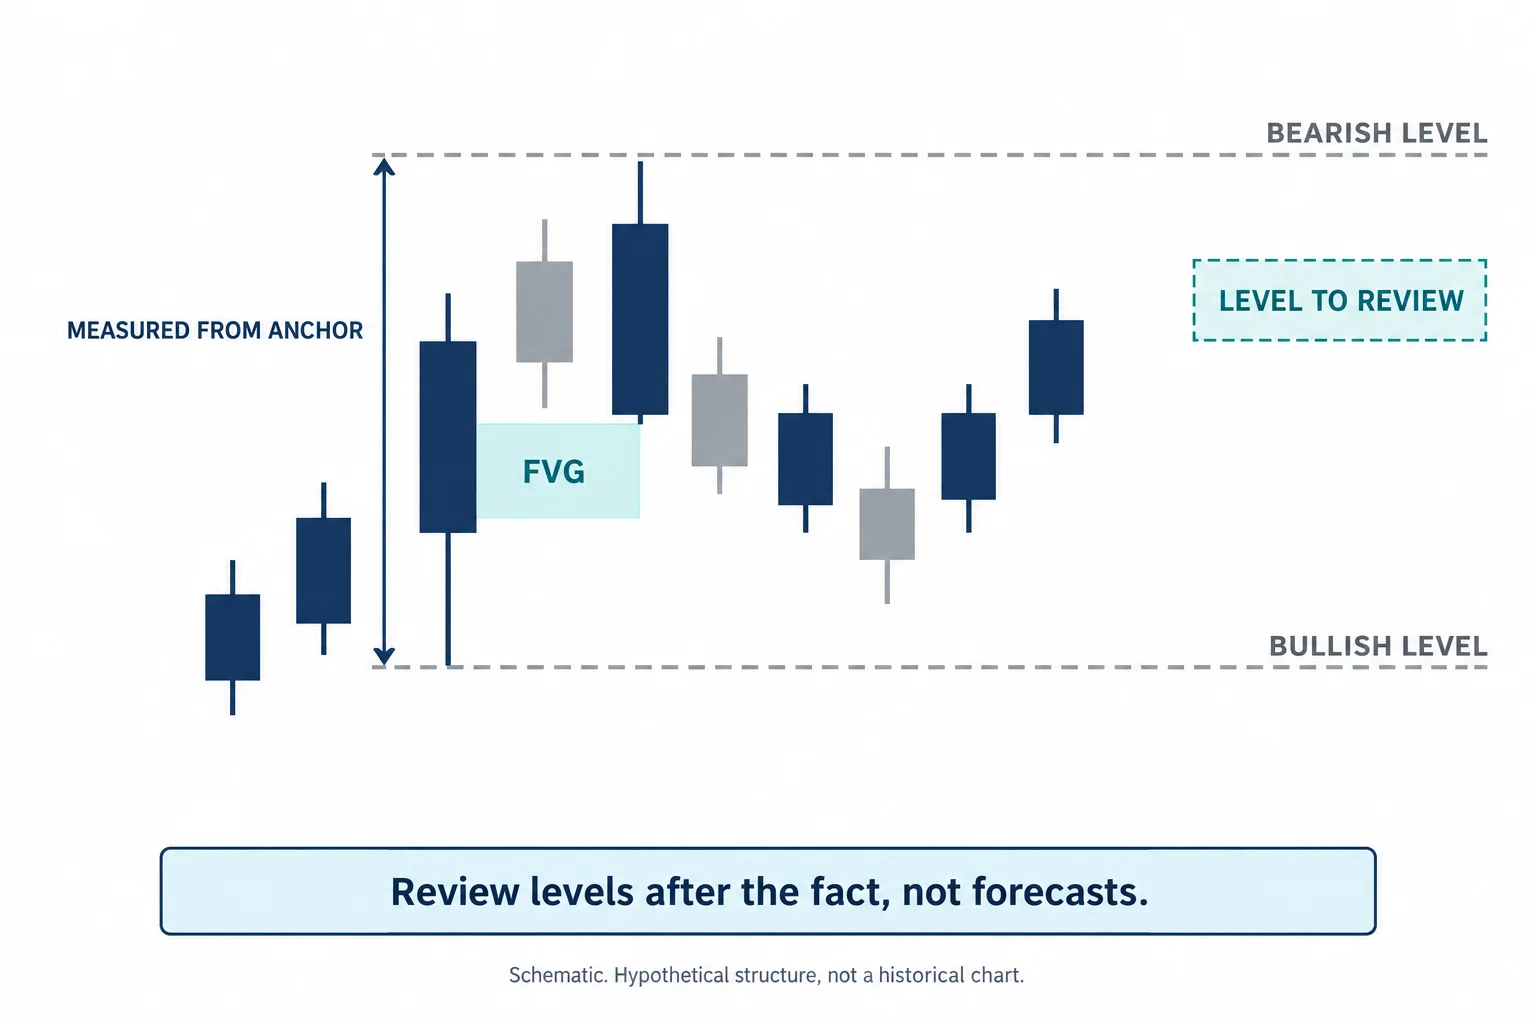
The technical teaching begins around 10:54, where he recalls that when he first taught fair value gaps he did not include volume imbalances and that the imbalance layer came later. He then builds one, step by step. A candle closes at a level the transcript renders as 100.997 (11:57); for a volume imbalance to exist the next candle has to open above that close, and the transcript records 101.005 (12:20), which he calls “certainly higher” and therefore a volume imbalance (12:24). Finally he says he discounts the short-term wick high and measures down to that candle’s close instead (12:41), and that this is what became the fair value gap.
He summarises the point plainly: those are “two measurements” used to define a single inefficiency (13:02) — a wick-based boundary and a body-based boundary. The two boundaries are what later become the two objectives.
Projecting the inefficiency into an unrealized dealing range
The reason for measuring an imbalance twice is targeting. At 13:10 he says the inefficiencies can now be projected into the future to “determine very specific price points in an unrealized dealing range”. He defines the term twice: while price is sitting somewhere during the session, everything above that point that has not yet traded is an unrealized dealing range (17:01) — he also calls it an implied dealing range, and stresses that it means price has not traded there yet, so the idea still has to submit to time (17:59). He then anchors the measurement at the day’s opening price and runs it up to the high, and says the volume imbalance is what gives the clues for measuring it (18:39, 18:46).
Protraction, displacement, and the candle that opens higher
At 16:03 he walks the Dollar Index daily chart through what he calls protraction: the open of the candle starts the run, and he counts it as “candlestick number two in the fair value gap”, so the move reads as a protraction higher and a displacement above prior highs (16:17). He explicitly resists calling that candle an engulfing candle (16:26) and says the candle opened above where the previous one closed, which left a gap he calls an opening range gap (16:36). Two caveats on the wording: the transcript uses “protraction” exactly once in 69 minutes of audio, at 16:17, and the recording never supplies a formal definition of the term beyond that usage; the plural in the mapped title, “protractions”, does not appear in the audio at all.
Low-hanging-fruit objective versus the extreme
The targeting logic mirrors the imbalance logic. He describes teaching an “extreme” first and the “low-hanging fruit objective” second (8:21), and says that when he does measurements for targeting there is a low-hanging fruit objective and then there is the extreme (15:01). In the Dollar Index example he plots a Fibonacci from the body of one candle, which he treats as its opening, up to the low of another candle (20:07), describing that as measuring the point at which the displacement begins (20:14).
He then extends that measured range forward. He refers to a negative 1.25 and a 2.5 (21:11), and says projecting 1.25 forward lands near a level the transcript renders as 101.795, which he calls the low-hanging fruit objective on that measurement (21:42). For the extreme he says he has to use the point at which the day closed, because “the body tells you the story, the wicks do the damage” (22:02), and that measurement returns a level the transcript renders as 101.805 (22:16). He mentions anchoring a Fibonacci from “80 and a half” down to “79 and a half” (22:51), then takes the midpoint of his two projected levels as the consequent encroachment (24:30), says the high came in at 101.8 (24:53), and asks rhetorically what the consequent encroachment level is in answer to his own question: 101.8 (24:58). Earlier in the recording his stated Dollar Index objective was a level the transcript renders as 101.977 (7:22), and he describes consequent encroachment as the midpoint, or “event horizon”, between two pools of liquidity (5:45, 5:57).
Every number in this section is a speech-recognition rendering of what he says while narrating a chart that is not part of the source available here. The transcript cannot confirm the plotted anchors, the Fibonacci configuration he used, or that the high actually printed where he says it did; 101.795, 101.805 and 101.8 are close enough together that machine transcription may not have separated them reliably, and no price feed, chart export or screen recording was checked.
The sequence, in the order he demonstrates it
- Establish a directional premise and a proposed draw on liquidity — in this case the Dollar Index level he says he outlined on 7 June 2026.
- Identify the displacement and the imbalance it left behind, then check whether it is a volume imbalance, a fair value gap, or a range he calls a balanced price range after price has traded through it (31:13).
- Measure the inefficiency twice: once from the wick boundary and once from the body or closing price (12:41, 22:02).
- Project the measured range forward into the unrealized dealing range to get a nearer objective and a farther one (13:10, 21:42).
- Take the midpoint between the two projected levels as the level to watch, and wait to see whether price reacts there.
- Accept that it may not: he says of his own read that it is “not a guarantee” and “not a panacea” (6:11).
He frames this as the process demonstrated in this particular recording, not a complete mechanical system; the transcript does not state every Fibonacci configuration or chart setting that would be needed to reproduce the measurements exactly.
The review portion: Dollar Index, foreign exchange, metals and crypto
He starts by revisiting his own earlier analysis — a video he says he posted on 7 June 2026 (1:37) — in which he had described an inversion fair value gap, an old high as a draw on liquidity, and the halfway point between two liquidity pools. In the live session he is recording, he says he was outlining why it was acceptable to take profits on a short EUR/USD and short GBP/USD position and to be content with the run in the Dollar Index (2:31). He then converts the imbalance from one characteristic to another: a volume imbalance that delivers buy side, then sell side, and is left behind becomes, in his terms, a balanced price range that can be used again through the logic of an inversion fair value gap (31:31).
The market-by-market review runs from about 33:28. EUR/USD is measured from a discount wick, with consequent encroachment above and a target below, and he notes price falling short of one level before repelling away (34:26). GBP/USD is read through an inversion fair value gap, a small gap, and bodies respecting consequent encroachment before dropping toward his target (35:24). Gold gets a target he says was hit on the Wednesday, with an inversion fair value gap and a smaller gap inside it (36:10, 36:26), and silver is shown diving into a low with consequent encroachment hit (37:19). Oil comes next, where he repeats a target he says he gave earlier (37:42).
Then come the figures that need the most care. For oil he says “over $20,000” per contract at the initial target he had given (38:23), and later puts the running total at “over $150,000 in potential demo profits” since 7 June (38:53). For silver he notes he is describing a demo account (36:56). On Bitcoin he says he is not bullish, lists successive targets, and refers to a short he placed and to “25,000 paper bills” (39:16, 40:44). He also says he does not show broker statements (1:03:34). Those amounts are his own retrospective arithmetic on charts that this source does not contain; the words “demo” and “paper” are his, and no statement, fill or profit figure was verified for this page. Treat them as claims about what he says was available, not as evidence of profitability.
Index futures: an imbalance that flips, and the warning attached to it
He compares the Dow, S&P 500 futures and Nasdaq futures, and adjusts for contract rollover before drawing conclusions (41:00). On the S&P 500 he points to a low he says he had already mentioned on X, and explains why the same imbalance could act as an inversion fair value gap: it began as a volume imbalance delivered with buy-side intent, and when price later traded through it the inversion characteristic kicks in and it is treated as resistance (42:22, 43:11). He attaches an explicit warning to that example: it is complicated and more likely to fail, and he says so in advance so that viewers can see why it did not deliver if it does not (43:26). His stated rule from that is that knowing when not to take a setup matters more than finding another one (43:41). The Nasdaq section ends with the condition he wants to see: a close below a specific level before he would expect the level he had outlined to be taken out (47:47).
He references his own posts on X in that section. Those posts were not retrieved for this article — the logged-out shell of a post is not readable first-hand — and the transcript renders the level he says he posted inconsistently, as “28 517” at one point and then as “513” (41:58, 48:23). No specific level from that post is asserted here.
Risk and study takeaways
Two passages in the recording are more useful than any of the price work. The first is when he refuses to be an oracle: “don’t use me as the timing element for you to get in or get out of your trade”, because that makes someone else manage your trade for you (14:36). The second is his loss-control argument: he says the traders who last are not the ones who win a lot but the ones who lose less, and he criticises people who use extreme leverage hoping the outcome lands their way (43:56, 44:24).
He also explains why he teaches on lower timeframes: they produce many more examples to practise on than a daily chart, where practice is limited to one bar at a time, and he says he learned that way himself (27:55, 28:39). That is a pedagogical observation about practice volume, not evidence that lower-timeframe trading is safer or more profitable.
What he says about his own channel
The final section is not a lesson. He says he wants to move away from the ICT persona and start a separate channel, that he suspects his reach is being suppressed, and that he will ask viewers to subscribe to the new channel when it exists (55:21, 58:09, 1:05:16). He also says he does not run affiliate or introducing-broker deals, which is the reason he gives for not having a broker relationship on the channel (1:03:52). These are statements about his own intentions and about traffic he says he observed; nothing in this source corroborates or disproves them, and the article takes no position on them.
Questions readers ask about this recording
Was this session public on June 27, 2026?
Yes. The mapped recording Enigma FVG Projections & Protractions & Review | June 27, 2026 was read on 2026-09-14 from a live browser session: the watch page was public, not private and not unlisted, credited to the channel The Inner Circle Trader, and reported a publish and upload date of 2026-06-27T09:46:58-07:00 with a duration of 69 minutes 9 seconds. That places the recording roughly eleven weeks before this review. Note the difference between the two date facts: 2026-06-27 is the day the recording was published to YouTube, while the trading days discussed inside it are described by the speaker as the previous week’s Monday, Tuesday and Wednesday. Both are stated separately rather than treated as one date.
What is the difference between projection and protraction here?
In this recording “projection” is the act of extending a measured imbalance forward in time to obtain objectives, and it is the word he uses for both the nearer and farther targets. “Protraction” appears once, when he describes a run as a protraction higher off a candle that opened above the previous close. The recording does not define either term formally, the plural in the title does not appear in the audio, and no third-party definition is imported into this page.
Does a projected level guarantee a reaction?
No, and he says so himself: when describing the midpoint logic he calls it “not a guarantee”, “not a panacea” and “not an absolute” (6:11). Each projected level is a reference point inside a thesis that can fail, as his own S&P 500 warning in this same recording concedes.
Can a TradingView indicator replace the lesson?
Not from this source. He explicitly says “Enigma” is not something you can buy or have coded for you, and the recording names no script, no settings and no repainting or accuracy claim for anything. Any script that claims to find these imbalances for you is a third-party author’s interpretation, unofficial and untested here.
Related source video: Enigma FVG Projections & Protractions & Review | June 27, 2026
The recording reviewed above is Enigma FVG Projections & Protractions & Review | June 27, 2026 on the channel The Inner Circle Trader. Its watch page was read on 2026-09-14 and reported an upload date of 2026-06-27 and a runtime of 69:09. Every attributed statement and every timestamp link on this page comes from the automatic speech-recognition transcript of that recording’s full audio.
Watch the original recording on YouTube
This recording cannot be played inside another website. A playback test of the embed markup used on this page, run on 2026-09-14, returned the player’s own surface “Video player configuration error” with error code 153 and a prompt to watch the video on YouTube. That is a setting on the video, not a fault of the reader’s browser, so no player area is reserved here and no blank embed is left behind. The recording itself remains public on YouTube.
Watch Enigma FVG Projections & Protractions & Review on YouTube ↗
Sources for the recording, third-party scripts and risk limits
Four references support this article: the recording itself, YouTube’s own documentation on embedding, the public script library where community indicators are published, and this site’s RuleWatch page on drawdown rules. None of them states a price level, reports a result for any decision described above, or endorses this page.
Start with the recording, not a reupload of it
The mapped upload Enigma FVG Projections & Protractions & Review | June 27, 2026 was read on 2026-09-14: public, credited to The Inner Circle Trader, published 2026-06-27, runtime 69:09, and its watch page reported that external playback is not permitted.[1] That settles the attribution, the date and the playability status of the recording. What it says is taken from its automatic transcript, which is the source of every timestamp link above; no chart shown in it was inspected, and the transcript carries no visual information.
Why this page shows a card instead of a player
Whether a video plays inside a third-party site is decided on YouTube’s side, not by the site embedding it. YouTube documents that embedding is the supported way to place a video on a website or blog — “You can add a YouTube video or playlist to a website or blog by embedding it” — and it also documents that third-party playback can be restricted, for example that “Age-restricted videos can’t be watched on most 3rd party websites” and will “redirect viewers back to YouTube when played”.[2] In this case the restriction was not inferred: the embed was loaded from a BestProps page origin and the player returned its own refusal message, which is why a visible watch card appears here instead of an iframe that would render an error box.
A published script is one developer’s interpretation
The public script library referenced below is a community marketplace, not a specification: its index describes itself as “Trading Strategies & Indicators Built by TradingView Community”, and the entries are individual authors’ published interpretations, some of which explicitly state their lineage, for example a “Mandatory Lineage Notice” reading “This script is an open-source technical derivative and mathematical expansion building upon” another author’s published work.[3] That is the category of software the third-party disclaimer below refers to. No such script is named, tested, recommended or reported on this page, and nothing here claims that any of them detects these imbalances, repaints less or would have improved any measurement described above.
Quote your own account limits, not a generic figure
The recording’s loss-control discussion only becomes concrete against an account’s own rules. This site’s RuleWatch page on drawdown opens with the reason: “Drawdown is the rule that decides how much room you really have”, and it explains that it “compares static, trailing, intraday, end-of-day, daily, and max loss rules across checked prop firm sources so you can spot the rows that can trip you up before you buy or size a trade”.[4] Read your own provider’s current wording and dashboard rather than any summary, including this one; nothing in the recording is a size, a limit or an instruction for your account.
One transparency note: an earlier version of this page linked an X post attributed to the channel and a third-party recap of the same video. Both were removed. The X post could not be read first-hand from a logged-out session, and the recap repeated the same YouTube identifier and title rather than documenting anything about the recording. Nothing on this page depends on either of them, and the source-denial wording that the earlier version used about this recording has been replaced with the transcript-based account above.
On third-party ICT and smart-money indicators: any indicator, script or tool that claims to locate fair value gaps, volume imbalances, order blocks or consequent encroachment on this article’s behalf is an unofficial third-party interpretation. No such tool is named, linked, tested or recommended here, no result is reported for one, and no claim is made that any of them predicts price or reproduces the measurements described above.
BestProps is not affiliated with The Inner Circle Trader or with any charting provider, and no source listed here endorses this article, this site or any setup. Fair value gap, volume imbalance, balanced price range, inversion fair value gap, consequent encroachment, unrealized dealing range, opening range gap, displacement, protraction, draw on liquidity and PD array are used on this page only as descriptive study terms taken from the recording. Nothing here claims that any projected level predicts price, that any described trade was profitable, that any demo or paper figure is a real result, or that the described approach produces a reliable outcome on a live or funded account.
Sources
- [1] YouTube: Enigma FVG Projections & Protractions & Review | June 27, 2026 – The Inner Circle Trader (source recording; watch page read and external playback tested 2026-09-14, automatic transcript used)
- [2] YouTube Help: Embed videos & playlists (embedding as the supported route, third-party playback restrictions; quotes re-checked 2026-09-14)
- [3] TradingView: Trading Strategies & Indicators Built by TradingView Community (community-published scripts and lineage notices; quotes re-checked 2026-09-14)
- [4] BestProps: Prop Firm Drawdown Rules by Calculation Method – RuleWatch (drawdown definitions and source checks; quotes re-checked 2026-09-14)