
Key takeaways
ICT’s October 27, 2017 retrospective reviews EUR/USD around an ECB announcement without claiming a live trade, verified execution, brokerage records or fills, and warns that event risk, slippage and opposite-direction moves make hindsight patterns unreliable as signals.
Read the full summary
ICT’s October 27, 2017 retrospective reviews EUR/USD around an ECB announcement without claiming a live trade, verified execution, brokerage records or fills, and warns that event risk, slippage and opposite-direction moves make hindsight patterns unreliable as signals. The analysis combines nested head-and-shoulders formations and a possible 1.1320 longer-term objective with an ICT bearish order block defined as the final two bullish candles near a high before a fast, substantial decline, a prior dealing range, Fibonacci-based Optimal Trade Entry and symmetrical price swings. Upside levels included 1.1840 and equal highs near 1.1860 after the prior session reached 1.1820, although 1.1840 was missed, while candle-body measurements aligned a projected swing and bearish order block near the recorded 1.1836 resistance. On the five-minute chart, the hindsight setup used a bearish bias, strong downward impulse, roughly 20-pip rebound and 62% retracement before price passed two downside targets and completed a symmetrical swing. The lesson illustrates confluence and chart annotation rather than proving institutional causation, real-time predictability or profitability.
How we researched this article
BestProps used document-based research from primary firm sources, checked September 25, 2026. The complete source list, scope, limitations, and commercial-state record appear near the end of this article.
In Integrating ICT Concepts – ECB Review, uploaded on October 27, 2017, ICT presents a retrospective study of EUR/USD price action around an ECB announcement and press conference. He explicitly says that he did not trade the move and is reviewing it with hindsight. The lesson connects conventional chart patterns with concepts he calls bearish order blocks, dealing ranges, Optimal Trade Entry (OTE), liquidity objectives and symmetrical price swings.
Watch the primary video on YouTube.
ICT ECB Session Review With Hindsight
ICT begins by stressing that the major move had already occurred and that he had stayed away from the market. That qualification matters: the recording documents a post-session interpretation, not a contemporaneous signal or verified execution. He also warns that announcement-driven price action could have moved in the opposite direction and cautions inexperienced viewers against chasing pips during major events. His discussion of event risk begins around 4:29.
For educational review, this distinction helps separate pattern recognition from execution evidence. A chart can look orderly after the fact, while a trader operating before an announcement would still face uncertainty, rapid movement and possible slippage. The transcript supplies no brokerage records or fills.
ICT ECB Session Higher Time Frame Structure
At 0:49, ICT identifies nested head-and-shoulders formations on the chart. He draws a neckline through an area with multiple wick contacts and describes projecting the pattern’s height beneath the neckline. He says the smaller projection had already been fulfilled and discusses 1.1320 as a possible longer-term objective from the larger formation, while avoiding a claim that it had to be reached immediately.
This opening section uses familiar technical-analysis geometry rather than an ICT-specific setup. Its role is to establish a broader bearish context before the review moves to an hourly chart. In the recording he rounds the neckline to the 1.1705 level and projects it down toward the 1.1320 area; the exact chart placement cannot be independently confirmed from the audio transcript alone.
ICT Bearish Order Block Concept in the ECB Session
The main integration begins around 5:20. ICT says the underlying method has not changed; instead, he is adding concepts such as order blocks to explain why particular price areas mattered.
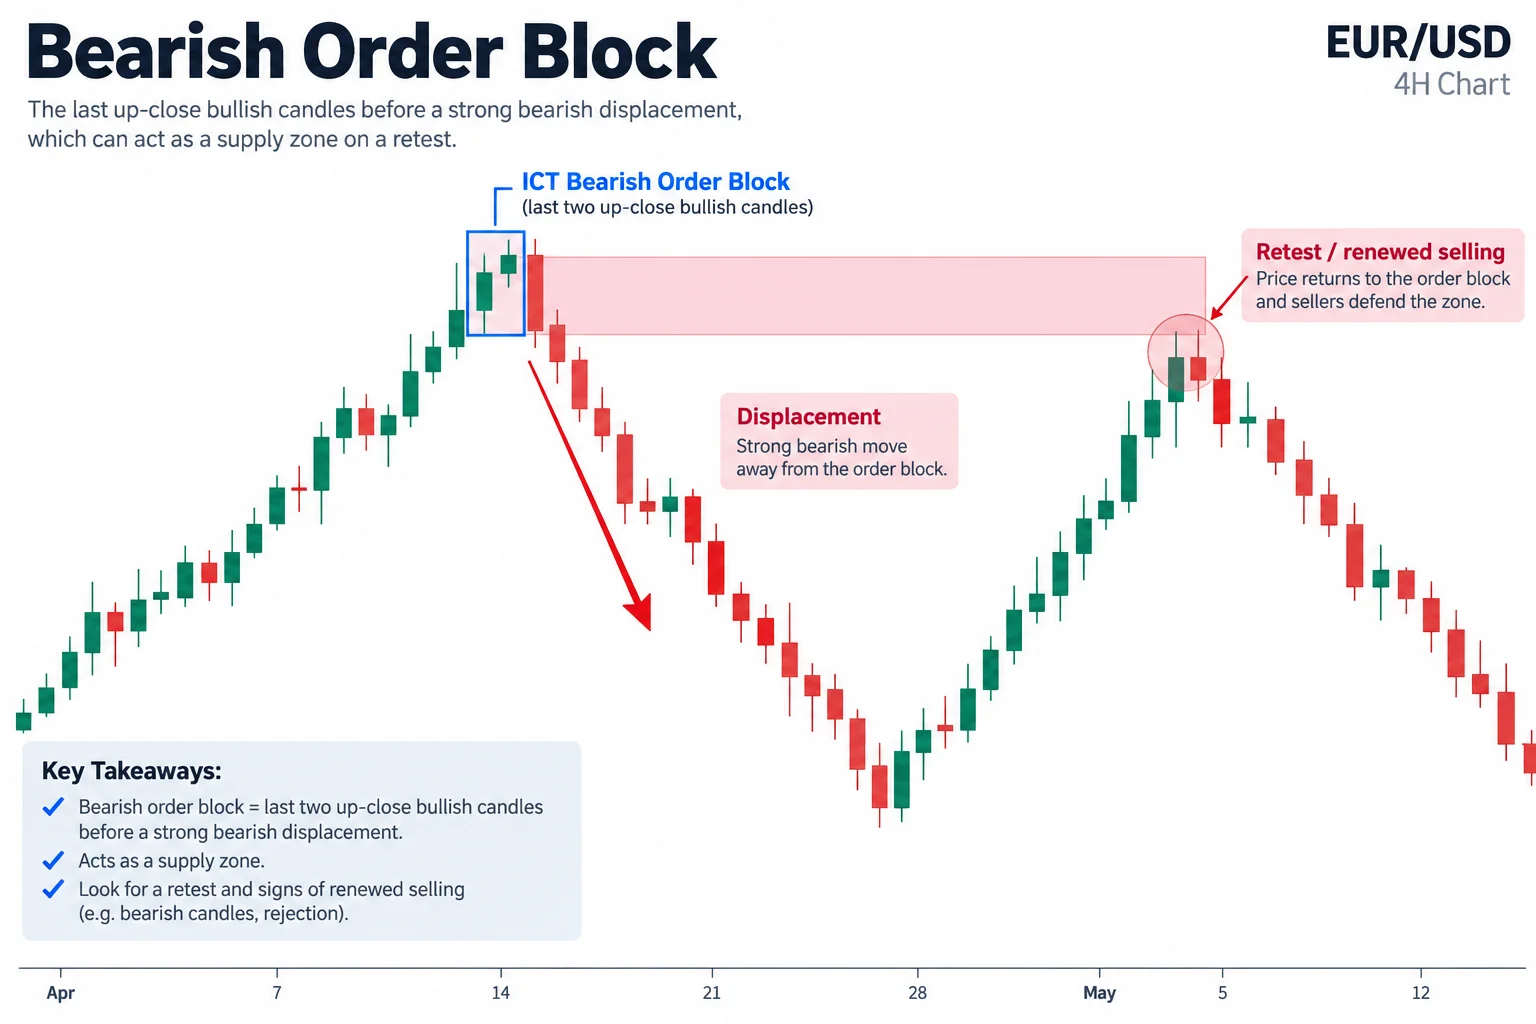
Beginning at 6:05, he points to the final two bullish, or “up-close,” candles near a high and labels them an ICT bearish order block. In his framework, the relevant candles precede a forceful decline. He emphasizes two characteristics:
- Magnitude: price moves a substantial distance away from the area.
- Speed: the departure occurs quickly enough to make the area conspicuous.
ICT cautions that not every bullish candle qualifies. He favors an obvious cluster near a high followed by decisive displacement. He interprets a later return to that range as renewed institutional selling. That institutional explanation is ICT’s market model, not something demonstrated by order-book or transaction data in the video.
Integrating ICT Dealing Range OTE and Price Objectives
ICT then reviews several upside levels he had been watching. Around 8:27, he mentions objectives near 1.1840 and equal highs around 1.1860, while saying the preceding session reached 1.1820 to the pip. He acknowledges that the 1.1840 objective was not reached.
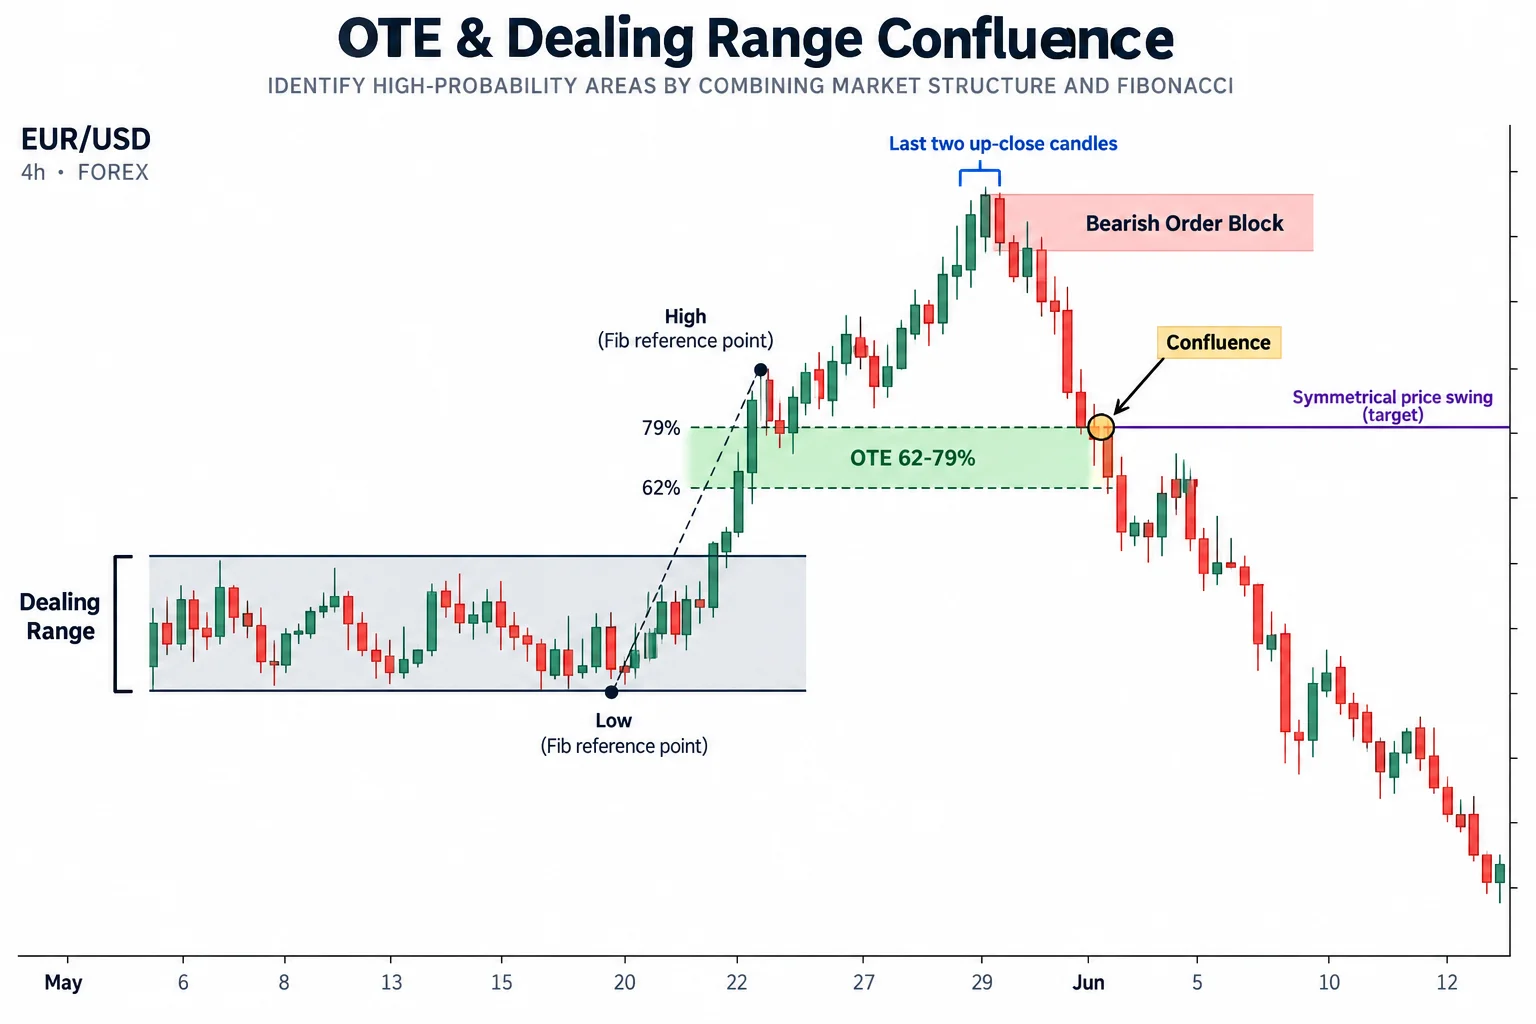
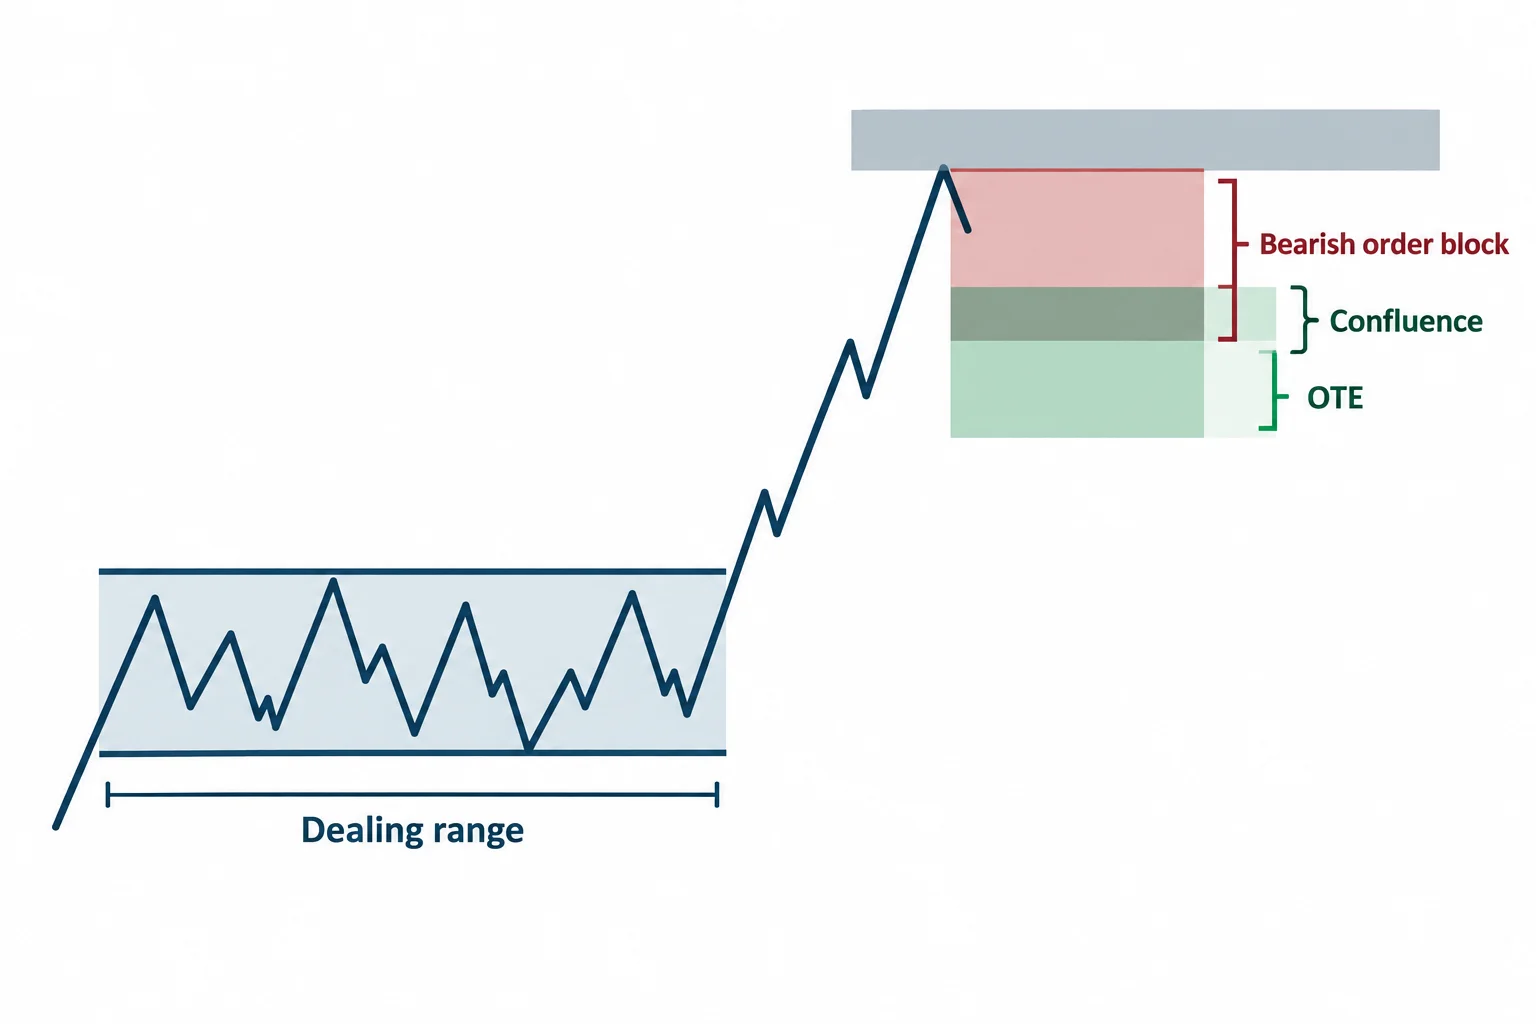
To explain the recorded high near 1.1836, he defines a prior consolidation as a “dealing range.” At 10:03, he selects candle-body reference points from that range and applies a Fibonacci-based OTE measurement. In his interpretation, the resulting symmetrical price-swing level aligns with the bearish order block, giving the 1.1836 resistance he shows.
The key idea is confluence: a projected swing terminates in an area already marked by the last prominent bullish candles before a strong decline. ICT says this overlap explains why 1.1836 became resistance in the example. He does not say that banks literally use Fibonacci ratios; instead, he argues that his selected ratios can overlap levels where he believes institutional activity previously occurred. The transcript cannot independently verify either the exact chart coordinates or the cause of the reversal.
ICT Five Minute ECB Session Setup
At 13:59, ICT moves to a five-minute EUR/USD chart. Once a bearish bias and strong downward impulse are identified, he describes waiting for a rebound of roughly 20 pips. According to his review, the retracement reached the 62% level before price sold off, passed two targets and eventually completed a symmetrical price swing.
He again states that this is a hindsight example and that he did not take the trade. The segment is therefore best read as a demonstration of how he applies previously defined rules: establish directional bias, wait for a retracement, look for overlap with a selected Fibonacci level and then map potential downside objectives.
Key Lessons From the ICT ECB Session
The session’s central teaching is not a new standalone pattern. ICT layers his concepts onto a broader bearish reading: higher-time-frame structure supplies context, the bearish order block marks a potential reaction area, OTE provides a retracement framework and symmetrical projections organize possible objectives.
The most important limitation is also supplied by ICT himself: the analysis was assembled after the move. It can illustrate terminology and chart annotation, but it does not establish that the setup was predictable, executable or profitable in real time. Traders studying the material should treat it as historical market commentary rather than investment advice or a performance promise.
Resources
- Integrating ICT Concepts – ECB Review (YouTube) — the primary source clip this article describes; use the timestamp links above to compare each explanation against the recording.
- OTE in Trading: The ICT Optimal Trade Entry Explained (theinnercircletraders.com) — unofficial, untested third-party companion article describing the 62–79% OTE zone and its six Fibonacci levels.
- ICT Trading Books and PDF Guide (theinnercircletraders.com) — unofficial, untested third-party guide to the free ICT curriculum and how it is derived from Michael Huddleston’s YouTube channel.



