
Key takeaways
ICT walks through a USD/CHF optimal trade entry (OTE) short from the October 27, 2017 New York session.
Read the full summary
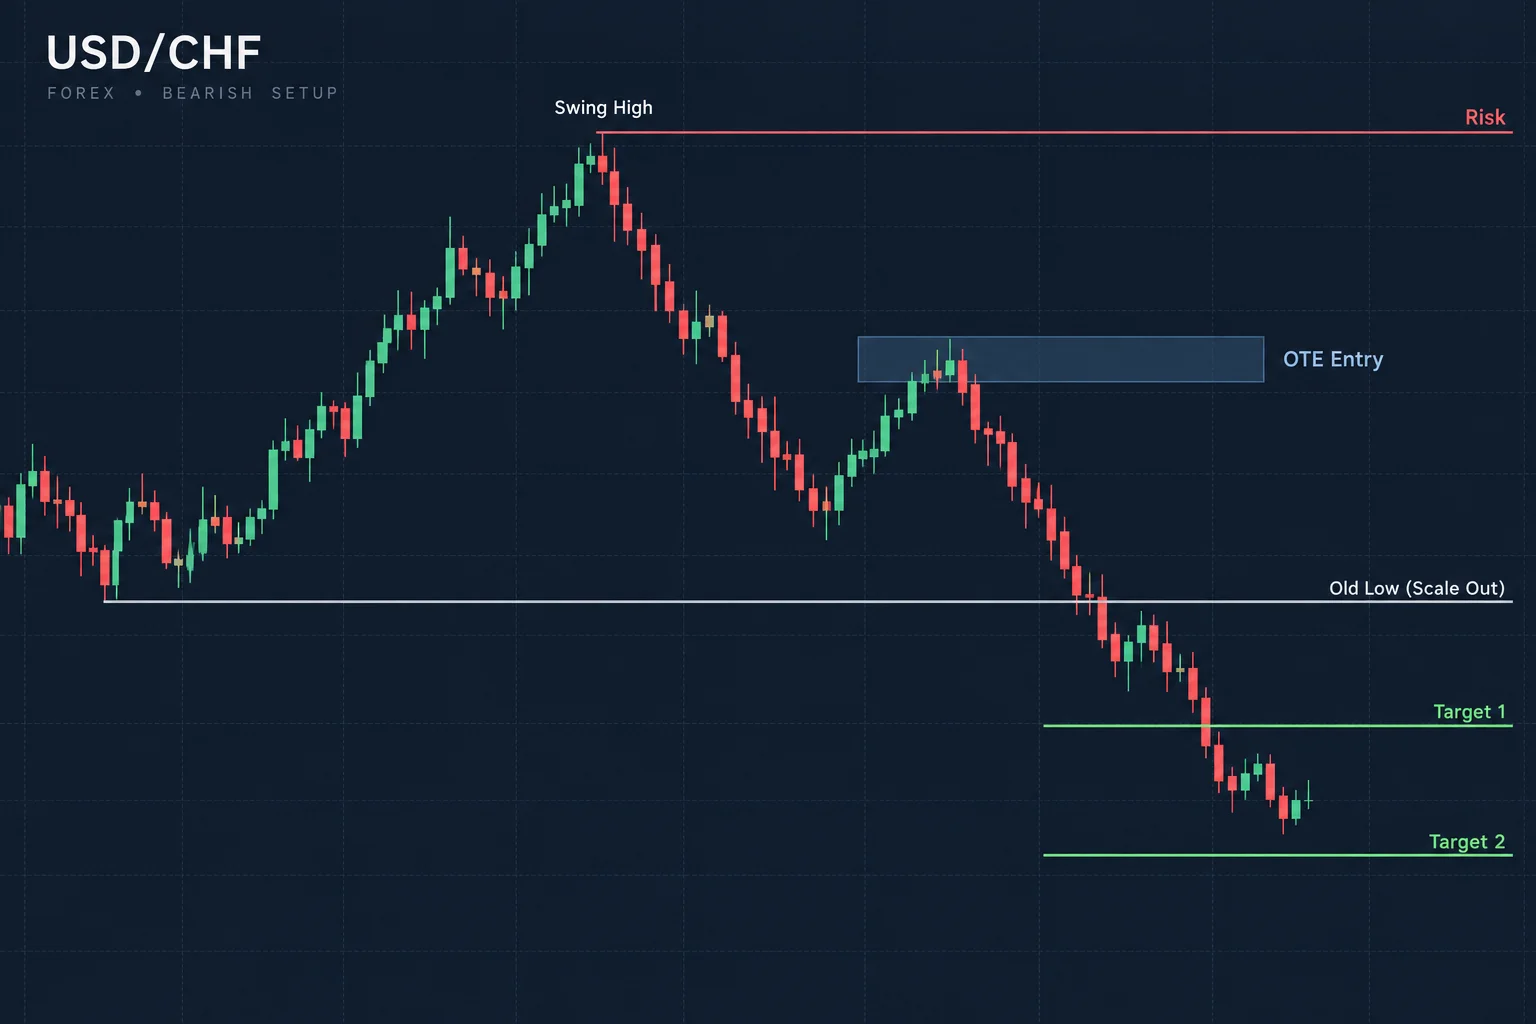
ICT walks through a USD/CHF optimal trade entry (OTE) short from the October 27, 2017 New York session. He frames the short using a specific swing high and low, places the OTE entry near the point of inception, uses the swing high as the risk reference, scales out at the old low, and labels two further targets, the first of which he says the displayed move reached. He opens by asking viewers to read the chart for themselves, briefly notes market maker sell model and ICT breaker concepts, then redirects focus to the swing-defined structure. He also stresses that a missed entry should not be chased and that the next valid setup should be waited for. The recording is a pattern-recognition drill; it does not document an actual order, fill, position size, realized return, spread or slippage and therefore does not verify performance or establish that OTE has a proven edge.
How we researched this article
BestProps used document-based research from primary firm sources, checked September 25, 2026. The complete source list, scope, limitations, and commercial-state record appear near the end of this article.
This drill is grounded in the timestamped spoken transcript of ICT’s video, sourced from automatic speech recognition of the October 27, 2017 New York session USD/CHF (Swissy) example uploaded to YouTube on October 29, 2017 [1]. The chart itself was not available for independent visual verification, so price levels such as 1.0011 are reported as spoken and flagged for the reader to confirm against the original video.
Identifying the setup
At 0:15, ICT opens with a recognition prompt: “What do you see?” He then identifies the chart formation as an OTE short at what he calls its point of inception. This question-first framing turns the clip into a recognition exercise: viewers inspect the price structure before being given the presenter’s label.
ICT briefly references a “market maker sell model” and an “ICT breaker,” but at 0:52 he redirects attention to a particular swing high and swing low. In his explanation, those two points frame the setup. The transcript notes that the low comes in at 1.0011 and the entry candle high also registers 1.0011; because that figure comes from automatic speech recognition and the chart is unseen, it should be checked against the original video before being treated as an exact quotation or market level.
Entry, risk and planned exits
At 1:09, ICT places the example within what he calls the New York “ICT kill zone,” meaning a time window in his own methodology. He then describes the four-part management sequence:
- Entry: the optimal trade entry area.
- Risk reference: the swing high.
- Initial scale-out reference: the old low.
- Further objectives: two targets, the first of which he says the displayed move reached.
This is a retrospective explanation of the chart shown in the video. The audio transcript does not reveal an actual order, fill, position size, realized return, spread or slippage. It therefore supports discussion of ICT’s proposed structure, but not a verified performance claim.
What if the ideal entry is missed?
At 1:35, ICT addresses a missed initial entry. He points to a later retest as another possible entry under the same scaling framework.
The broader teaching point arrives near 1:49. ICT tells viewers to follow their rules rather than force a trade. A missed entry may produce another opportunity, but if it does not, the stated response is to wait for the next setup instead of chasing price.
The recording

This is the primary recording the article is based on. If the player above is unavailable to you, follow the link to watch the video on YouTube.
General planning routine
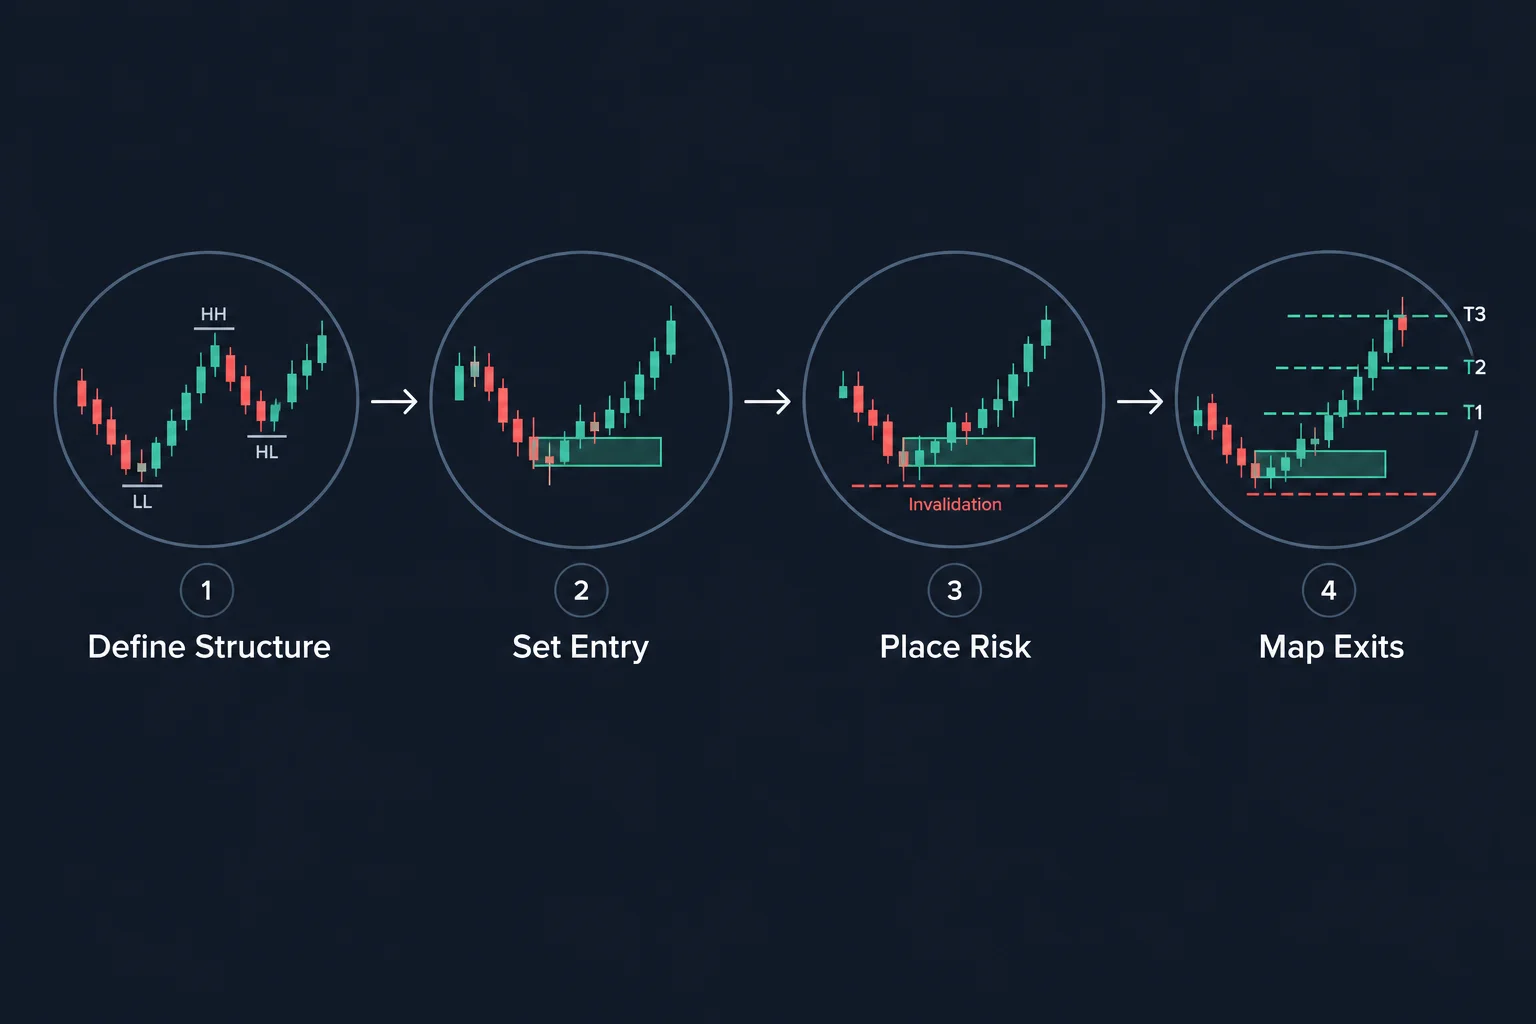
Separate from ICT’s proprietary terminology, the drill illustrates a general planning routine [2] —
- Define the structure first. Identify the swing points that establish the trade idea before considering execution.
- Set the entry area. Commit to the desired entry before acting.
- Place risk in advance. The swing high serves as the invalidation point for the short thesis.
- Map exits before entry. The old low and subsequent targets provide a planned sequence rather than an improvised reaction.
- Do not chase a missed move. A retest may offer another opportunity, but its absence is not a reason to force an entry.
Key takeaway
The drill’s central lesson is preparation rather than urgency. ICT identifies a swing-defined short setup, outlines an entry, risk reference and target sequence, and then emphasizes that traders should not pursue price after missing the planned entry. The clip closes at 2:16 by identifying the example as USD/CHF (often nicknamed “Swissy”) for October 27, 2017.
This commentary is for education only and is not investment advice or a promise of performance [3]. ICT’s OTE and related concepts are his own methodological terms and are not established as a verified trading edge [4]. Any application requires independent definitions, testing and risk controls.
Sources
- ICT Pattern Recognition Drill — OTE USD/CHF New York Session 10/27/17 (primary source)
- ICT Trading Education Library (general ICT methodology reference)
- FXEmpire: How to Trade Forex — A No-Nonsense FX Guide for Retail Traders (USD/CHF session context)
- FXEmpire: FX Seasonality — session overlap and volatility context



