
Key takeaways
ICT’s trending-day framework aligns weekly and daily bias with decisive intraday expansion through prior highs or lows, favoring Monday through Wednesday for continuation entries and treating Thursday as a possible extension or weekly reversal day.
Read the full summary
ICT’s trending-day framework aligns weekly and daily bias with decisive intraday expansion through prior highs or lows, favoring Monday through Wednesday for continuation entries and treating Thursday as a possible extension or weekly reversal day. In the bearish December 2020 U.S. Dollar Index example, the daily profile opens, trades higher to establish a London-session high, expands below previous lows with displacement, and later consolidates, while bullish conditions reverse the logic by seeking London lows and expansion above prior daily highs. Five-minute charts should use New York time, with midnight to noon defining the studied 12-hour range. ICT favors profit taking around ten to eleven a.m. New York time and selects Fibonacci objectives by projecting one standard deviation plus a further half-step, prioritizing the projected level available during that window rather than price alone. A falling Dollar Index may support EUR/USD strength, while consolidation can prompt relative-strength analysis through crosses such as EUR/GBP. The lesson begins weekly and daily alignment, introduces preferred weekdays at two minutes, reviews hourly action at four minutes 13 seconds, warns about failed continuation at ten minutes two seconds, covers Thursday near 15 minutes ten seconds, shifts to five-minute analysis at 18 minutes 32 seconds, explains objectives at 22 minutes 52 seconds, and reverses the model for bullish days at 35 minutes 58 seconds. These are unverified ICT interpretations, not guaranteed rules, and should be tested on both matching and failed historical examples without hindsight.
How we researched this article
BestProps used document-based research from primary firm sources, checked September 25, 2026. The complete source list, scope, limitations, and commercial-state record appear near the end of this article.
In ICT Forex Price Action Lesson: Trending Days, ICT explains his framework for identifying an intraday trending day. The lesson uses a bearish U.S. Dollar Index example from December 2020, then describes how the same logic would be reversed under bullish market conditions.
The central idea is that a trending-day setup should not be inferred from an isolated lower-time-frame pattern. In ICT’s interpretation, it begins with directional agreement on weekly and daily charts, continues with evidence of price expanding through prior lows or highs, and ends with intraday timing and price objectives. These are ICT’s market interpretations, not independently validated rules or assurances of a trading edge.
ICT Higher Time Frame Bias for Trending Days
ICT opens by defining a trending day as one on which an intraday trade aligns with a higher-time-frame bias. In the featured example, he characterizes the Dollar Index as bearish and therefore looks for daily ranges that initially trade higher before expanding lower. He notes that the inverse framework would apply to instruments expected to rise, including the corresponding opposite behavior that may appear in EUR/USD or GBP/USD.
At 2:00, he introduces Monday, Tuesday and Wednesday as his preferred days to seek continuation entries. This is presented as a tendency within his model, not a restriction: Thursday and Friday can also continue the move, and some weeks will not expand as expected.
ICT Price Action on Bearish Trending Days
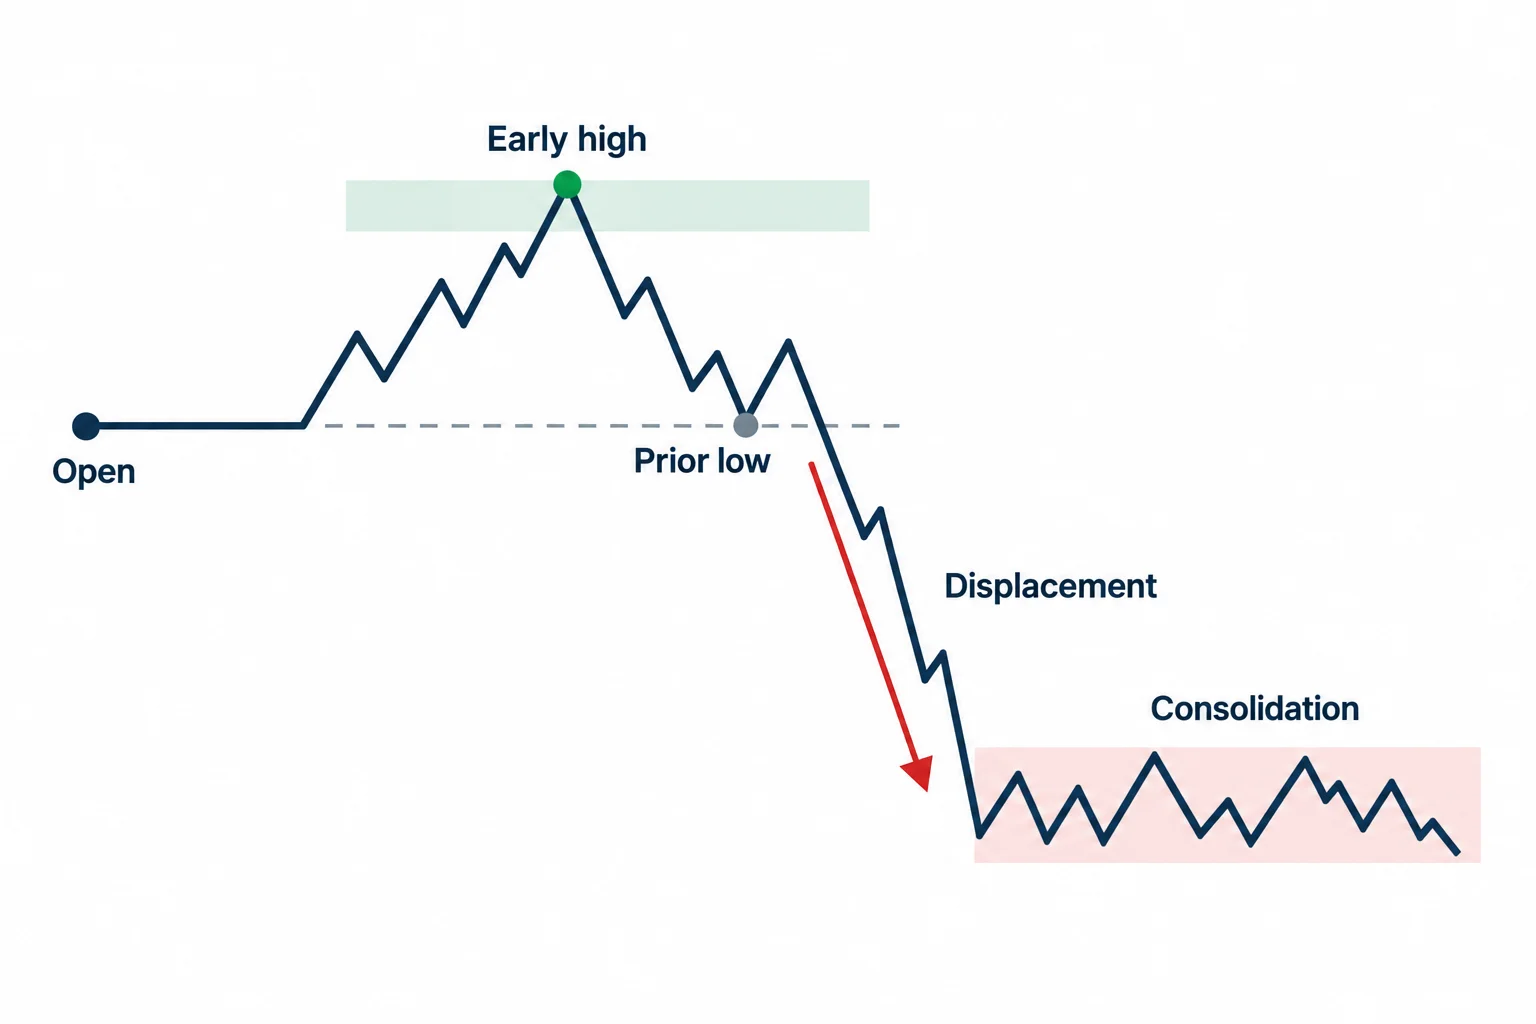
ICT describes a classic bearish daily profile as a sequence in which price opens, trades above or near the opening area to establish the day’s high, expands downward, and then consolidates into the later part of the session. He calls this a bearish “power of three” day.
The hourly example begins at 4:13. ICT reviews a week in which daily rallies were followed by declines. The practical point is not simply that the chart eventually moved lower. He asks whether price quickly rejects an intraday high and then breaks a previous day’s or session’s low with force. In his framework, decisive displacement through those lows supports the original bearish narrative.
- Higher-time-frame condition: Weekly and daily analysis point in the same direction.
- Intraday profile: In a bearish case, price forms a high and moves away from it rather than remaining near the highs.
- Expansion evidence: Prior lows are crossed decisively rather than marginally.
- Continuation days: ICT emphasizes Tuesday and Wednesday, while treating Monday as potentially useful for learning how the weekly range is developing.
He also warns against converting the example into an absolute rule. At 10:02, he explains that not every nominally bearish week will produce a large downside range. Market location matters; for example, a break of an old low may be followed by a deeper retracement rather than immediate continuation.
ICT Weekly Timing for Thursday Trending Days
ICT treats Thursday differently from the earlier continuation days. He says it can extend the trend, but it can also establish the weekly low during a bearish expansion. The transcript includes numerical probability claims concerning Thursday lows, but it provides no dataset or testing method with which to verify them. They should therefore be understood only as claims made in the lesson.
Near 15:10, ICT summarizes Tuesday and Wednesday as preferred trend-entry days and Thursday as a day that can be associated with reversals. He also says he may forgo Monday because its range supplies additional information about the likely weekly profile.
ICT Trending Days in the New York Time Window
The five-minute portion starts at 18:32. ICT tells viewers to set charts to New York time so that the session references in the lesson align with his examples. He marks midnight and noon New York time as the boundaries of a 12-hour window used to study the daily range.
For the illustrated bearish day, ICT focuses on price first moving above the daily opening level, forming a high during the London session, and subsequently selling off. He identifies several retracements as potential “optimal trade entry” patterns within his terminology. Captions alone cannot show their precise construction, so viewers need the chart in the source video to understand which candles and price legs he selected.
ICT Price Objectives for Trending Days
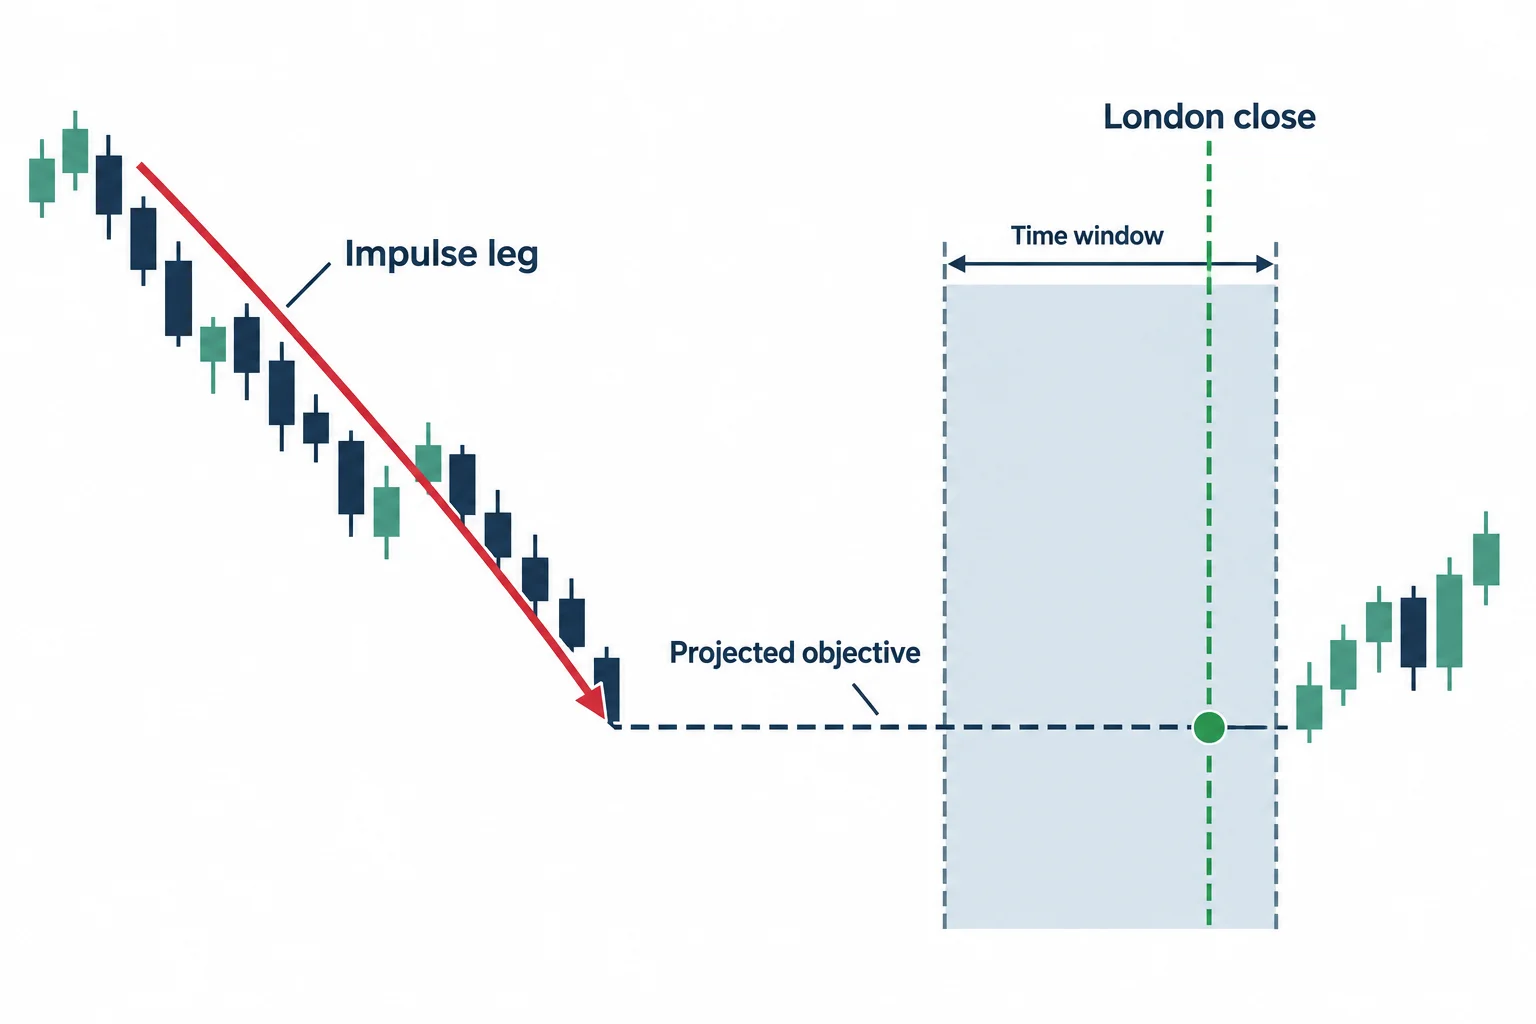
A major theme of the second half is that a price level should be evaluated together with the time at which price reaches it. At 22:52, ICT identifies 10:00–11:00 a.m. New York time as his preferred “London close” profit-taking window, while acknowledging that a daily extreme may occur somewhat earlier or later.
He then demonstrates a Fibonacci-based range projection. Using an earlier impulse leg, he projects one standard deviation and a further half-step below a broken low. His preferred objective is the projected level that overlaps the anticipated time window. According to ICT, an earlier projection was already exceeded before that window began, so he instead focuses on the lower projection reached closer to the specified time.
This is an important distinction within the lesson: price alone does not define the objective. ICT’s model prioritizes a session window and then asks which projected level is available when price enters that window. The transcript records his assertion that the example closely matched the projected level, but it does not independently establish the accuracy of that measurement or provide trade-fill records.
ICT Forex Price Action for Bullish Trending Days
At 35:58, ICT reverses the framework. With bullish weekly and daily conditions, he would look for London-session lows on Monday through Wednesday, expansion through previous daily highs, and projected highs aligning with relevant intraday time windows.
He concludes by treating the Dollar Index as a directional reference for dollar pairs. A falling index may correspond with strength in EUR/USD, while a consolidating index may lead him to inspect a cross such as EUR/GBP for relative-strength context. This relationship is described as part of ICT’s analytical process and should not be interpreted as guaranteed inverse movement.
ICT Forex Lesson Takeaways for Trending Days
Outside ICT’s specific terminology, the lesson can be studied as a top-down hypothesis-testing exercise:
- Define a directional thesis from higher time frames.
- Observe whether early-week daily ranges confirm or contradict it.
- Require lower-time-frame expansion through prior swing points rather than relying only on an overbought or oversold reading.
- Record when the day’s high or low forms relative to London and New York sessions.
- Study failed examples, especially weeks in which price has just swept an older higher-time-frame extreme and begins retracing.
ICT explicitly concedes that these weekly profiles do not always unfold as anticipated and that experience is required to classify them. The appropriate educational use is therefore to document the definitions, test them on historical data without hindsight-based relabeling, and include both matching and non-matching weeks. This article is educational commentary, not investment advice or a promise of performance.




