
Key takeaways
ICT’s Seek and Destroy profile describes consolidation punctuated by fast liquidity sweeps above and below a defined range, failed breakouts, and repeated returns to the midpoint or equilibrium, signaling traders to remain sidelined until sustained displacement establishes clearer direction.
Read the full summary
ICT’s Seek and Destroy profile describes consolidation punctuated by fast liquidity sweeps above and below a defined range, failed breakouts, and repeated returns to the midpoint or equilibrium, signaling traders to remain sidelined until sustained displacement establishes clearer direction. Using EUR/USD on August 27, 2020 during Federal Reserve Chair Jerome Powell’s Jackson Hole remarks, ICT shows price rising above 1.1850, reversing below Wednesday’s low, and returning to the broader range midpoint. At one minute 23 seconds he defines profile as a behavioral template rather than conventional market profile charting, at seven minutes 47 seconds he recommends saving and reviewing chart examples, at eight minutes 58 seconds he identifies no comfortable trade after both sides are swept without meaningful displacement, and at fourteen minutes 19 seconds he summarizes the pattern as volatility reaching liquidity before returning to the middle. ICT did not trade the unexpectedly large initial rise, and the retrospective lesson provides no formal rules, statistical test, verified performance, or proof that its liquidity framework is predictive.
How we researched this article
BestProps used document-based research from primary firm sources, checked September 25, 2026. The complete source list, scope, limitations, and commercial-state record appear near the end of this article.
In ICT Forex Price Action Lesson: Seek & Destroy Profile, ICT uses a volatile EUR/USD session from August 27, 2020 to explain a market condition he calls the “seek and destroy” profile. His central lesson is not a buy or sell setup. It is that traders should recognize when price lacks sustained direction and consider remaining on the sidelines.
The discussion concerns ICT’s own framework and interpretation of price action. It should not be treated as proof that markets operate according to the mechanisms he proposes or as a promise that the profile can be traded profitably.
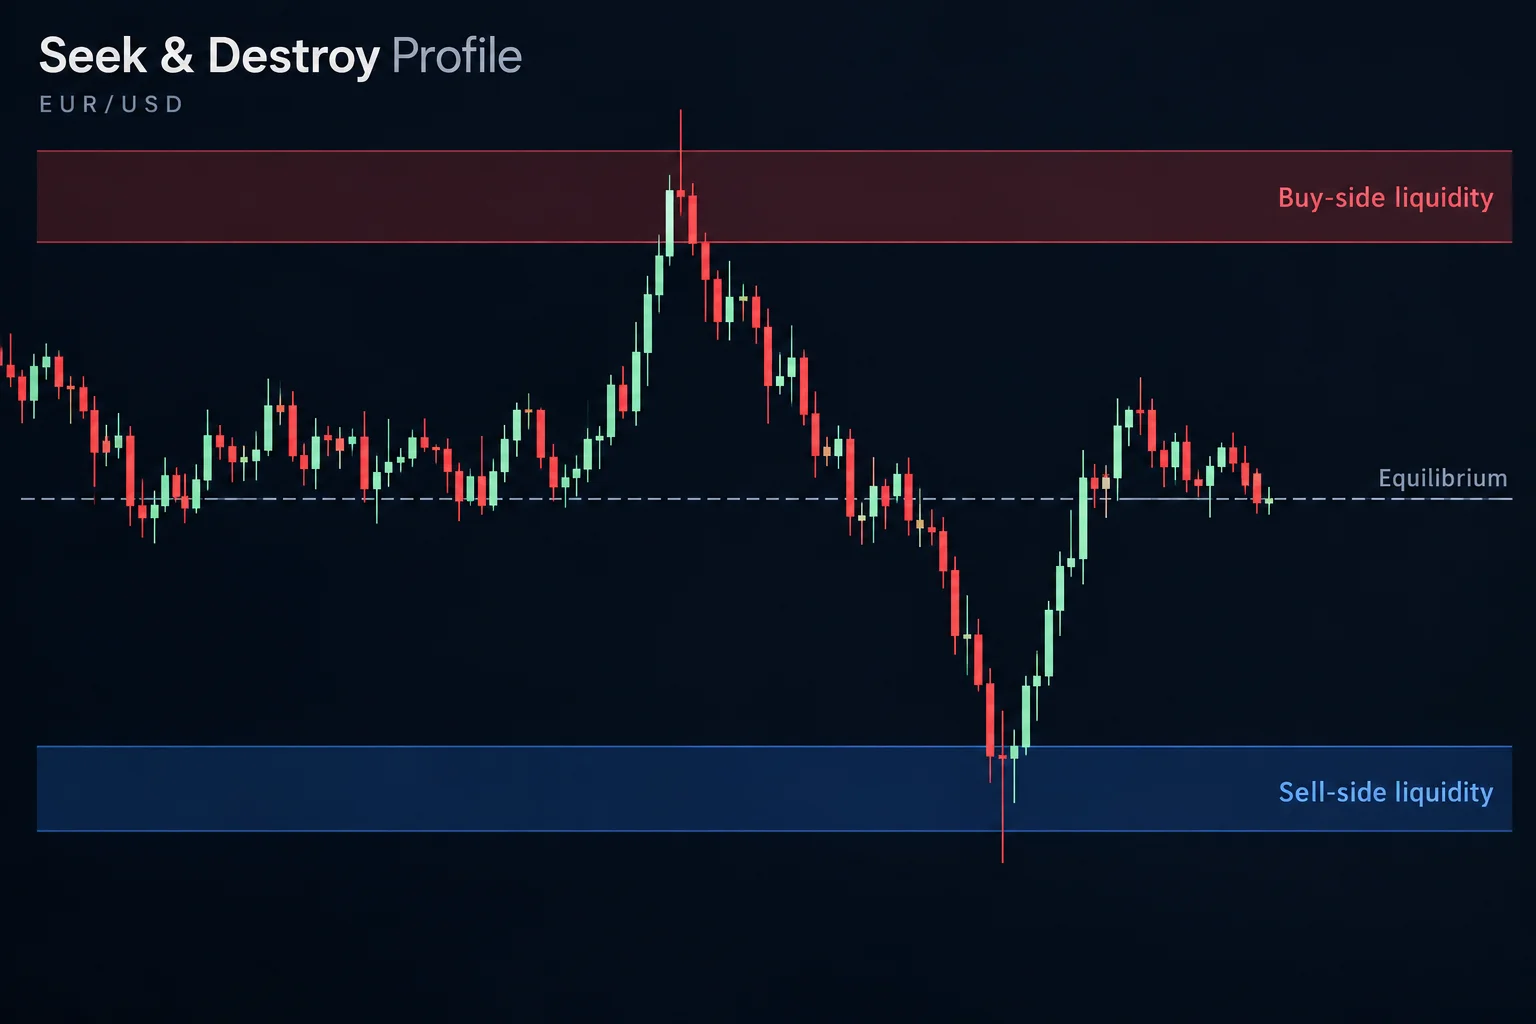
ICT Seek and Destroy Profile Explained
At 1:23, ICT distinguishes his use of “market profile” from the established charting method commonly known by that name. In this lesson, a profile means a template describing how he expects price to behave.
He characterizes seek-and-destroy conditions by several related features:
- Price begins in consolidation or a defined range.
- It makes fast moves toward levels on both sides of that range.
- Apparent breakouts lose momentum rather than developing into sustained trends.
- Price repeatedly returns toward the range’s midpoint or “equilibrium.”
- The back-and-forth movement tempts traders to chase each move as a new reversal or continuation.
ICT introduces that behavioral risk at 2:00. In his view, a large move in one direction can attract traders just before price reverses again, producing repeated losses for anyone trying to force a directional forecast.
Forex Price Action in the EUR/USD Lesson
ICT says the euro had spent much of the week moving within a range. At 4:36, he explains that consolidation makes him less willing to expect a large, durable move. Instead, he watches for brief surges above or below the range that subsequently return toward its center.
The specific session coincided with comments from Federal Reserve Chair Jerome Powell and the Jackson Hole event. According to ICT, EUR/USD first moved above the 1.1850 area he had previously identified, then reversed, moved below Wednesday’s low, and returned to the middle of the broader range. He summarizes this sequence at 7:17 as the practical example of the profile.
Importantly, ICT also acknowledges that the initial rise was larger than he expected and says he did not participate in the move. That qualification matters: the lesson is a retrospective explanation of the displayed structure, not evidence of a completed trade or verified performance result.
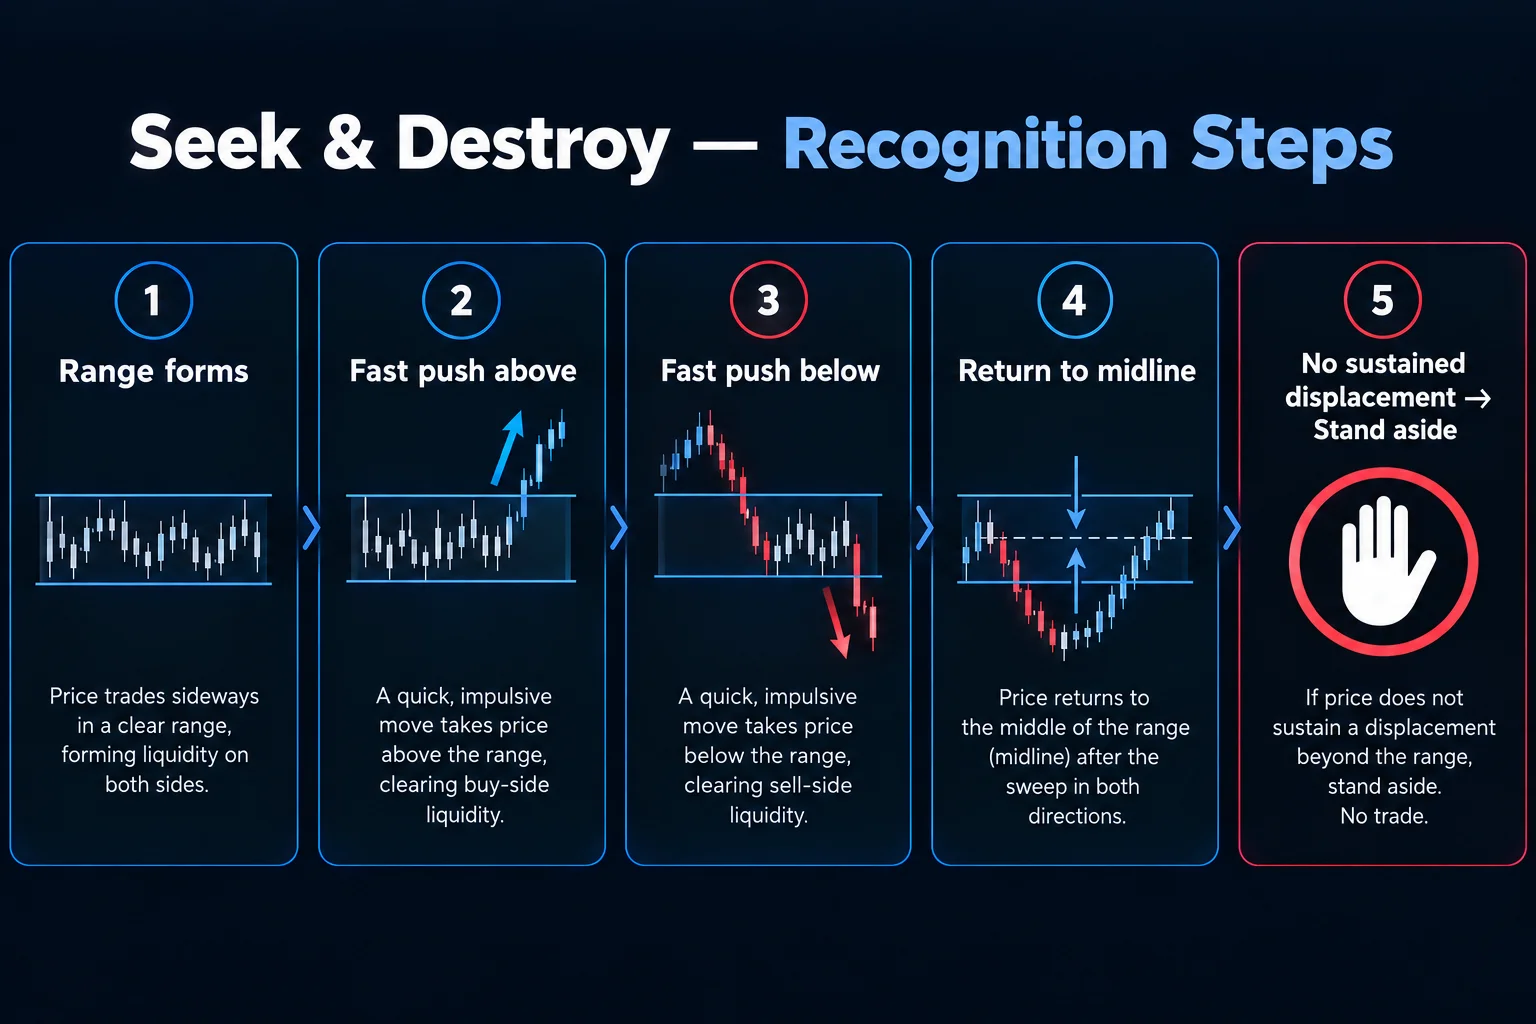
Seek and Destroy Price Action Without Sustained Displacement
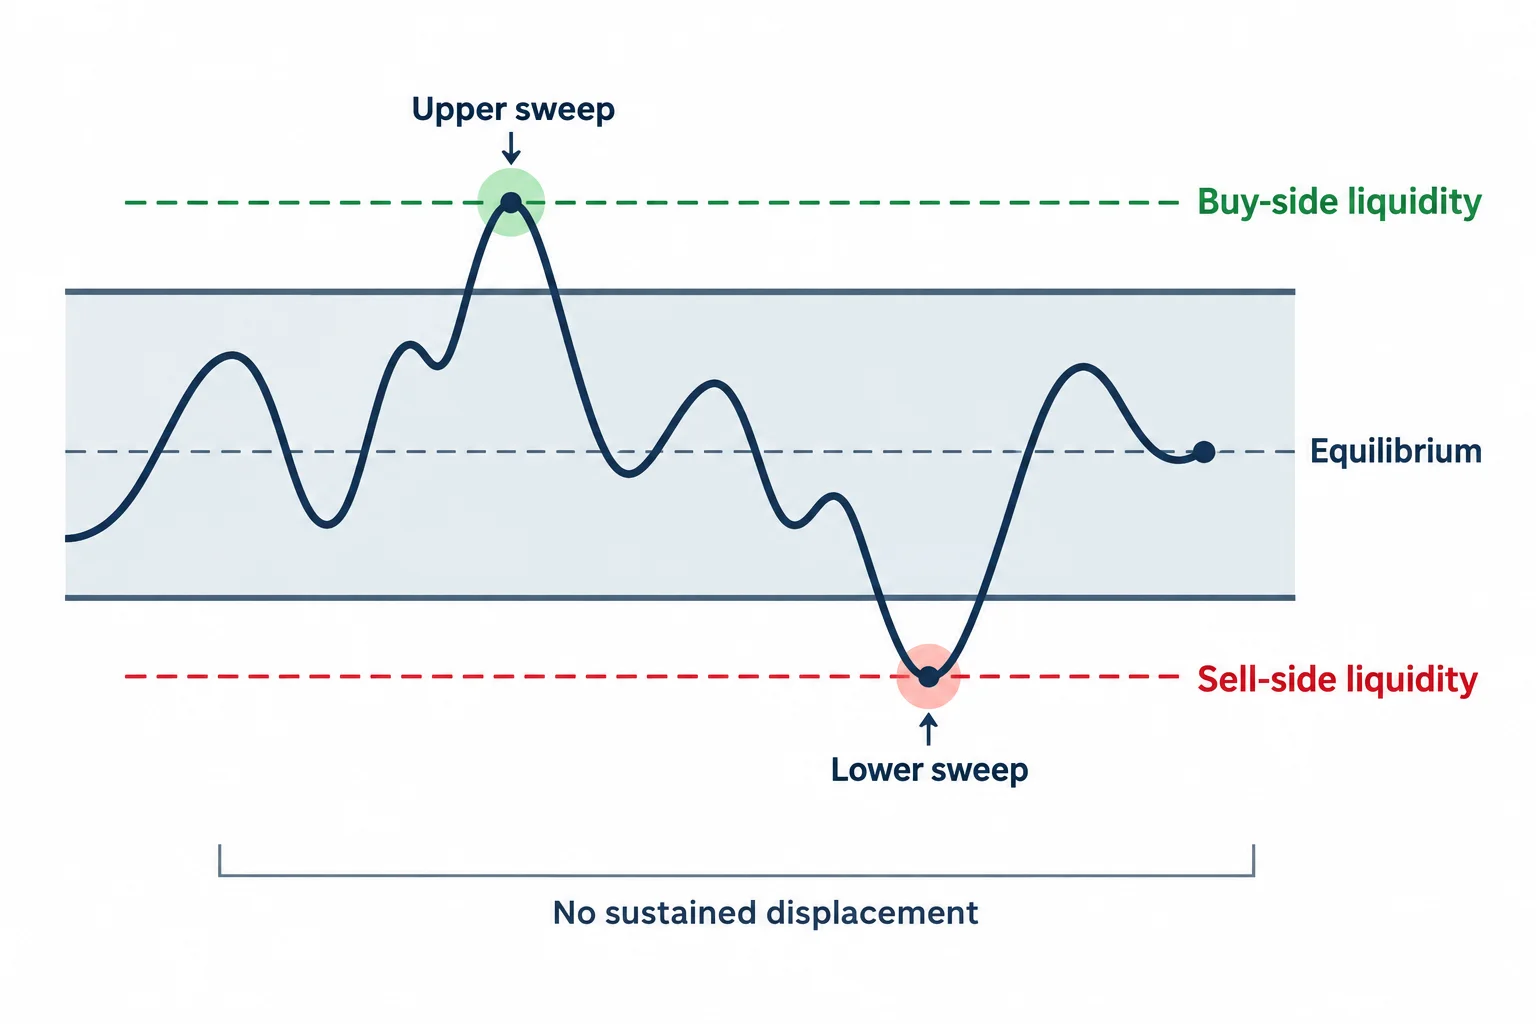
Within ICT’s terminology, highs can represent “buy-side liquidity,” while lows can represent “sell-side liquidity.” He interprets the session as having reached liquidity on both sides before returning to equilibrium. The key issue for him is not merely that those levels were crossed, but that neither move established lasting direction.
At 8:58, ICT says he sees no clear directional indication because price has moved through both sides and returned to the middle without what he considers meaningful displacement. Consequently, he does not identify a trade for which he would personally be comfortable assuming risk.
This provides a useful distinction within the lesson: touching a watched level is not automatically an entry signal. ICT says he observes how price behaves after a level is reached. A quick rejection and return through the range can undermine the directional case rather than confirm it.
ICT Forex Lesson on Deliberate Inactivity
ICT’s practical response is to “sit on his hands.” In the summary beginning at 10:16, he says the pattern can occur across an entire week or within a single trading day: consolidation is followed by a whipsaw, and price then returns to the range midpoint.
Rather than trying to capture every fluctuation, he prefers to wait for price to leave the range decisively and present clearer directional behavior. This is framed as patience and risk avoidance, not as a method for predicting which side will break first.
A Practical Forex Interpretation
Separate from ICT’s market-mechanism claims, the broader risk-management principle is straightforward: a trader does not have to hold a position at all times. When rapid moves repeatedly fail and directional evidence is unclear, reducing activity can help prevent impulsive entries, breakout chasing, and repeated exposure to whipsaw.
That principle does not make the profile objectively predictive. Terms such as “liquidity,” “displacement,” and “equilibrium” depend on how they are defined and applied. The video supplies ICT’s discretionary interpretation of one chart, not a formal rule set, statistical test, or independently verified trading result.
How to Study the ICT Seek and Destroy Profile
At 7:47, ICT recommends saving examples from one’s own charting platform and reviewing how price traveled back and forth before returning to consolidation. A responsible study process would record the range boundaries and observations without assuming in advance that every volatile range belongs to the same category.
ICT closes at 14:19 by condensing the profile to volatility that reaches liquidity and then returns to the middle. Although he says such movement may be tradable in theory, he cautions that it requires a degree of agility many traders may not possess. The lesson’s strongest message is therefore defensive: recognizing unclear market conditions may be more valuable than manufacturing a trade within them.
Watch the Original ICT Lesson
The chart walk-through, level explanations and liquidity discussion are best understood in the original 2020 recording:
▶ Watch ICT Seek & Destroy Profile on YouTubeThe transcript alone cannot independently verify chart annotations or trade performance.
More ICT Forex Price Action Resources
- ICT Forex Price Action Lesson: Seek & Destroy Profile the primary source for this article.
- Inner Circle Trader YouTube channel ICT's official channel where the seek-and-destroy profile and related concepts are first published.
- CME Group FX markets overview neutral reference for the EUR/USD futures and spot context referenced in the lesson.
- Federal Reserve FOMC calendar and statements the macro catalysts (Jackson Hole remarks) cited by the speaker.




