
Key takeaways
ICT Price Action teaches SMT divergence by comparing open, high, low and close swings in correlated markets rather than stochastic, RSI, CCI or MACD signals, primarily on hourly charts.
Read the full summary
ICT Price Action teaches SMT divergence by comparing open, high, low and close swings in correlated markets rather than stochastic, RSI, CCI or MACD signals, primarily on hourly charts. The main example compares NZD/USD with AUD/USD around ranges, relative equal highs and liquidity, treating a higher high in NZD/USD against a lower high in AUD/USD as comparative weakness and a possible stop run, while a lower low against a correlated higher low may indicate comparative strength. Divergence alone is not a trade and requires correlated instruments, market regime, liquidity context and directional bias. For bearish breaker confirmation, price trades above prior highs, breaks a prior low, then returns to the last down-close candle before the higher high, creating a potential short evaluation area with the prior low as an initial objective. Beginners are advised to study SMT in ranges before trends, compare strong and weak currencies through crosses, and explore related metals or grains cautiously. ICT recommends screenshots, annotations and journaling, including failed cases and development time, while the transcript provides no exact prices, fills, risk figures, independently verified outcomes or proof of institutional activity.
How we researched this article
BestProps used document-based research from primary firm sources, checked September 25, 2026. The complete source list, scope, limitations, and commercial-state record appear near the end of this article.
What ICT Price Action Teaches
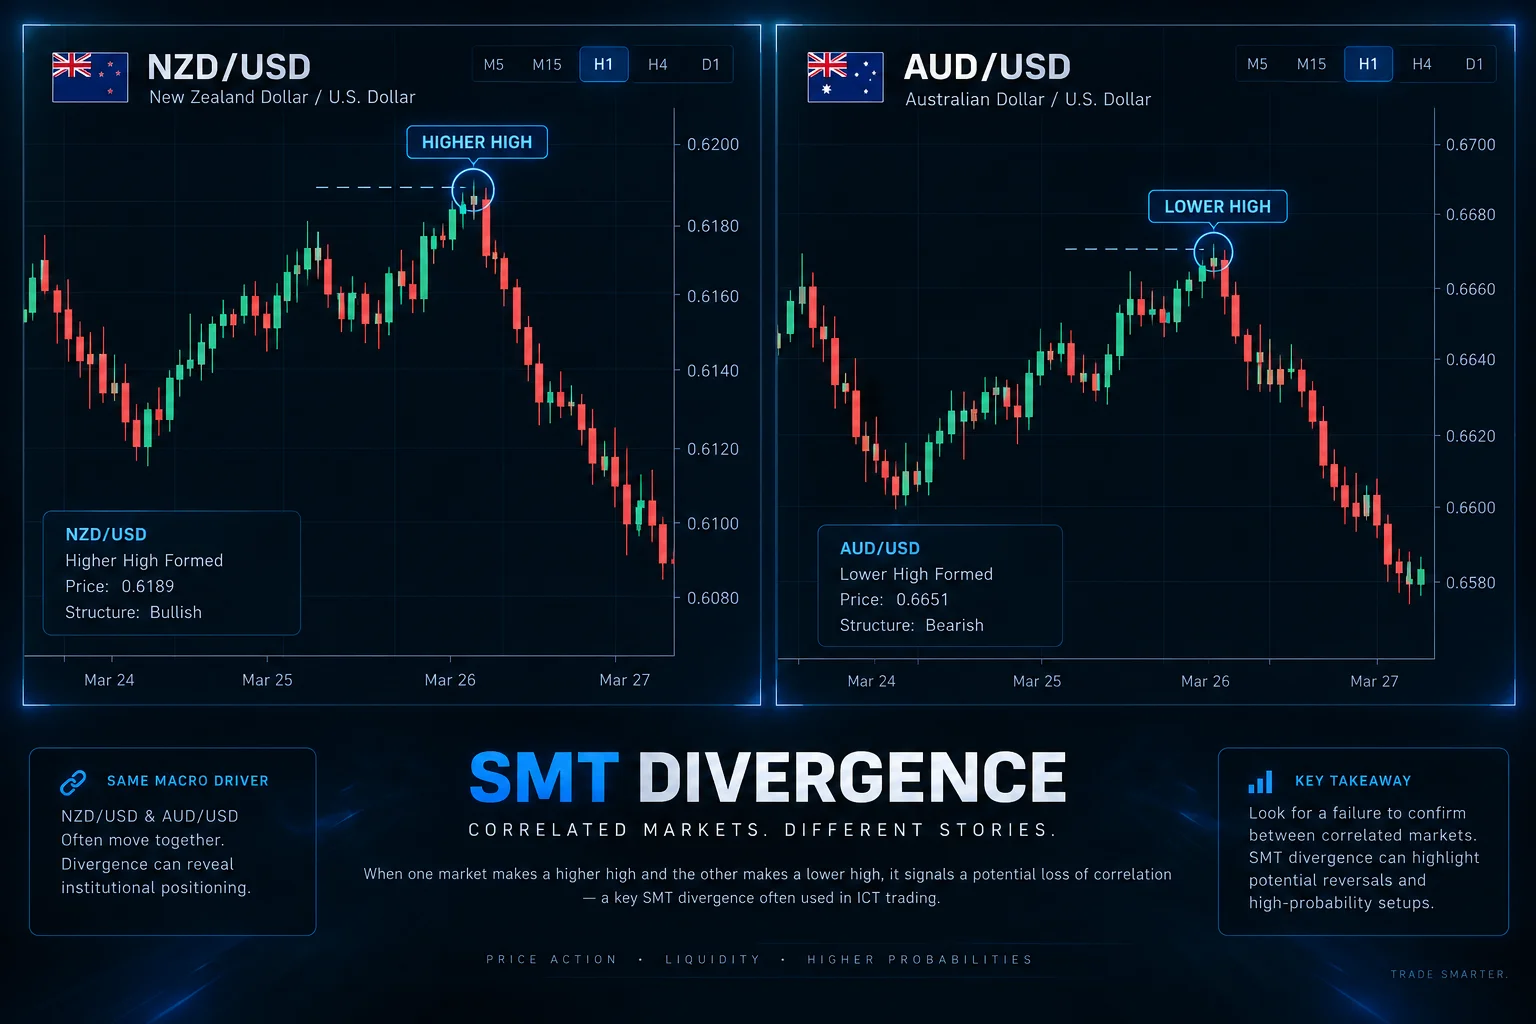
In “ICT Price Action: View Price With Institutional Perception”, ICT presents a method for comparing related markets without using conventional oscillators. The central idea is to study whether closely correlated instruments confirm one another at important highs or lows. ICT calls a failure to confirm an SMT divergence, short for “smart money technique” or “smart money tool.”
The lesson uses an hourly chart as its main setting, although ICT says the framework can be studied on other time frames. His principal example compares New Zealand dollar/U.S. dollar with Australian dollar/U.S. dollar. Because the source is a caption transcript, it does not show the chart’s exact prices or allow the claimed trade outcomes to be independently verified.
ICT Price Comparison Without Divergence Indicators
ICT begins by contrasting his approach with stochastic, RSI, CCI and MACD divergence. At 0:42, he argues that traders often apply those tools without first identifying whether the market is trending or range-bound. He acknowledges that oscillators can appear useful in ranges, but his preferred approach is to examine open, high, low and close data directly.
This does not mean that every mismatch between two markets predicts a reversal. ICT explicitly adds that context is required. His example begins with a range, relative equal highs and an expectation that orders may have accumulated beyond those highs. Only then does he use the behavior of a correlated market as additional evidence.
ICT Price Action at Equal Highs and Liquidity
Starting around 9:10, ICT describes a range containing what he calls relative equal highs. In his interpretation, these areas can attract breakout-buy orders and protective stops from traders who previously sold the apparent resistance.
When price moves above such highs, ICT does not automatically treat the move as bullish continuation. He instead asks whether a correlated instrument confirms it. He also warns that movement beyond equal highs can either reverse or continue, depending on the larger narrative. The lecture does not provide a complete method for establishing that broader bias.
ICT Price Action and SMT Divergence
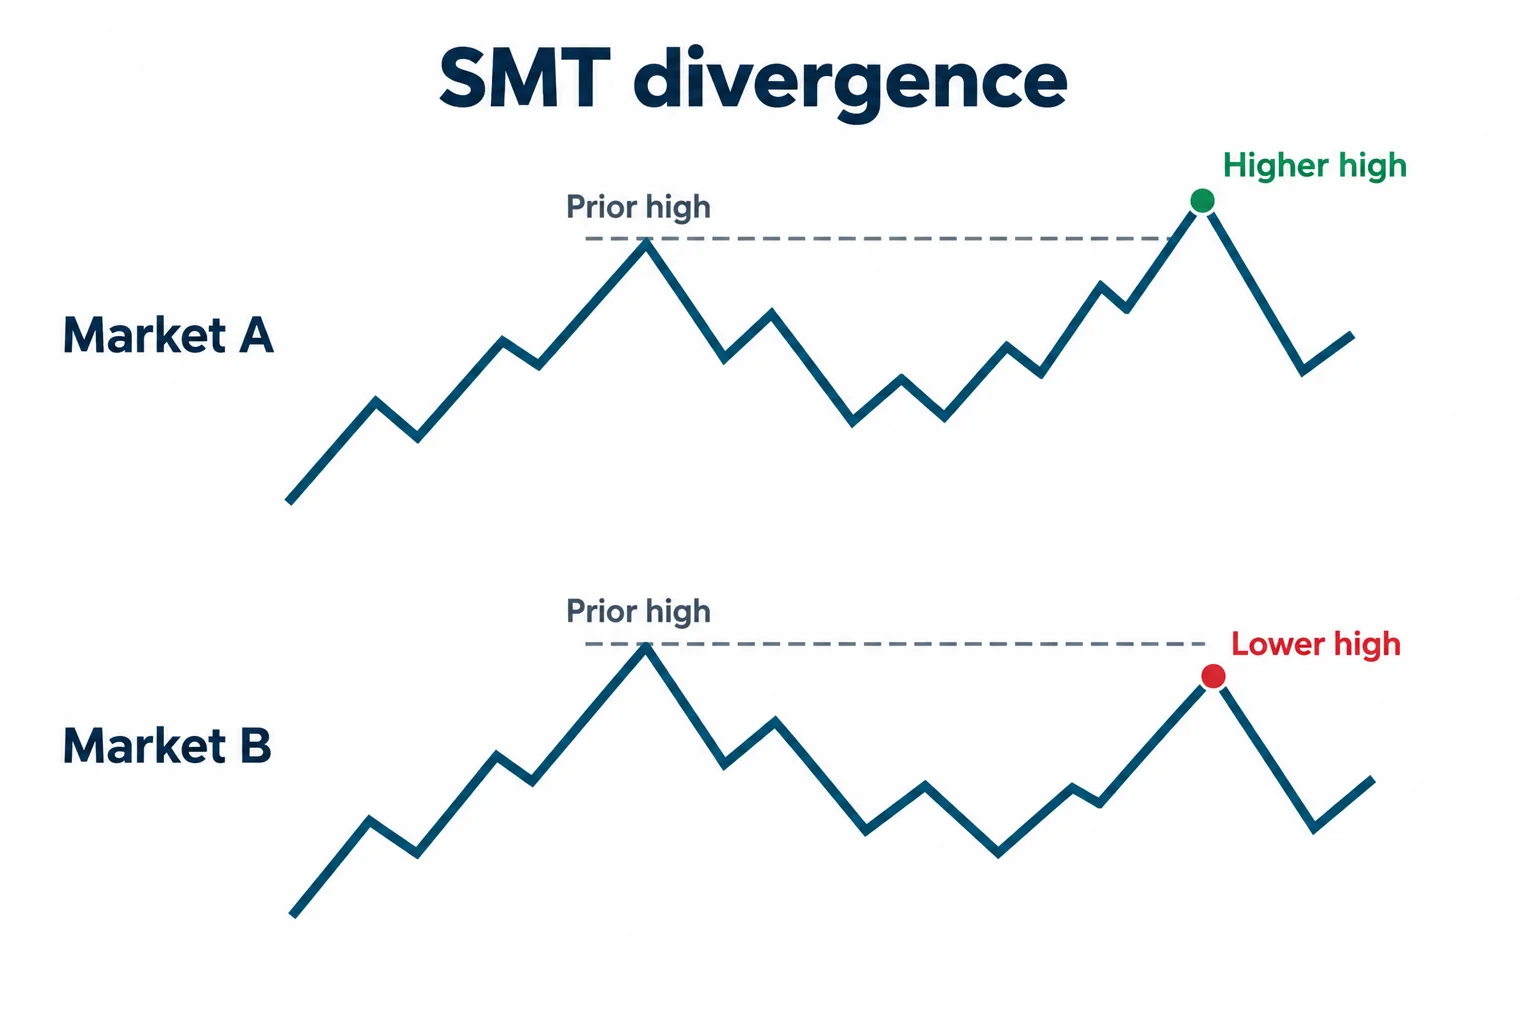
At 19:19, ICT overlays Australian dollar price action on a New Zealand dollar chart. In the example he describes, New Zealand dollar makes a higher high while Australian dollar forms a lower high. ICT labels this “SMT divergence.”
His interpretation is that the Australian dollar’s failure to confirm the new high reveals comparative weakness. Given the range and the prior highs in his example, he treats the New Zealand dollar’s higher high as a possible stop run rather than sufficient evidence of lasting strength. Later, he reverses the comparison: if one market makes a lower low while its correlated counterpart holds a higher low, he reads the non-confirmation as possible comparative strength and a bullish divergence.
The practical distinction is important:
- A divergence is a relationship between actual price swings in two related markets, not an oscillator signal.
- The markets should ordinarily be related closely enough for confirmation to be meaningful.
- ICT presents the range, liquidity premise and directional profile as prerequisites; divergence alone is not a trade.
- A temporary “crack” in correlation can identify relative strength or weakness, but it does not establish causation or guarantee the next move.
ICT Price Action Breaker Confirmation
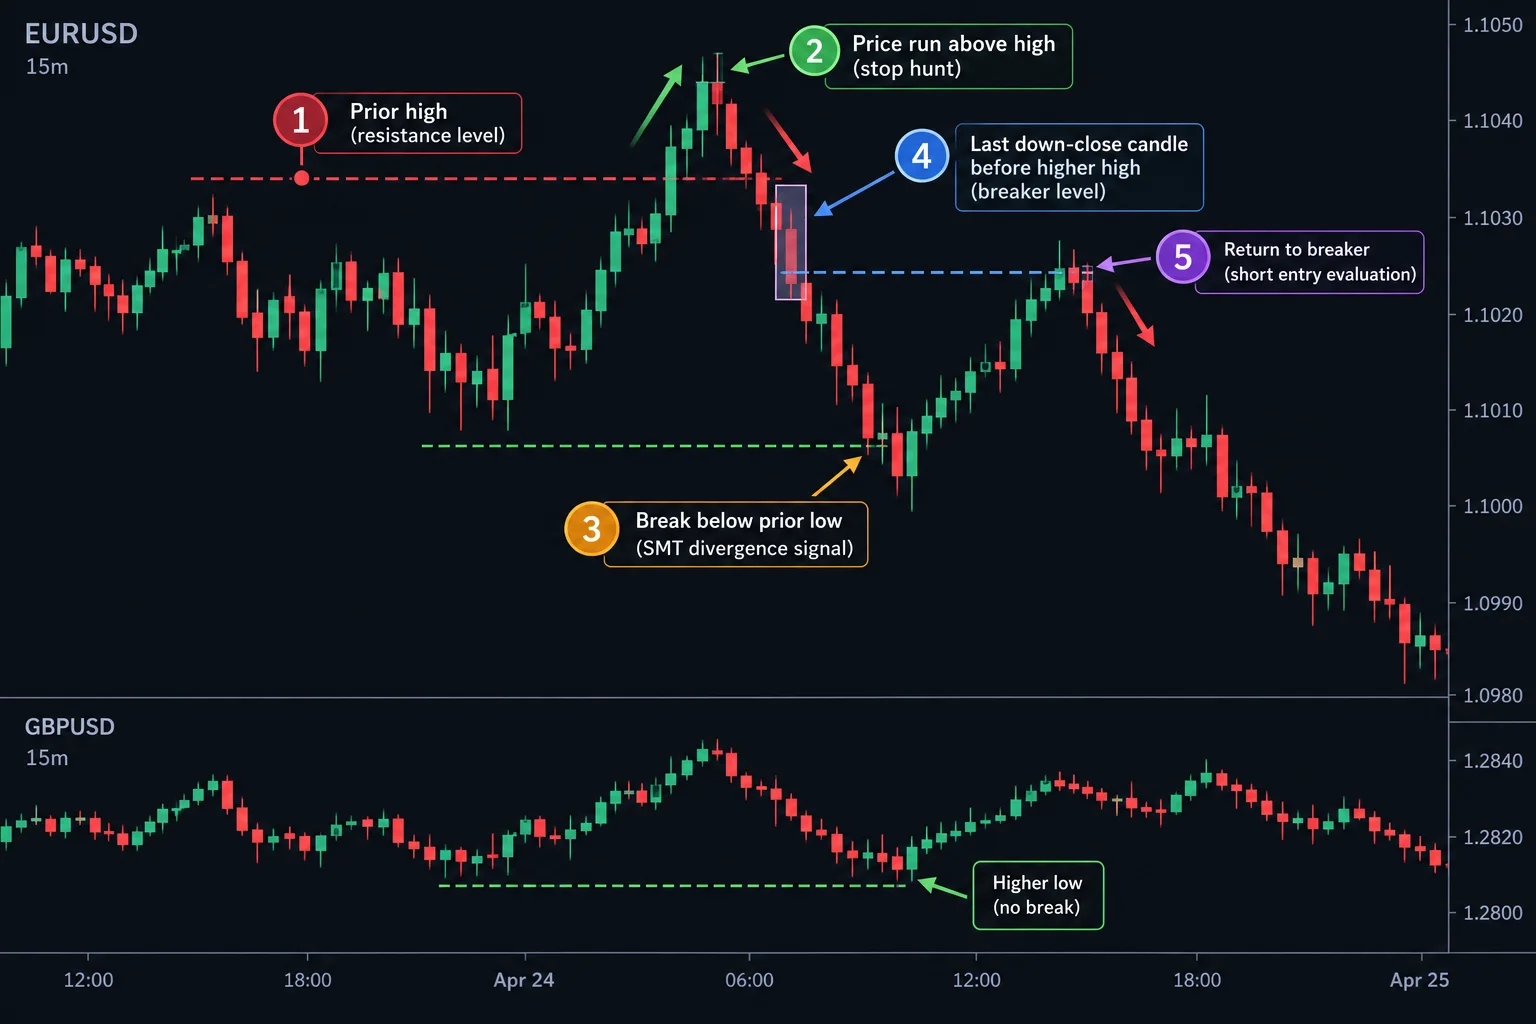
Rather than attempting to enter at the exact turning point, ICT introduces a more conservative sequence at 15:10. In the bearish example, price first trades above earlier highs, then falls through a prior low. ICT identifies the last down-close candle before the run to the higher high as a bearish “breaker.” He then waits for price to return to that candle’s area after the breakdown.
Within ICT’s model, the return to the breaker supplies a structured location for evaluating a short scenario, with the prior low acting as an initial objective in the example. This is his stated model, not a demonstrated universal rule. The transcript alone supplies no fills, exact risk figures or independent performance record.
ICT Price Action Across Correlated Market Ranges
ICT says this version of SMT is easiest to observe in range-bound conditions. Near 43:43, he recommends that beginners study ranges before trying to apply SMT in trends, where he says additional concepts are needed.
He also extends the comparison to currency selection. If one currency appears strong and another weak, he suggests examining the cross that pairs them. In a broader U.S. dollar consolidation, he argues that crosses may display larger relative moves than dollar majors. He mentions metals and grains as other possible comparison groups, while noting that not every metal maintains the same relationship.
How to Study ICT Price Action Responsibly
A useful educational exercise is to define two correlated instruments, mark corresponding swing highs and lows, and record where one confirms or fails to confirm the other. ICT strongly emphasizes screenshots, annotations and a journal at 18:16. A careful review should also record failed examples, market regime and how long the pattern took to develop, rather than selecting only successful historical cases.
The video’s main contribution is therefore a way to organize intermarket observation: establish context, identify a relevant liquidity area, compare correlated price swings, and wait for a separate structural confirmation such as ICT’s breaker. These are ICT’s interpretations of market behavior, not proof of institutional activity or a guaranteed trading edge. This material is educational and is not investment advice.
Watch the Source Video
▶ Watch on YouTube: “ICT Price Action: View Price With Institutional Perception” — the original lecture (53 minutes). Embedding is disabled by the video owner; watch directly on YouTube for the full chart examples.
Further Reading and Resources
- ICT Price Action: View Price With Institutional Perception (YouTube) — the primary source lecture on SMT divergence and breaker confirmation.
- TradingView — charting platform with multi-instrument comparison overlays for practicing SMT divergence on correlated pairs.
- The Inner Circle Trader (ICT) — official site with additional lectures, mentorship content and market commentary.
- CME Group: Introduction to Forex — institutional context for how currency markets function, including liquidity and order flow basics.




