
Key takeaways
ICT’s December 2017 “ICT On BitCoin” video is a historical case study applying his market-making framework to Bitcoin/USD — not a verified trading record or current outlook.
Read the full summary
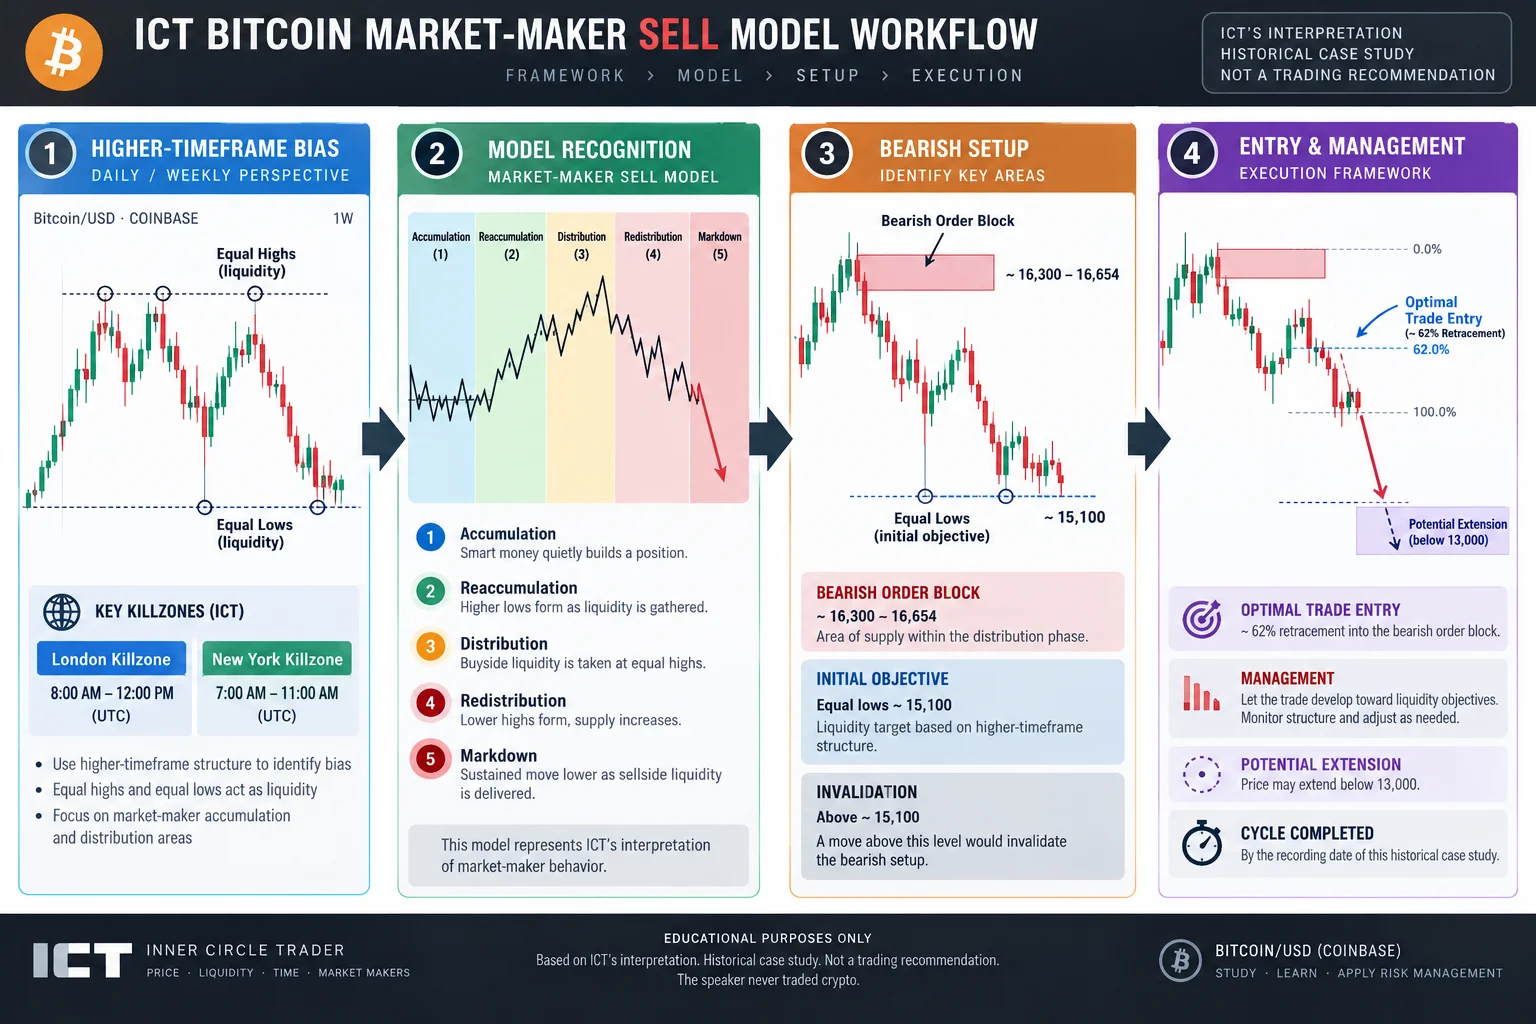
ICT’s December 2017 “ICT On BitCoin” video is a historical case study applying his market-making framework to Bitcoin/USD — not a verified trading record or current outlook. At the opening he explicitly discloses he has never traded cryptocurrency and had only studied it for about two weeks. The session maps London/NY session windows (8am–12pm London; 7am–11am New York), treats equal highs and lows as potential stop-liquidity zones, and outlines a market-maker sell model of accumulation, reaccumulation, distribution, redistribution and markdown centered near 16,300–16,654 (with 16,450 as the key resistance) and an initial objective near 15,100. A 62% retracement is mentioned as an entry concept. ICT also notes he called a high on December 17, 2017, that price reached near 16,450, and that the illustrated cycle completed by the recording; he promotes a 2017 mentorship with historical enrollment terms. The video provides no broker-confirmed fills, stop records, cost disclosure, performance results, or independent evidence of bank/algorithm involvement, so price targets, liquidity interpretations and smart-money attributions should be read as testable hypotheses rather than recommendations.
How we researched this article
BestProps used document-based research from primary firm sources, checked September 25, 2026. The complete source list, scope, limitations, and commercial-state record appear near the end of this article.
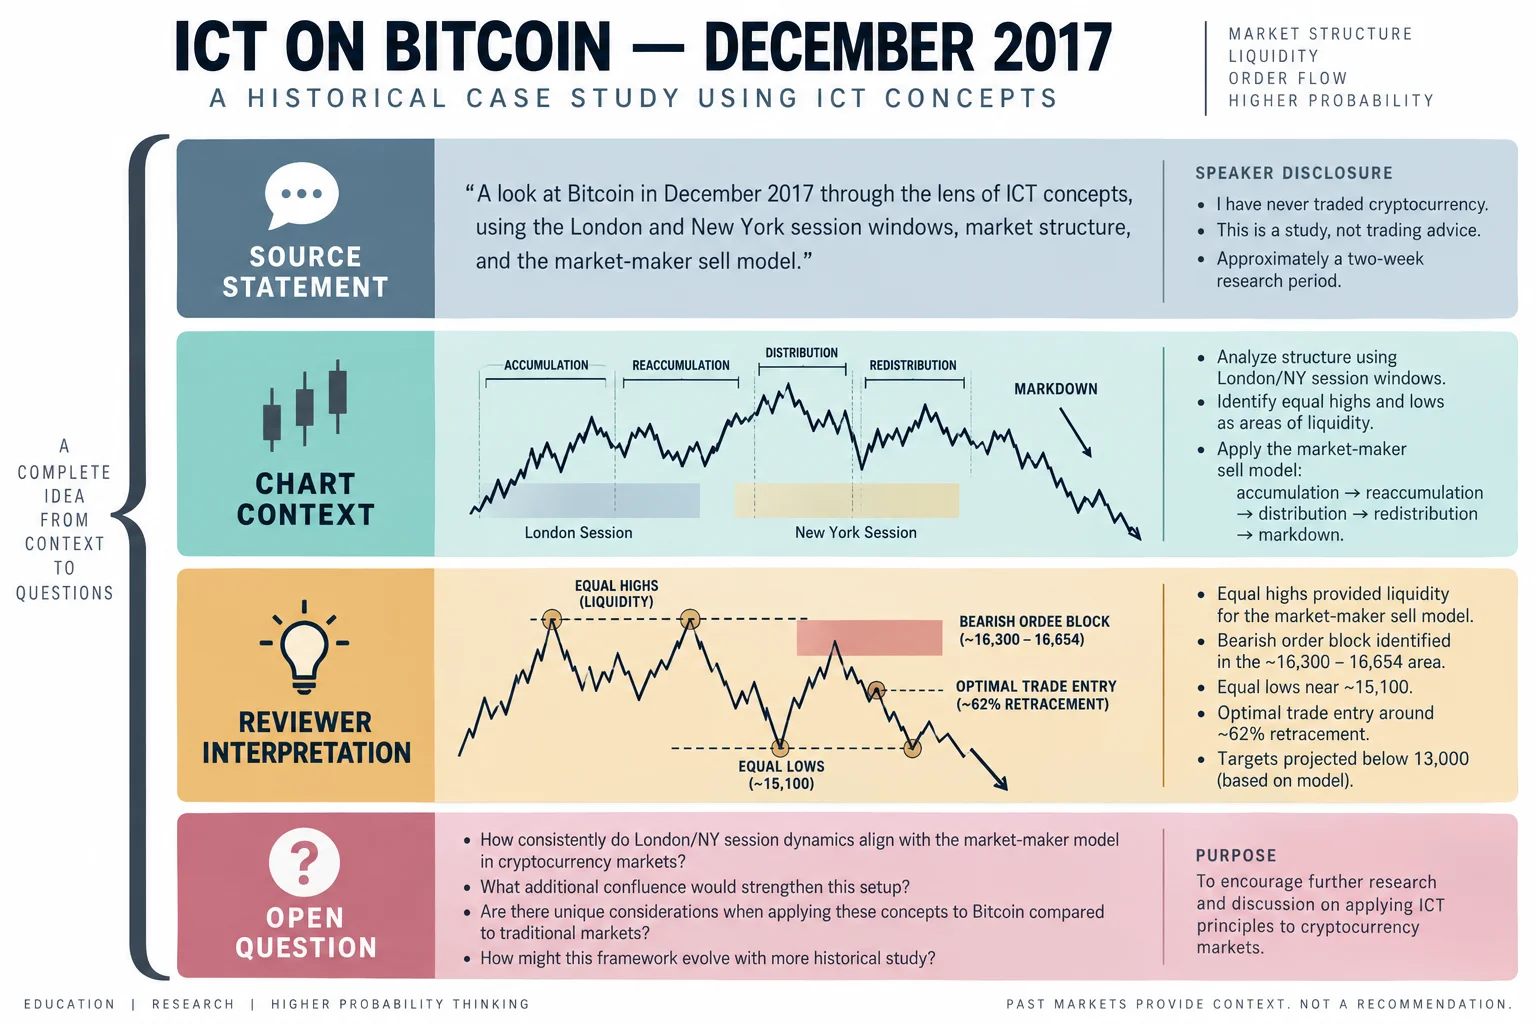
In ICT On BitCoin, uploaded on December 28, 2017, Inner Circle Trader applies his price-action vocabulary to Bitcoin during the volatile conditions of late December 2017. The video should not be read as a trading recommendation or a record of ICT trading cryptocurrency. At 0:30 he explicitly states he had never traded cryptocurrencies, had only recently given them a second look, and had been studying them for about two weeks.
That qualification changes how the rest of the recording should be evaluated. The presentation is a historical interpretation of a Coinbase chart at that moment in time, not an independent validation of a repeatable Bitcoin trading edge, and not a current outlook.
Session Context and Market Structure
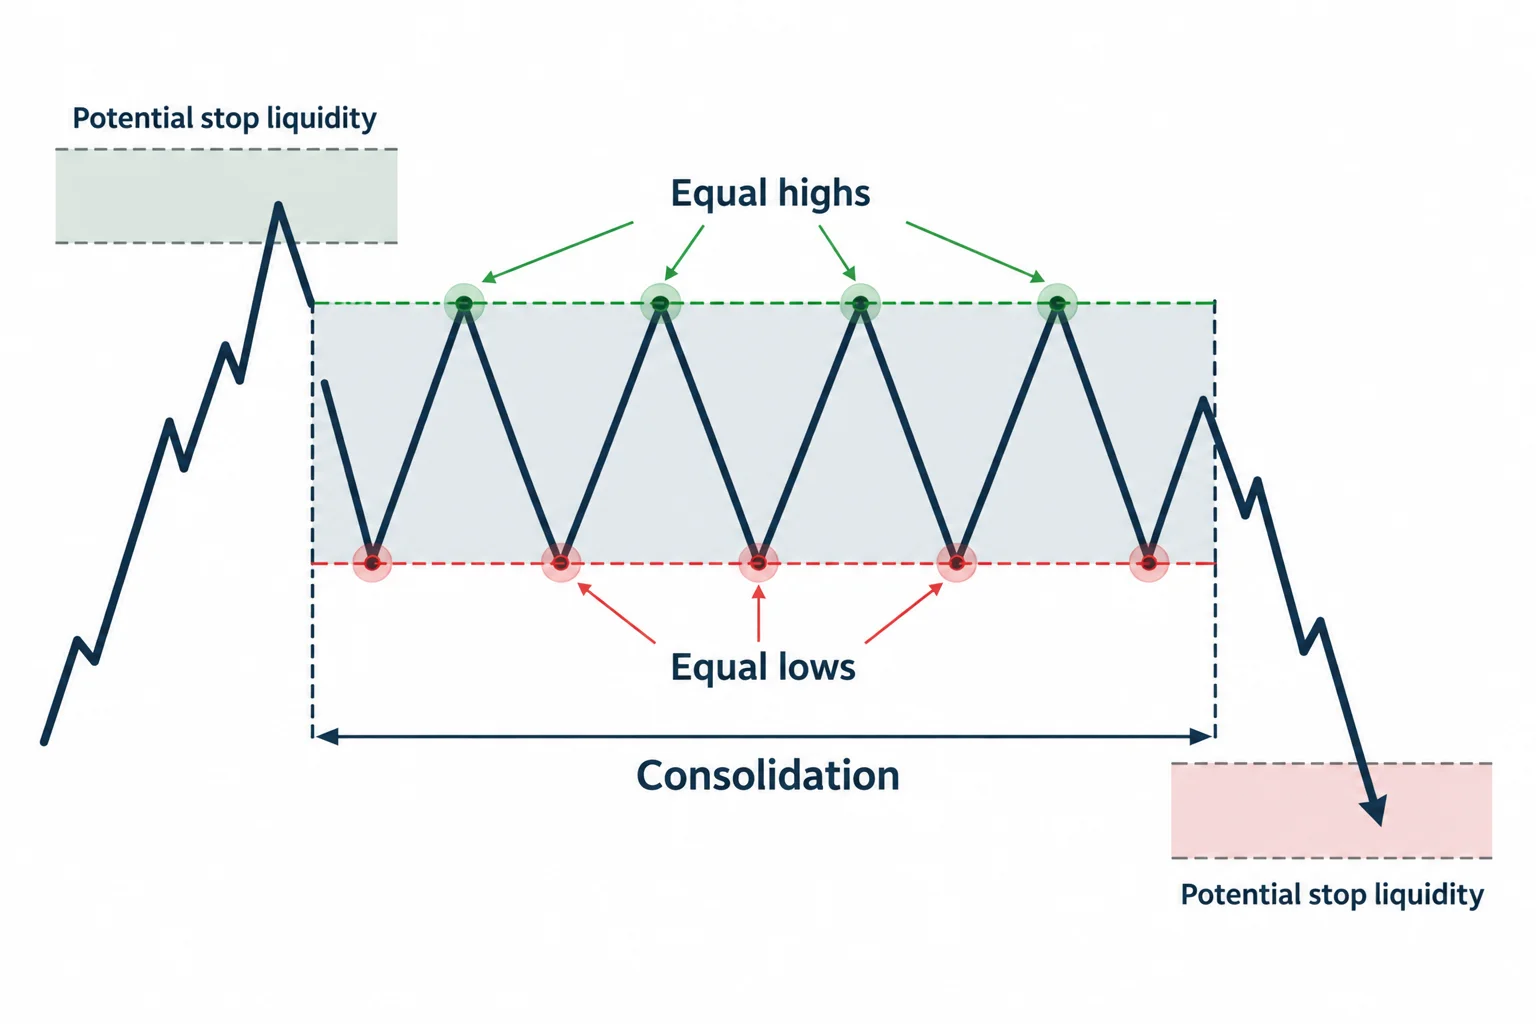
At 8:02 ICT describes his London session window (approximately 8:00 a.m. to 12:00 p.m. London time) and New York killzone (approximately 7:00 a.m. to 11:00 a.m. New York time) as the relevant time frames. At 9:04 he points to areas of consolidation and discusses equal highs and lows as potential stop-liquidity zones — a conceptual framework rather than a confirmed mechanism.
Market-Maker Sell Model on Bitcoin
Beginning around 6:17, ICT frames a rapid advance followed by a decline as “pricing in premiums for distribution.” In his interpretation, that sequence represents accumulation, reaccumulation, distribution, redistribution and eventually markdown — a market-maker sell model. At 9:56 he notes price reaching toward 16,450; at 14:32 he describes 16,450 as a resistance point; and at 31:00 he identifies a bearish order block with its high at 16,654 and its low at 16,300 — approximately in the middle near 16,450.
He also describes an initial downside objective near 10:47 the 15,100 area (equal lows) and notes that a recovery above roughly that level could act as invalidation. At 10:29 he introduces the optimal trade entry (OTE) concept as part of his framework, and at 13:21 references a 62% retracement as part of an entry structure.
At 32:38 he points toward the possibility of price moving below 13,000 (and possibly toward 12,000), framing it as a logical extension of the hypothetical downside rather than a confirmed target.
Speaker’s Own Qualifying Statements
The video contains several important self-qualifications that must not be omitted:
- At 2:22 he notes he called a high on December 17, 2017, and shows tweeted charts as public record.
- At 22:29 he says the full illustrated cycle completed by the recording — a reported outcome of the historical analysis, not a verified live fill.
- At 11:49 he promotes a 2017 mentorship and mentions it was “not free,” with historical enrollment terms rather than current pricing.
These distinctions matter. ICT’s interpretations of liquidity, order blocks and session windows are presented as his framework; the transcript does not establish that banks or algorithms directed price, that the described levels were filled, or that the sequence was repeatable.
Why Caution Matters
The video is valuable as an example of how ICT applies vocabulary — market-maker models, equal highs/lows, session windows, OTE — to a specific chart at a specific moment. It is not evidence that those concepts produce profitable, repeatable results in cryptocurrency markets. The recording contains no broker-confirmed execution details, no disclosed stop or cost records, no verified profitability evidence, and no independent verification of institutional involvement.
The closing portion also promotes a 2017 mentorship, community and historical enrollment terms. Those historical policies, prices and access structures should not be assumed to remain available or unchanged.
This commentary is independent educational material. It does not recommend buying, selling or holding Bitcoin or any other asset, and it does not claim that the described framework is profitable, reproducible, or suitable for any particular trader.
Watch the full video on YouTube
Watch ICT On BitCoin — December 28, 2017 on YouTube ↗Primary source and further reading
- The original Inner Circle Trader video (December 28, 2017): use the timestamp links in this article to compare the explanation with its source.
- YouTube’s embedding documentation: platform guidance relevant to the external watch link above.
- 17 CFR 4.41: disclosures concerning hypothetical performance: a regulatory reference, not a statement that this recording or article meets every legal requirement.
This is independent educational commentary. It is not official ICT material, a tested trading system, or a claim that the described framework is profitable or reproducible.




