
Key takeaways
ICT presents seasonality as a contextual roadmap rather than an entry signal, requiring alignment among existing directional bias, a recurring calendar tendency and confirming market structure, with the US Dollar Index serving as a macro filter for commodities.
Read the full summary
ICT presents seasonality as a contextual roadmap rather than an entry signal, requiring alignment among existing directional bias, a recurring calendar tendency and confirming market structure, with the US Dollar Index serving as a macro filter for commodities. Using conditions observed on January 12, 2021, the lesson treats a falling dollar as supportive of currencies and commodities and examines dollar weakness from around July 2020 alongside coffee’s tendency to rally during the second or third week of July. The coffee example combines relative equal highs as buy-side liquidity, a break above a short-term high as a bullish structure shift, a return to a down-close candle as a bullish order block and an optimal trade entry retracement targeting prior highs and an extension objective. ICT says bullish seasonality matters more when coffee is already bullish, while a brief seasonal rally during a downtrend may instead support bearish continuation. Traders should compare tendencies across five, ten or more years, distinguish continuous front-month charts from individual contracts such as March 2021 coffee, and define execution, risk, exits and stop-losses separately because seasonality supplies none of them. Soybeans and corn are also discussed, but the lesson provides no independently validated trade, realized profit or proof that the framework is profitable.
How we researched this article
BestProps used document-based research from primary firm sources, checked September 25, 2026. The complete source list, scope, limitations, and commercial-state record appear near the end of this article.
In ICT Price Action Lesson: Major Moves With Seasonal Tendencies, ICT presents seasonal analysis as a source of context rather than a standalone trading signal. The lesson focuses mainly on commodities, especially coffee, while also discussing the US Dollar Index, soybeans and corn. ICT’s central argument is that a seasonal tendency becomes more useful when it agrees with the market’s existing direction, broader macro conditions and market structure.
The video was uploaded on January 13, 2021. During the recording, ICT identifies the date as January 12, 2021. References to market conditions and contracts should therefore be understood in that historical setting.
Watch the full lesson: ICT Price Action Lesson: Major Moves With Seasonal Tendencies on YouTube (54 minutes). The video covers the Dollar Index, soybeans, corn, and a detailed coffee seasonal example.
ICT Seasonal Tendencies as a Price Action Roadmap
ICT defines a seasonal tendency as a generalization drawn from behavior observed during similar calendar periods in prior years. He explicitly cautions that the expected behavior will not occur every time. That qualification is essential: a seasonal window indicates what has happened with some regularity, but it does not establish what must happen next.
At 1:13, he describes seasonality as a “road map” and discusses comparing tendencies over multiple historical windows, such as five, ten or more years. In practical educational terms, this makes seasonality a hypothesis to investigate (not an entry instruction).
ICT Price Action and the Dollar’s Macro Role
ICT begins his analysis with the Dollar Index. At 3:08, he explains his risk-on/risk-off framework: a declining dollar is treated as supportive of foreign currencies and commodity prices, while a rising dollar is treated as a headwind.
This is ICT’s market interpretation, not an invariant rule. Currency and commodity relationships can vary across instruments and periods. Within the lesson, however, the dollar provides a directional filter. ICT uses the dollar weakness visible from around July 2020 as the macro backdrop for examining bullish commodity moves.
Three Signals Behind Major Seasonal Moves
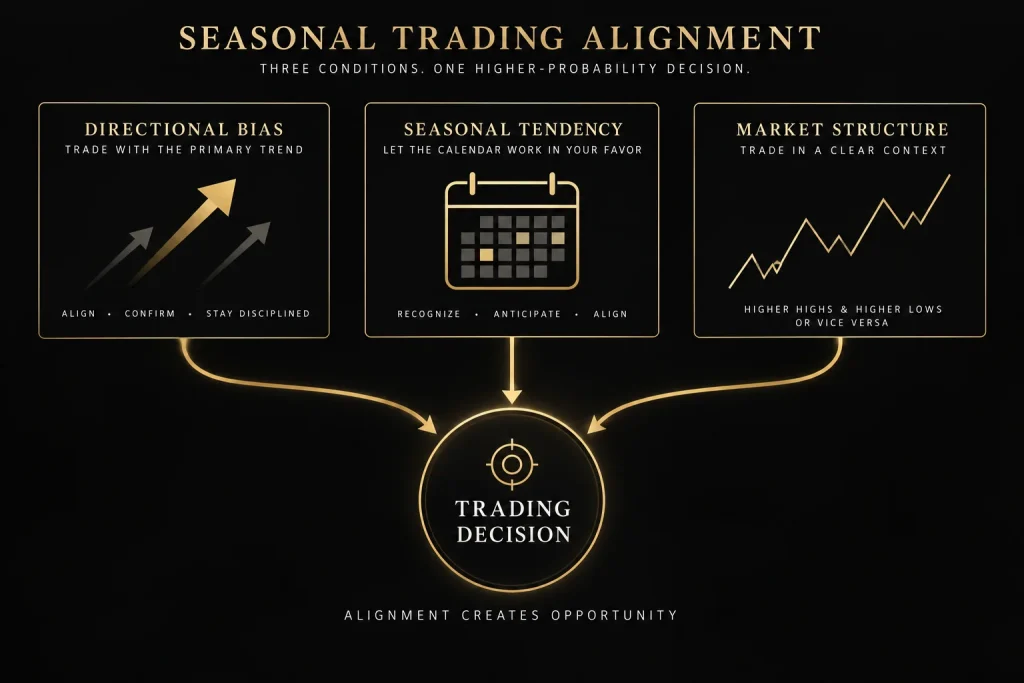
The most transferable part of the lesson appears at 13:13. ICT says a bullish seasonal tendency means little by itself. His proposed process waits for three elements to agree:
- Directional context: The market is already judged to be bullish or bearish.
- Seasonal tendency: Historical behavior favors movement in that same direction during the relevant calendar window.
- Market structure: Price action subsequently confirms the directional thesis in ICT’s framework.
The Dollar Index acts as an additional macro filter for commodities. For a bullish commodity thesis, ICT prefers a bearish dollar backdrop; for a bearish commodity thesis, he describes a bullish dollar as supportive. The framework is therefore conditional rather than “buy whenever the seasonal date arrives.”
ICT Price Action in the Coffee Seasonal Move
Coffee is the lesson’s main worked example. Beginning at 30:49, ICT identifies a tendency for coffee to rally around the second or third week of July. He combines that window with the weak-dollar context he observed in July 2020.
He then interprets the chart using concepts from his own methodology:
- Relative equal highs are treated as a potential pool of buy-side liquidity.
- A break above a short-term high is interpreted as a bullish market-structure shift.
- A return to a down-close candle, labeled a bullish order block by ICT, supplies a possible area of interest.
- An “optimal trade entry” retracement is used to frame continuation toward the prior highs and an extension objective.
These labels reflect ICT’s interpretation of the historical chart. The transcript does not independently validate the method or document an executed trade. Although ICT calculates hypothetical contract movement from chart levels, that calculation is not evidence of an actual fill, realized profit or reproducible outcome.
Why Prior Price Action Matters for Seasonal Moves
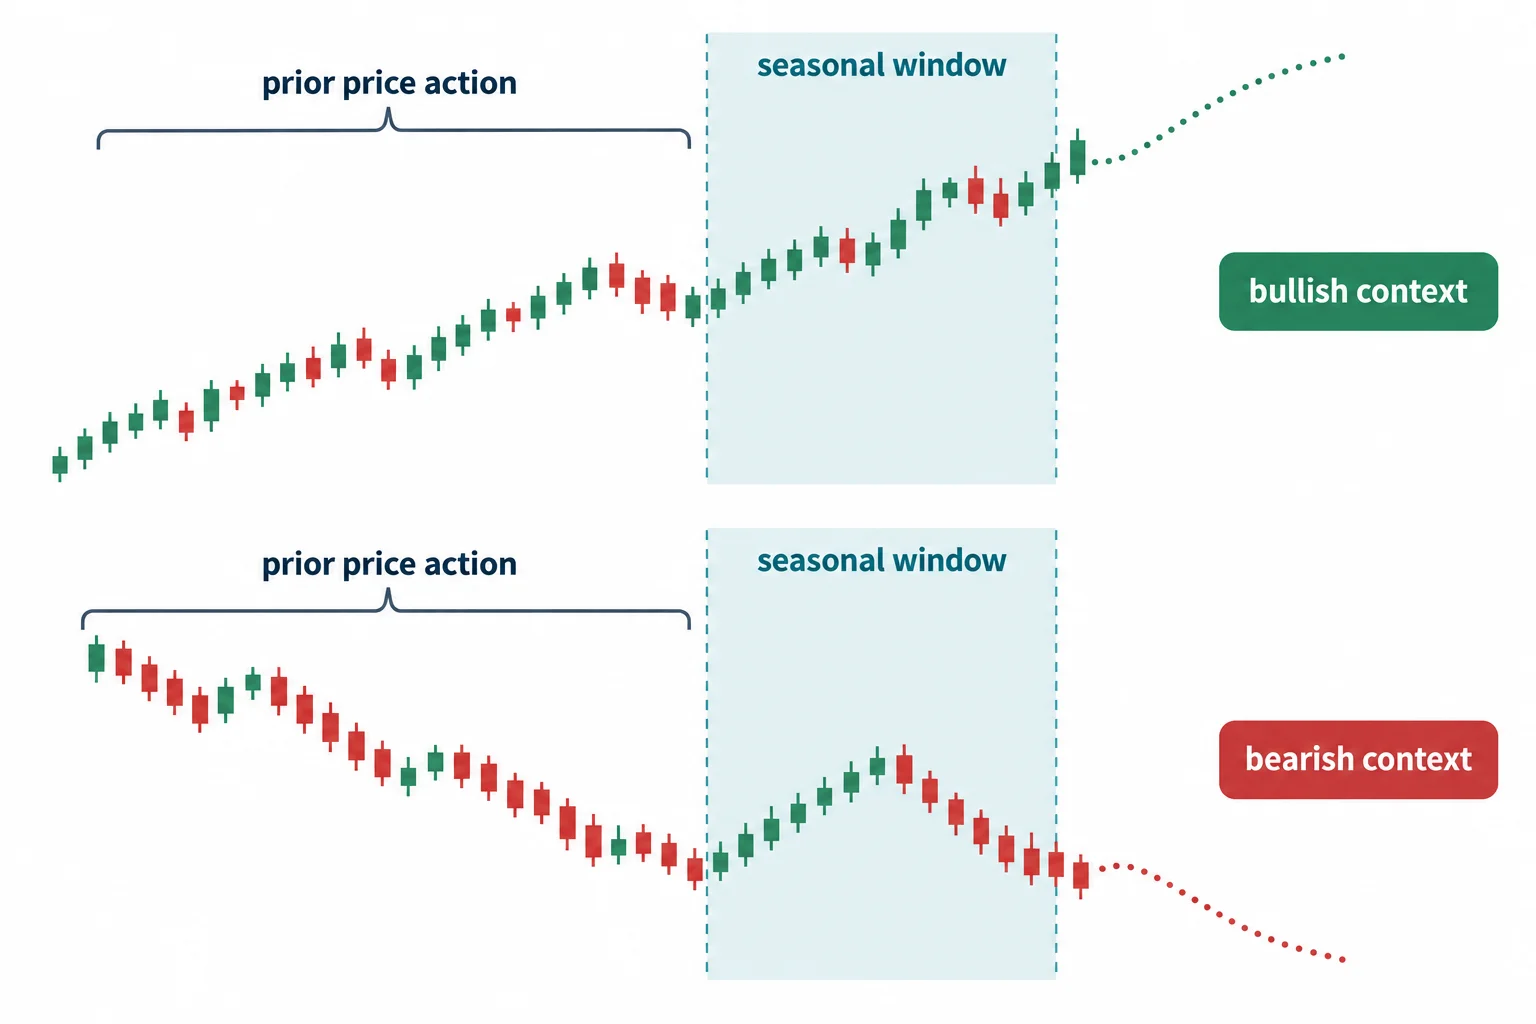
ICT returns to the coffee chart near 43:58 to address years in which the mid-July tendency did not produce a sustained rally. His response is to examine what coffee had been doing before the seasonal window.
If coffee was already bullish, he considers the bullish July tendency more relevant. If it had been declining, he says traders should not automatically expect the seasonal window to reverse the trend. A brief seasonal rally in a bearish market could instead become, in his framework, an opportunity to study bearish continuation. He summarizes that inversion more directly at 53:12.
This distinction guards against a common research error: selecting favorable years while ignoring conflicting observations. A more disciplined study would define “bullish,” the seasonal date range and the confirmation condition before reviewing examples.
Seasonal Price Action on Continuous and Individual Futures Charts
At 37:41, ICT notes that commodity futures contracts expire. He contrasts a continuous front-month chart with the individual March 2021 coffee contract and says the relevant highs may appear differently on each.
This is an important chart-reading caution. A continuous series combines successive contracts, while an individual contract contains only its own trading history. The transcript does not specify the continuous-series adjustment method, so apparent levels should not be assumed to match across data providers or chart constructions.
Key ICT Lesson for Trading Seasonal Moves
The lesson’s core sequence can be reduced to a research checklist:
- Identify a historically recurring seasonal window.
- Determine the higher-time-frame direction before that window.
- Check whether ICT’s dollar-based macro filter supports the commodity thesis.
- Wait for market structure to align instead of treating the calendar as an entry signal.
- Review the correct futures contract as well as any continuous chart.
- Define risk and execution rules separately, because seasonality provides neither by itself.
ICT explicitly acknowledges at 50:25 that a seasonal tendency does not provide an entry, exit or stop-loss rule. The video is best understood as a lesson in building directional context. It does not establish that the framework is profitable, and it should not be read as investment advice or a promise of future performance.
Further Reading and Resources
- CME Group Coffee Futures Contract Specifications — Official exchange documentation for the coffee futures contract, including contract size, tick value, and trading months. ICT references the March 2021 contract in the lesson.
- How I Made One Million Dollars Last Year Trading Commodities by Larry R. Williams — The book ICT recommends during the lesson (at approximately 21:56) for foundational commodity trading education. Linked for reference only; no affiliate relationship.



