
Key takeaways
ICT’s retrospective USD/CAD demo frames a bearish London-session scalp using a daily bearish order block, market maker sell profile, intraday liquidity, an Optimal Trade Entry retracement, and Fibonacci projections.
Read the full summary
ICT’s retrospective USD/CAD demo frames a bearish London-session scalp using a daily bearish order block, market maker sell profile, intraday liquidity, an Optimal Trade Entry retracement, and Fibonacci projections. The normalized London kill zone runs from 1 a.m. to 5 a.m. New York time with daylight saving adjustment, while the OTE spans the 62% to 79% retracement of the preceding downswing. After an Asian-range consolidation and post-midnight rally into that zone, ICT looked below nearby lows, using an intraday low, a symmetrical projection, the 200% Fibonacci extension, the previous day’s low, and Monday’s low as layered objectives. He remained cautious because USD/CAD, EUR/USD, GBP/USD, and the US Dollar Index showed consolidation or unclear direction, and at 7 minutes 2 seconds said he was unwilling to hold for the previous day’s low. The lesson is not to sell every OTE retracement, but to combine timing, structure, liquidity, higher-time-frame context, invalidation, and reduced expectations when conditions are muddy. The transcript provides no independently verifiable edge, executions, fills, exact prices, or confirmation that projected targets were reached.
How we researched this article
BestProps used document-based research from primary firm sources, checked September 25, 2026. The complete source list, scope, limitations, and commercial-state record appear near the end of this article.
In ICT – London OTE Demo Scalping Example – UsdCad, ICT reviews a USD/CAD session and explains how he framed a bearish London-session setup. His commentary combines an Optimal Trade Entry (OTE) retracement, intraday liquidity, Fibonacci-based projections, a higher-time-frame bearish order block, and what he calls a market maker sell profile.
This is a retrospective explanation of ICT’s interpretation, not independent proof that these concepts produce a trading edge. The transcript also cannot confirm unseen chart details, executions, fills, or the market’s later path.
ICT USDCAD Market Context
ICT begins by discussing a prior run above the previous day’s high and a subsequent decline back toward consolidation. At 0:42, he labels a sequence that includes consolidation, reaccumulation, reversal, a “low risk sell,” distribution, and redistribution. These are ICT’s classifications of the price structure visible on his chart.
He then identifies the previous day’s low as a possible downside objective. He is notably conditional rather than certain: although he sees the possibility of another selloff, he says the market’s symmetry made him less optimistic. Around 1:51, he discusses a symmetrical price swing that would project beneath the prior day’s low and mentions another potential liquidity level.
The automatically recognized numbers in this section may lack decimal formatting, so they should be checked against the original chart rather than treated as verified prices.
London OTE Scalping Setup
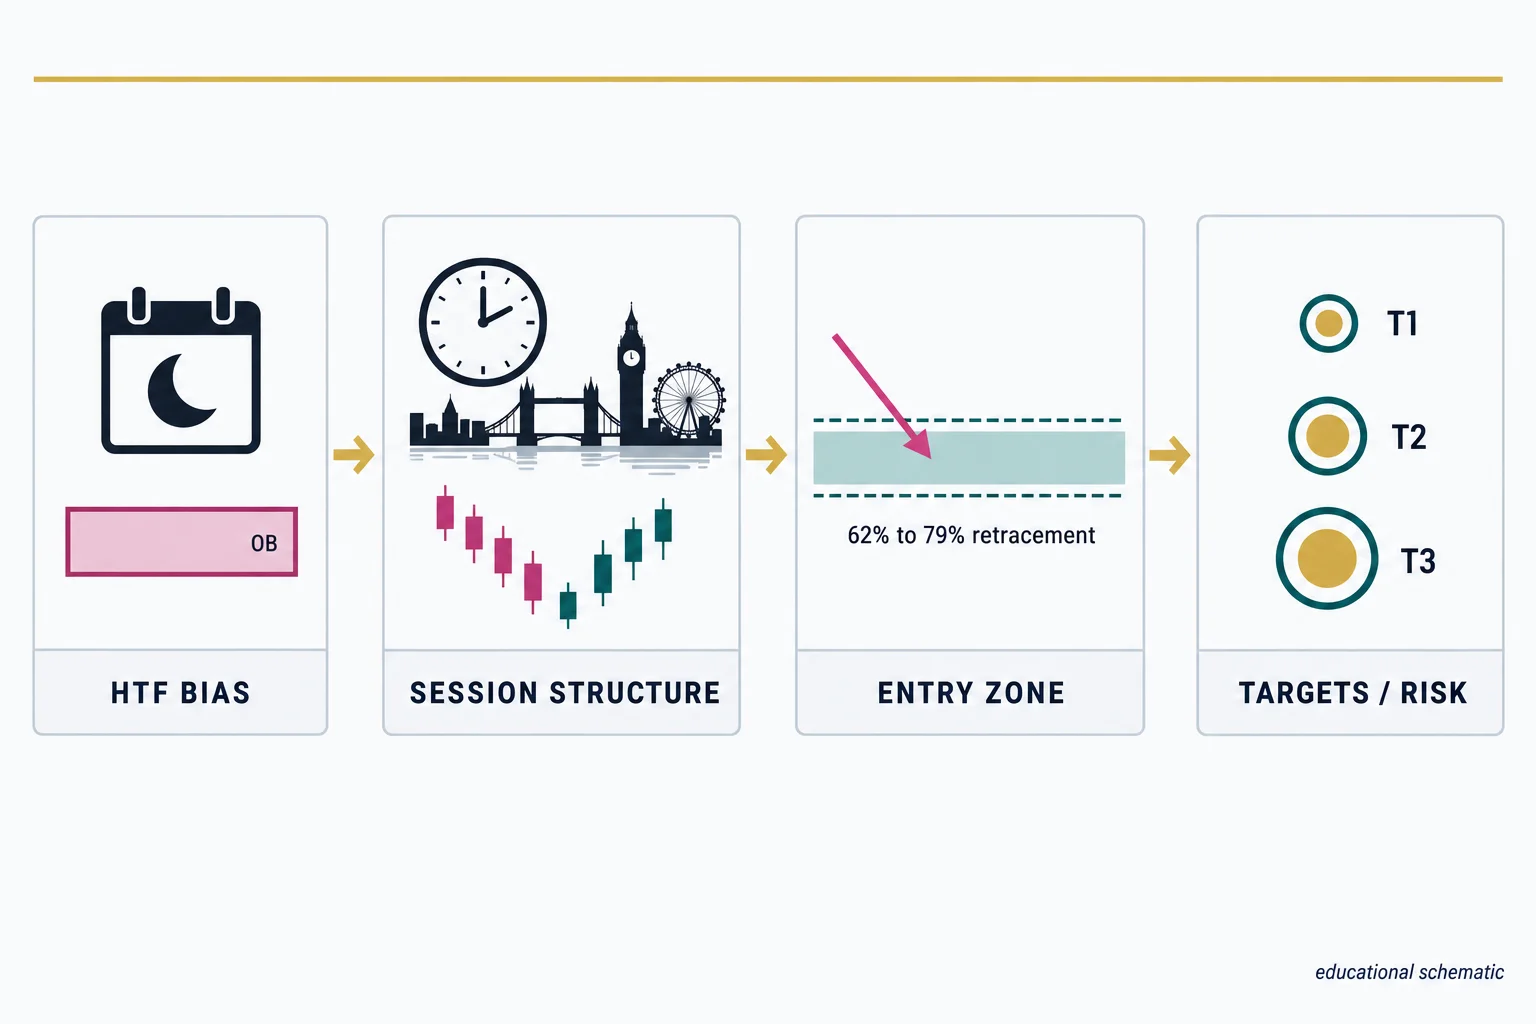
At 2:45, ICT defines the session window shown on his chart. His normalized London “kill zone” runs from 1:00 a.m. to 5:00 a.m. New York time, with the chart adjusted for daylight saving time.
His intraday narrative is:
- USD/CAD first makes a downward price swing.
- Price consolidates during what he identifies as the Asian range.
- After midnight New York time, price retraces upward.
- That retracement enters the OTE area associated with the preceding downswing.
- ICT then looks for continuation below nearby lows rather than treating the rally as a new bullish move.
At 4:07, he defines the OTE used in this example as the 62% to 79% retracement zone. He notes that price overshot part of the area, but says the candle bodies still respected what he regarded as the higher-probability entry region.
In general educational terms, this is a pullback-continuation model: establish a directional premise, measure a retracement against the prior impulse, and then assess whether price resumes in the original direction. The important qualification is that the retracement ratio alone is not presented as the complete setup. ICT combines it with session timing, surrounding market structure, liquidity objectives, and higher-time-frame context.
ICT USDCAD Downside Targets
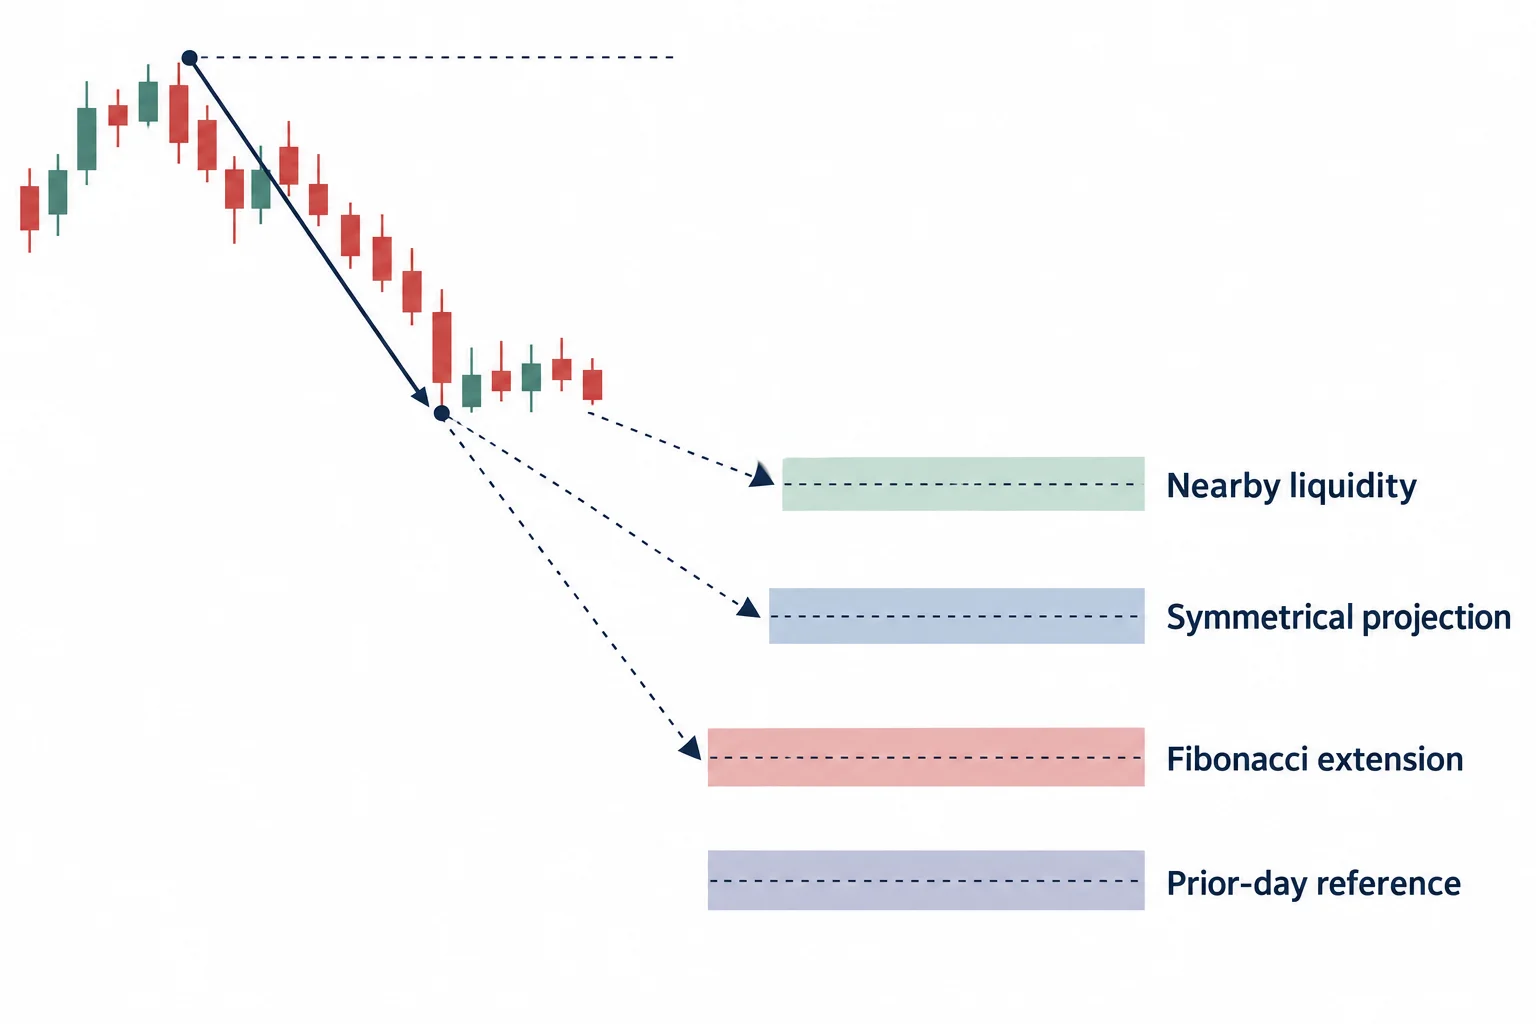
ICT describes several potential objectives rather than relying on a single target. At 4:30, he highlights a 200% Fibonacci extension and the area beneath existing lows. He also identifies a nearer intraday low because the larger extension might not be reached.
- Nearby liquidity: a move below an intraday low.
- Symmetrical projection: a measured swing projected lower.
- Fibonacci extension: the 200% extension of the selected price swing.
- Prior-day reference: the previous day’s low, which was close to one of his projected areas.
This layered approach separates nearer objectives from more ambitious ones. However, the transcript does not provide verifiable order records or enough visual information to reconstruct exact entries and exits.
Why ICT Approached USDCAD Cautiously
ICT characterizes the New York session as muddy and difficult. Beginning around 5:35, he says some viewers may have attempted another setup and been stopped out. He calls that possibility a learning experience rather than presenting every OTE-like retracement as valid.
He supports his caution with intermarket observations: EUR/USD appeared directionless, GBP/USD had declined before consolidating, and the US Dollar Index was also trading without clean direction. He interprets the relative behavior of sterling and the euro as supportive of a bullish EUR/GBP view, but this is incidental context rather than the main USD/CAD lesson.
Most importantly, at 7:02, ICT says market conditions made him unwilling to hold for the previous day’s low. The example therefore emphasizes adapting expectations to consolidation instead of assuming the farthest projected objective must be reached.
ICT USDCAD Higher Time Frame Outlook
ICT moves to the daily chart at 7:15. He says the broader market was consolidating and identifies what he calls a bearish order block that price had recently entered. He combines that interpretation with the intraday sell-profile sequence discussed earlier.
From his perspective, this created a reason to watch for movement toward the prior day’s low and Monday’s low as possible liquidity areas. Yet he explicitly states that price did not have to reach either one and could instead reverse higher. That caveat is central to the lesson: projected liquidity and extension levels are scenarios, not guaranteed destinations.
London OTE Scalping Lessons
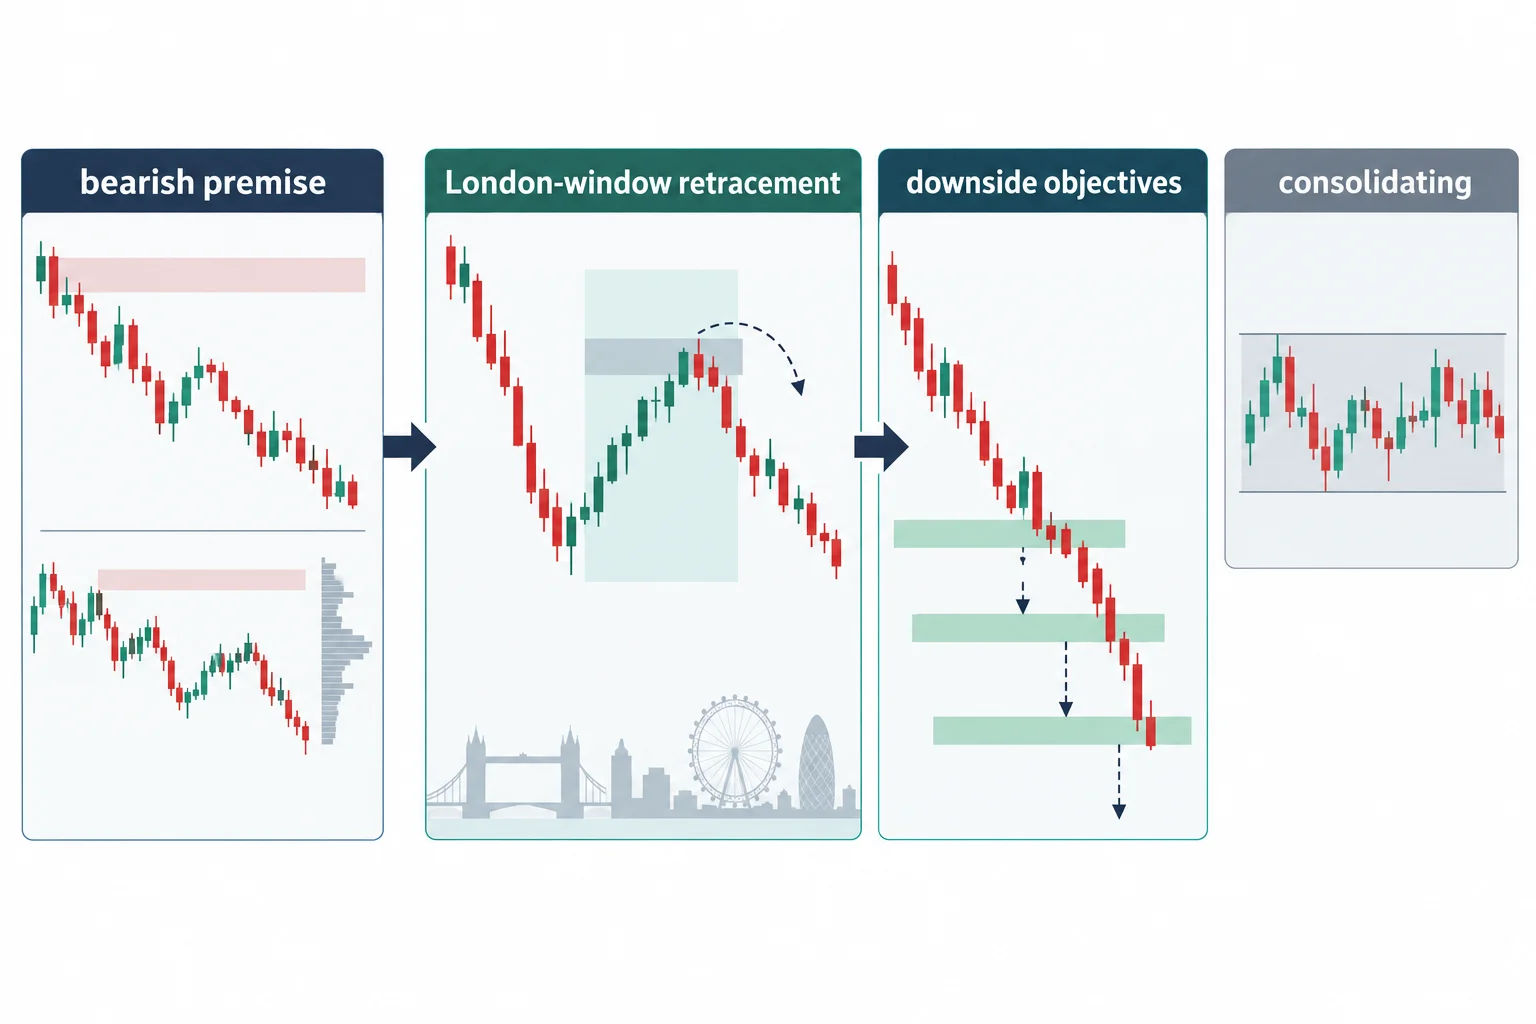
The video’s specific framework is broader than “sell whenever price reaches 62% to 79%.” ICT first forms a bearish premise from the daily-chart context and intraday profile, observes a London-window retracement, and then maps multiple downside objectives. He also reduces his expectations because the surrounding markets are consolidating and direction is unclear.
For study purposes, viewers can use the example to examine how a trading narrative is assembled across time frames. Any such narrative should still be tested independently, with attention to invalidation and risk. This summary is educational commentary only and is not investment advice or a performance claim.
Watch the Original Lesson
Related Resources
- ICT – London OTE Demo Scalping Example – UsdCad — the primary source lesson summarized in this article.
- ICT – OTE Primer: Intro To Optimal Trade Entry — ICT’s own foundational walkthrough of the OTE model referenced throughout this example.
- The Inner Circle Trader on YouTube — ICT’s channel, with the full library of original lectures and demo sessions.



