
Key takeaways
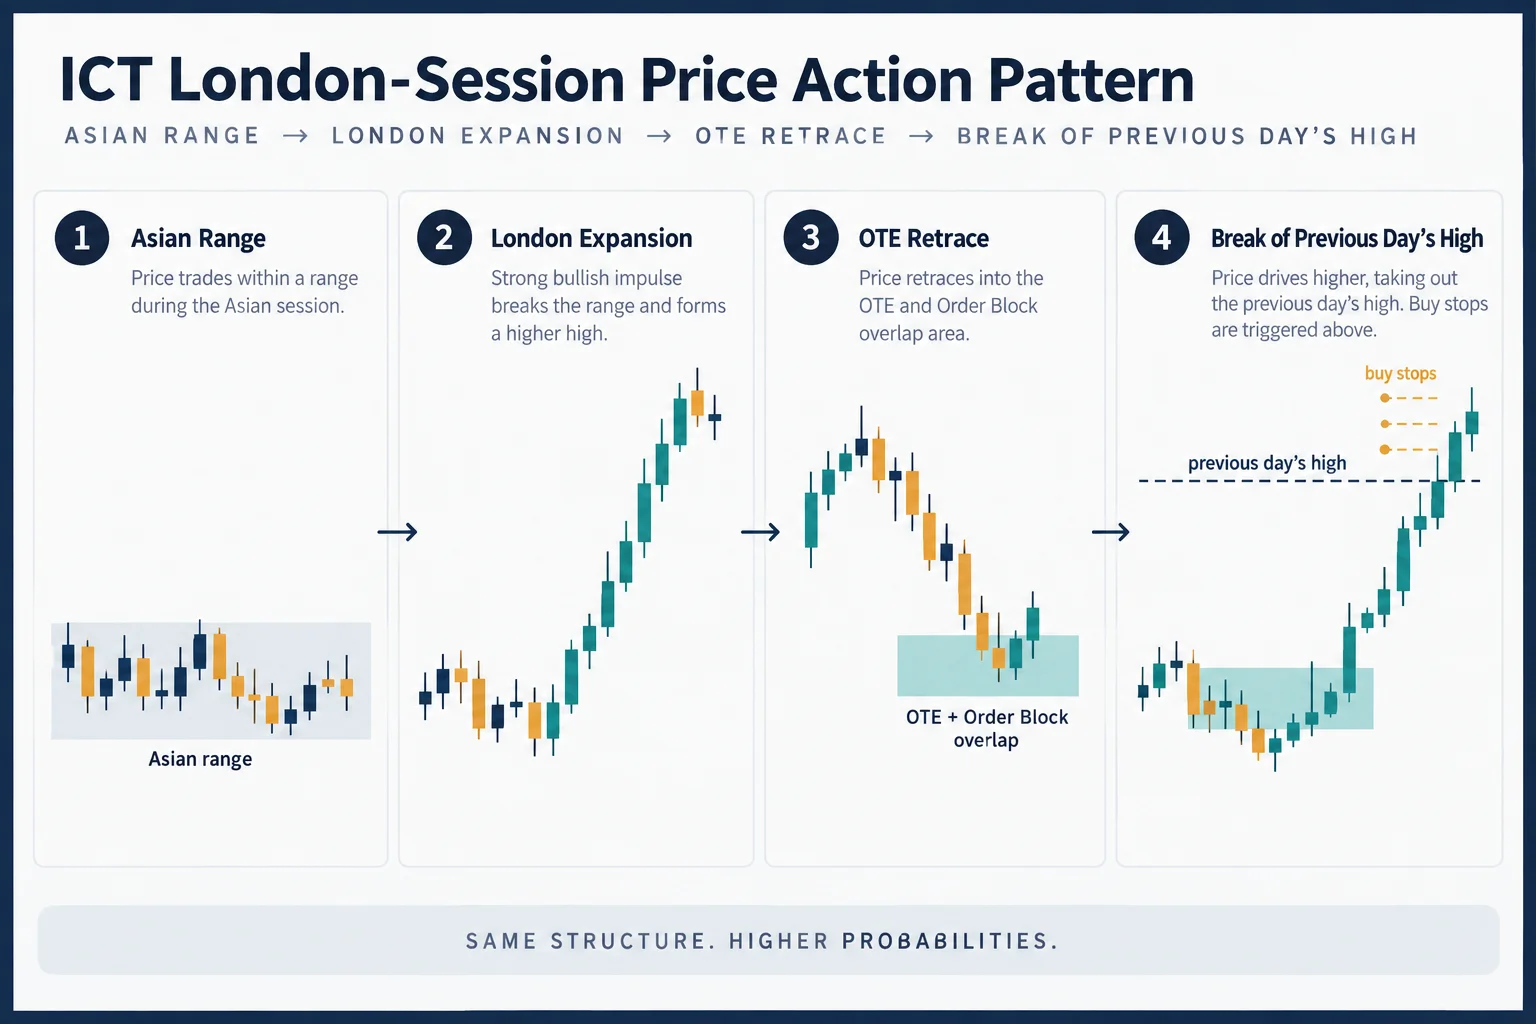
ICT presents a brief London-session chart example in which price starts inside the Asian range, forms a bullish impulse, retraces into an optimal trade entry or OTE overlapping an order block, breaks a short-term high as a bullish market-structure shift, and expands toward the previous day’s high where buy stops are expected.
Read the full summary
ICT presents a brief London-session chart example in which price starts inside the Asian range, forms a bullish impulse, retraces into an optimal trade entry or OTE overlapping an order block, breaks a short-term high as a bullish market-structure shift, and expands toward the previous day’s high where buy stops are expected. At 23 seconds he introduces the indicator-free chart, around 44 seconds he identifies the OTE retracement, at 1 minute 26 seconds he notes its convergence with the order block, at 1 minute 47 seconds he distinguishes the short-term high from the prior-day high, and around 2 minutes 18 seconds price moves through that objective. ICT describes the roughly 20-pip move as sufficient for an intraday scalp and encourages visual pattern recognition rather than dependence on Fibonacci tools, but the example omits the instrument, prices, execution, risk limits, spread, invalidation rules, verified fills, and performance evidence, so it is educational interpretation rather than proof of a reliable edge.
How we researched this article
BestProps used document-based research from primary firm sources, checked September 25, 2026. The complete source list, scope, limitations, and commercial-state record appear near the end of this article.
In Pattern Recognition – London Open OTE & Order Block, ICT narrates a short London-session price-action example. His central lesson is not merely to plot a Fibonacci retracement or mark a named setup. Instead, he encourages viewers to develop visual recognition of a retracement, an order block, a short-term structural shift, and a potential draw toward a prior high.
The recording is a compact teaching example rather than a complete trading plan. The transcript does not provide the instrument, visible prices, execution details, risk limits, spread, or a verifiable account statement. Accordingly, the discussion is best understood as an explanation of ICT’s interpretation of the chart shown in the video, not independent evidence that the method has a reliable trading edge.
ICT Pattern Recognition in the London Open Asian Range
At 0:23, ICT describes the example as his London-session trade and says price was inside the Asian range when he entered. He deliberately presents the chart without indicators, asking viewers to concentrate on price movement itself.
That context matters within his framework. The Asian range supplies a session reference, while the London period is where he is observing the subsequent movement. However, this short transcript does not define the range’s exact start and end times or establish a universal rule for trading every London open.
ICT Pattern Recognition for OTE and Order Block Entries
Beginning around 0:44, ICT says price trades down into what he calls an optimal trade entry, commonly abbreviated OTE. He tells beginners that a Fibonacci tool may initially help, but he does not want it to become a crutch. The exercise is to watch an upward impulse and then recognize its retracement visually.
The sequence he describes is:
- An impulse swing develops upward.
- Price retraces from that swing rather than being chased at its higher location.
- The retracement reaches an area ICT identifies as both an OTE and an order block.
- That overlap becomes the location he wants viewers to study.
At 1:15, he emphasizes waiting for price to drop into the area. Around 1:26, he says the order block and optimal trade entry converge. He then interprets the reaction and revisit as price collecting or “picking up” orders. That language reflects ICT’s market model; the transcript alone cannot verify the actual order flow behind the movement.
ICT Pattern Recognition for Short-Term Structure and Prior Highs
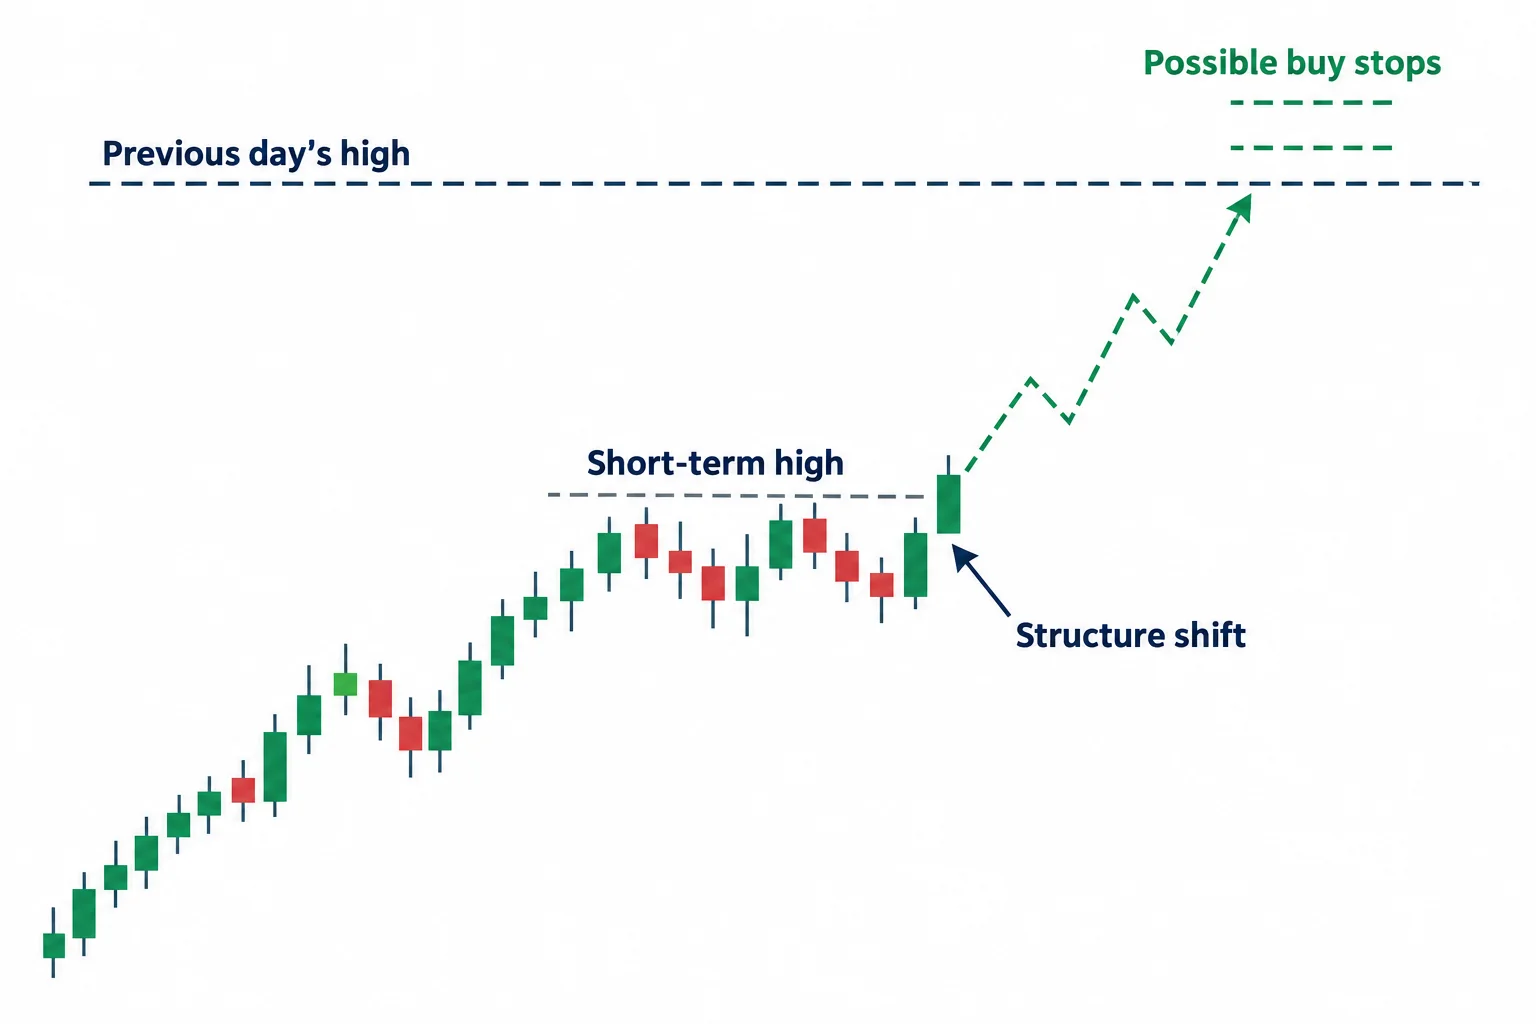
The previous day’s high is the stated objective from early in the lesson. At 1:47, ICT distinguishes a nearby short-term high from the previous day’s high. He characterizes a break of the short-term high as a bullish market-structure shift.
He then explains that buy stops are expected above the previous day’s high and treats that high as a draw for price. From 2:05, the narration follows price toward that reference. At approximately 2:18, he says price pushes through the prior-day high.
This produces the full pattern described in the clip: session context, bullish impulse, retracement into a proposed OTE/order-block overlap, a break of a short-term high, and expansion toward the prior-day high. It is a retrospective explanation of the displayed example, not proof that every similar formation will behave the same way.
ICT Pattern Recognition Lessons From the London Open Setup
From 2:28, ICT acknowledges that the illustrated movement is modest. He calls it sufficient for an intraday scalp and mentions roughly 20 pips, but the automated transcript and lack of chart verification prevent confirmation of the exact distance, instrument, or achievable fill.
His concluding educational point is that the same perceived ebb-and-flow pattern can be sought on higher time frames, where it may take longer to unfold. A cautious study approach would be to label each element separately (impulse, retracement zone, order-block interpretation, short-term high, and prior-day high) rather than treating the names alone as an entry signal. Any practical evaluation would also need explicit invalidation, transaction costs, risk controls, and testing across many examples, none of which are covered in this brief video.
This summary is educational commentary on ICT’s presentation and is not investment advice or a performance claim.
Watch the original lesson on YouTube
The video cannot be played inside another website: when its embedded player was opened and clicked on 22 September 2026, the player itself reported “Playback on other websites has been disabled by the video owner.” and settled on a “Watch on YouTube” prompt, with no playback progress reported. That is the reason no embed is reserved or left blank here; the recording itself is available directly on YouTube.
Watch Pattern Recognition – London Open OTE & Order Block on YouTube ↗
Primary source and further reading
- The original Inner Circle Trader lesson: use the timestamp links in this article to compare the explanation with its source.
- Optimal Trade Entry (OTE): Fibonacci Meets SMC — an independent educational explainer of the OTE retracement idea and how it is commonly combined with order blocks in SMC practice.
- ICT Liquidity — Where Stops Sit & How Price Hunts Them — an independent, unofficial ICT reference explaining buy-side and sell-side liquidity and how prior highs/lows act as draw targets.
- YouTube’s embedding documentation: platform guidance relevant to the external watch link above.
This is independent educational commentary. It is not official ICT material, a tested trading system, or a claim that the reported results can be reproduced. The third-party explanation links above are unofficial sources and are not affiliated with or endorsed by The Inner Circle Trader.




