
Key takeaways
ICT’s January 2018 NFP practice video presents a hypothetical GBP/USD cable short, not a live or demo execution, built around a bearish order block, a rally above local highs to trigger buy stops, and a reversal toward liquidity below an earlier low for a possible 50-pip decline.
Read the full summary
ICT’s January 2018 NFP practice video presents a hypothetical GBP/USD cable short, not a live or demo execution, built around a bearish order block, a rally above local highs to trigger buy stops, and a reversal toward liquidity below an earlier low for a possible 50-pip decline. ICT repeatedly refuses to risk money during NFP because price can take liquidity on both sides, labels the setup a paper trade at eight minutes 52 seconds, and treats the release as a liquidity event rather than focusing on the employment figure. The walkthrough uses a roughly 30-pip stop before nearby highs are breached or a 20-pip stop after the perceived buy-stop run, then moves the stop to about five pips of profit, closes 75% to 80% near equilibrium for roughly 30 pips, and leaves a smaller remainder for the lower target. The move should develop before about 10 to ten thirty a.m. New York time, otherwise consolidation becomes more likely and the remainder is closed when the window expires. The key lessons are to separate forecasts from confirmed fills, define invalidation, reduce exposure, use time-based exits, and avoid treating a plausible chart narrative as proof of profitability, while ICT also notes that he usually stays sidelined in early January and resumes later with light leverage.
How we researched this article
BestProps used document-based research from primary firm sources, checked September 25, 2026. The complete source list, scope, limitations, and commercial-state record appear near the end of this article.
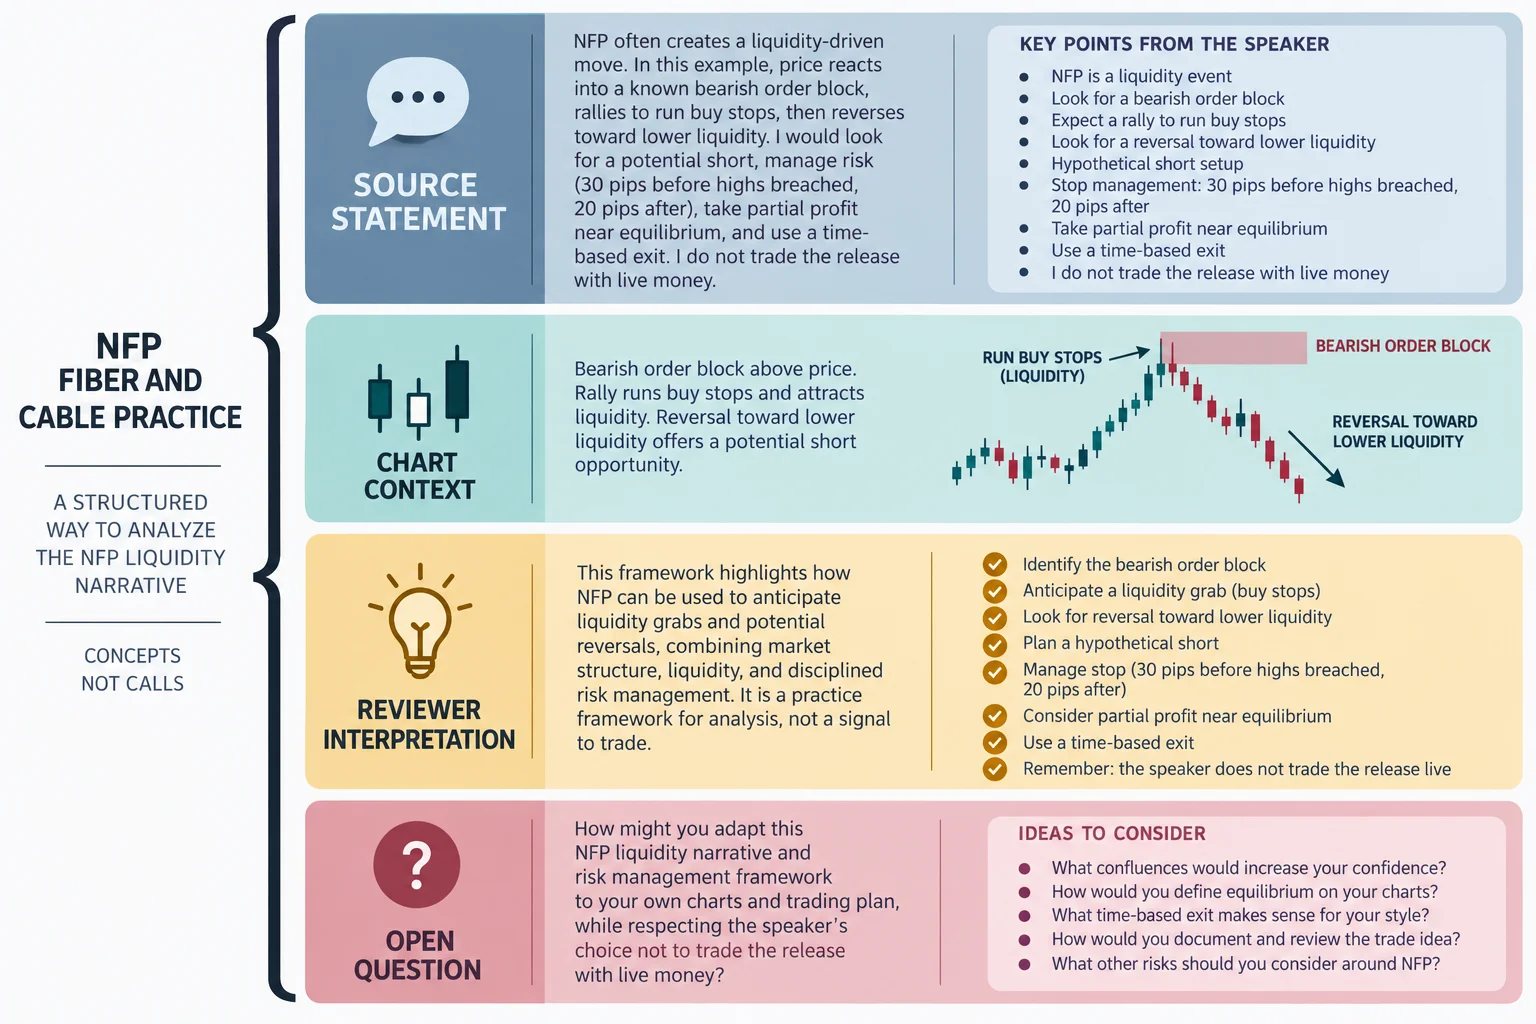
In ICT January 2018 NFP – Fiber & Cable Practice, ICT narrates a hypothetical foreign-exchange setup around a Non-Farm Payrolls release. The video was uploaded on January 8, 2018. Its captions focus mainly on “cable,” a common market nickname for GBP/USD; the generated transcript does not clearly preserve a separate, detailed discussion of “fiber.”
The central lesson is restraint. Although ICT describes where he would hypothetically sell, place a stop and manage a decline, he repeatedly says that he would not trade the NFP release with live money. This is presented as observation and paper practice rather than evidence of an executed trade.
ICT NFP Liquidity Narrative
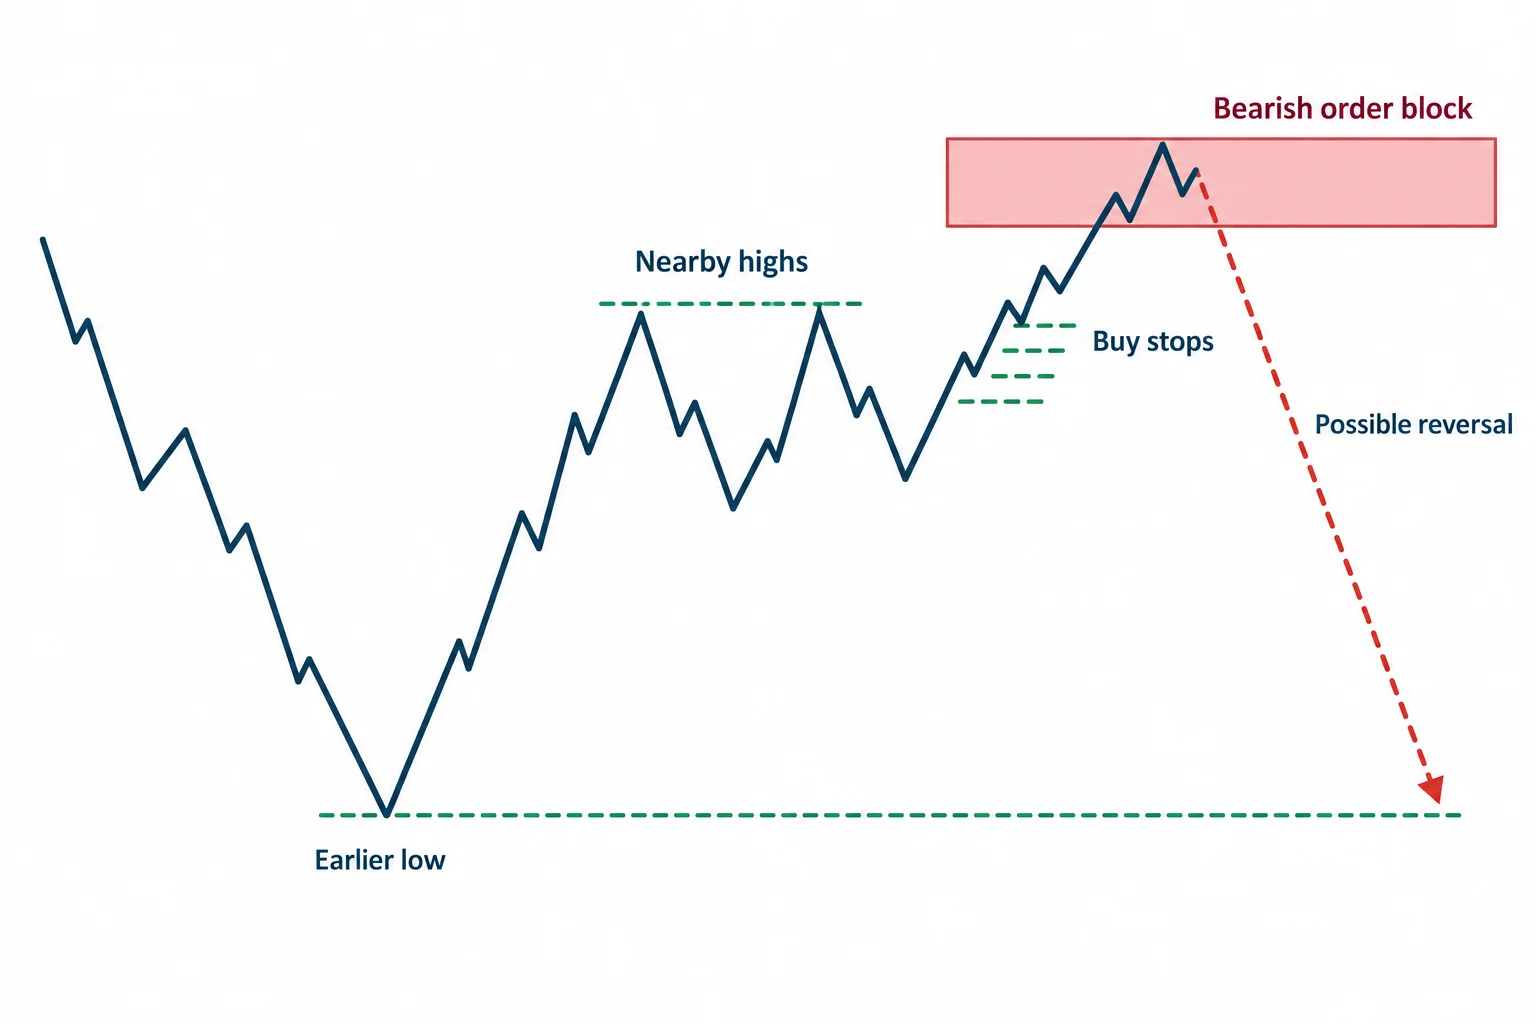
At 0:55, ICT identifies what he calls a bearish order block. His proposed sequence is an initial rally into that area, a move above nearby highs that triggers buy stops, and then a reversal toward liquidity below an earlier low. He characterizes the possible decline as roughly 50 pips, but immediately adds that he would not put live money at risk during NFP because “anything can happen.”
ICT’s interpretation is that a news release may first reach for the side of the market that is easiest to disturb. Beginning around 4:04, he reasons that traders who had sold earlier could have stops resting above local highs. A brief rally through those highs could remove those short positions before price turns lower. This is ICT’s market model, not a demonstrated rule about how all NFP sessions behave.
At 5:53, ICT says he does not focus on the reported employment number itself. He views the public release as old information and interprets the volatility around it through liquidity. That is the speaker’s explanation; the transcript does not provide independent evidence that economic data are always fully priced in or that releases are deliberately used to target orders.
Why the ICT NFP Setup Stays Hypothetical
A few minutes after the release, ICT says that under ordinary, non-event conditions he would consider a short from the area being discussed. At 8:52, however, he explicitly labels it a paper-trade idea and declines to place an order in the demo account.
He returns to this distinction at 14:05. His warning is unusually direct: NFP can be highly volatile, price may take liquidity on both sides, and identifying a likely target does not guarantee an immediate reversal. He compares the event to a “Judas swing,” meaning a deceptive initial move before the direction he anticipates.
This distinction matters when reviewing the video. The captions show narrated analysis over a chart, but they do not establish a broker-confirmed fill, realized profit or live-money result. References to an entry, stop and partial profit are a walkthrough of how ICT says he would have managed the hypothetical position.
ICT NFP Risk and Trade Management
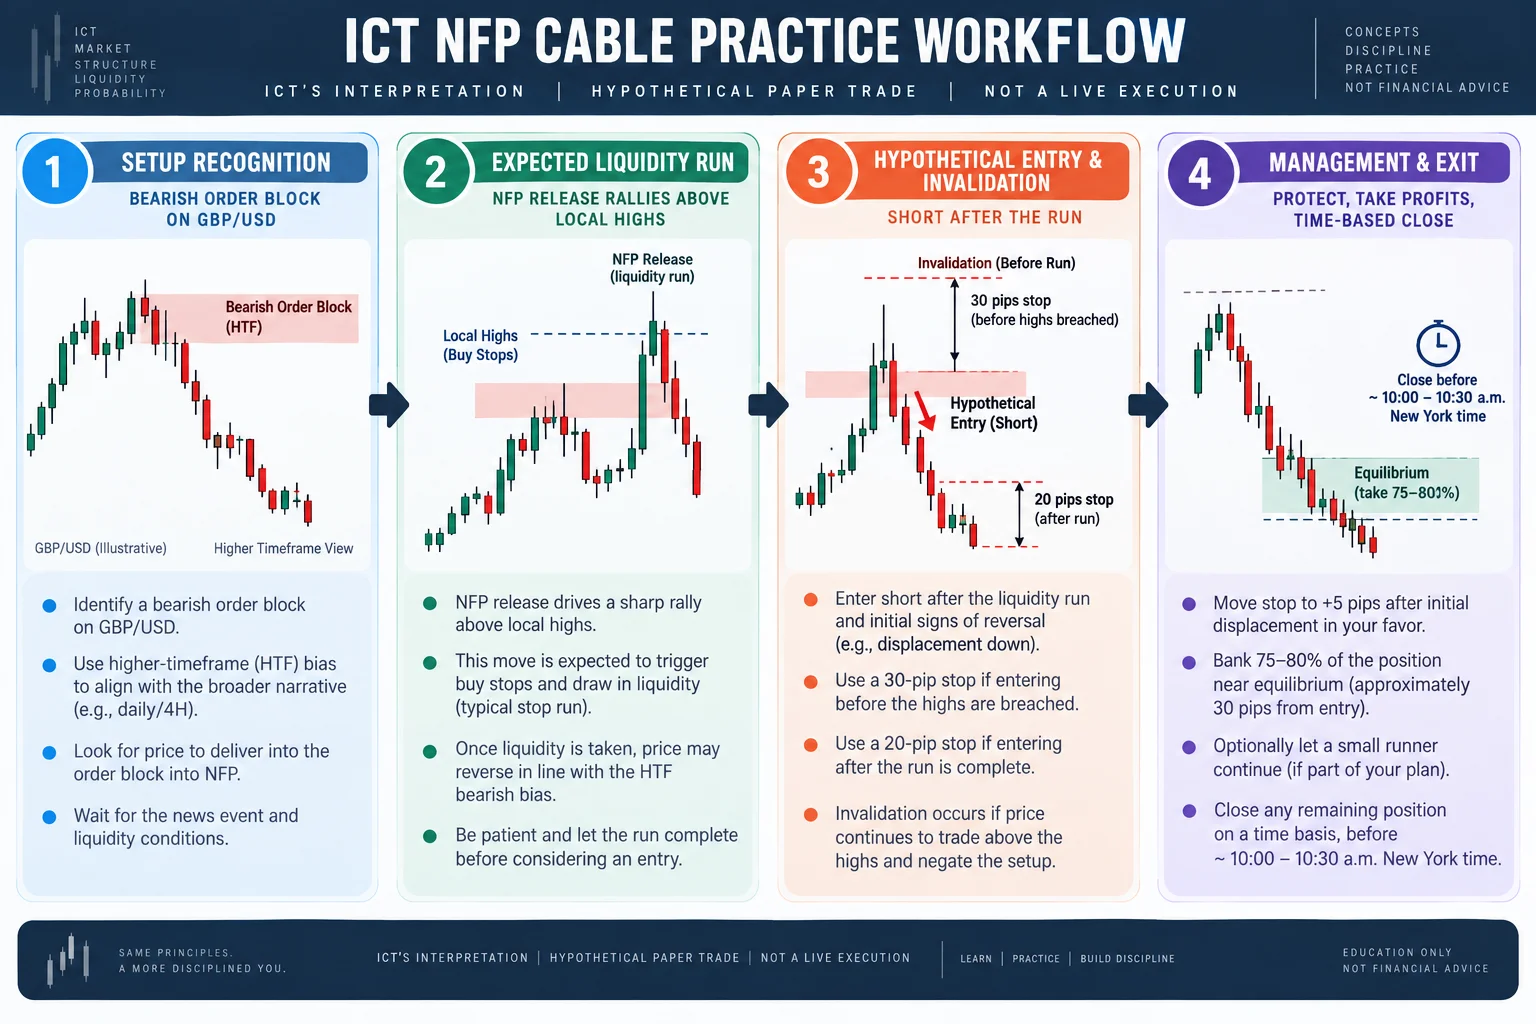
ICT discusses two possible stop distances. Before the nearby highs had been breached, he describes a wider hypothetical stop of about 30 pips. After price had, in his interpretation, already run the buy stops above the high, he says a 20-pip stop above the theoretical entry could be considered. These figures belong to this chart commentary and should not be generalized into universal risk parameters.
Later, after a period of sped-up footage, ICT outlines management rather than claiming an actual execution:
- At 17:49, he says he would move the stop to approximately five pips of positive territory.
- He would take roughly 75% to 80% off near the equilibrium area he had marked earlier.
- He describes the hypothetical partial gain as about 30 pips and would leave a smaller remainder open in case price continued toward the lower liquidity target.
- At 19:14, he adds a time condition: the desired move should occur before approximately 10:00–10:30 a.m. New York time. As the move takes longer, he considers consolidation increasingly likely.
Near 21:39, the generated captions become unclear, but the supported point is that ICT would close any remaining hypothetical position once his time window had ended rather than continue waiting for a downside objective.
ICT NFP Practice Lessons
Separate from ICT’s particular liquidity interpretation, the session illustrates several general review practices: distinguish a forecast from an execution, define invalidation before considering a setup, reduce exposure rather than treating a target as certain, and use a time-based exit when the expected move fails to develop promptly.
ICT also explains that he normally remains on the sidelines during the first part of January and resumes cautiously with light leverage later in the month. That is his personal schedule, not a broadly validated seasonal strategy.
The strongest message in this recording is therefore not the directional call. It is the repeated refusal to trade a volatile scheduled release merely because a chart narrative appears plausible. The video is educational commentary and does not establish that the described approach is profitable or suitable for any trader.
Watch the full video on YouTube
Watch ICT January 2018 NFP – Fiber & Cable Practice on YouTube ↗Primary source and further reading
- The original Inner Circle Trader lesson: use the timestamp links in this article to compare the explanation with its source.
- YouTube’s embedding documentation: platform guidance relevant to the external watch link above.
- 17 CFR 4.41: disclosures concerning hypothetical performance: a regulatory reference, not a statement that a particular recording or this article meets every legal requirement.
This is independent educational commentary. It is not official ICT material, a tested trading system, or a claim that the discussed framework is profitable or reproducible.



