
Key takeaways
ICT reviews the US Dollar Index, EUR/USD, GBP/USD, AUD/USD, USD/CAD, USD/JPY, Bitcoin and Ripple, using cross-market confirmation, market maker models, order blocks, liquidity, optimal trade entry and SMT divergence to argue for dollar weakness and relative strength in major foreign currencies.
Read the full summary
ICT reviews the US Dollar Index, EUR/USD, GBP/USD, AUD/USD, USD/CAD, USD/JPY, Bitcoin and Ripple, using cross-market confirmation, market maker models, order blocks, liquidity, optimal trade entry and SMT divergence to argue for dollar weakness and relative strength in major foreign currencies. The first 48 minutes cover charts, beginning with a Dollar Index market maker sell model at 2 minutes 24 seconds, followed by EUR/USD weekly order-block support, equal-high liquidity, ECB-driven displacement and SMT divergence from 4 minutes 48 seconds, GBP/USD accumulation and buy-side liquidity from 21 minutes 30 seconds, an AUD/USD market maker buy model from 32 minutes 48 seconds, a USD/CAD warning at 35 minutes 6 seconds that oil and Canadian-dollar behavior can break simple correlations, and USD/JPY bearish-breaker and mitigation scenarios from 37 minutes 17 seconds. At 42 minutes 58 seconds he characterizes Bitcoin as an incomplete sell model and gives bearish opinions on Bitcoin and Ripple without documenting later outcomes or trade execution. Feed differences and missing holiday bars may alter candle levels, hindsight affects the historical analysis, candles do not prove institutional activity or profitability, and the lengthy mentorship discussion after 48 minutes 8 seconds describes historical 2018 enrollment, demo-account expectations and restrictions rather than current terms.
How we researched this article
BestProps used document-based research from primary firm sources, checked September 25, 2026. The complete source list, scope, limitations, and commercial-state record appear near the end of this article.
In ICT January 12, 2018, ICT reviews the US Dollar Index and several currency pairs before briefly discussing Bitcoin and Ripple. The market-analysis portion occupies roughly the first 48 minutes; the remainder is a lengthy, historically specific discussion of ICT’s mentorship program.
The central analytical theme is cross-market confirmation. ICT interprets weakness in the Dollar Index alongside relative strength in EUR/USD, GBP/USD and AUD/USD. He frames these relationships with his own terminology, including market maker models, order blocks, liquidity, optimal trade entry and SMT divergence. These are ICT’s interpretations of price action, not independently established evidence of a repeatable trading edge.
ICT Dollar Weakness and Market Direction
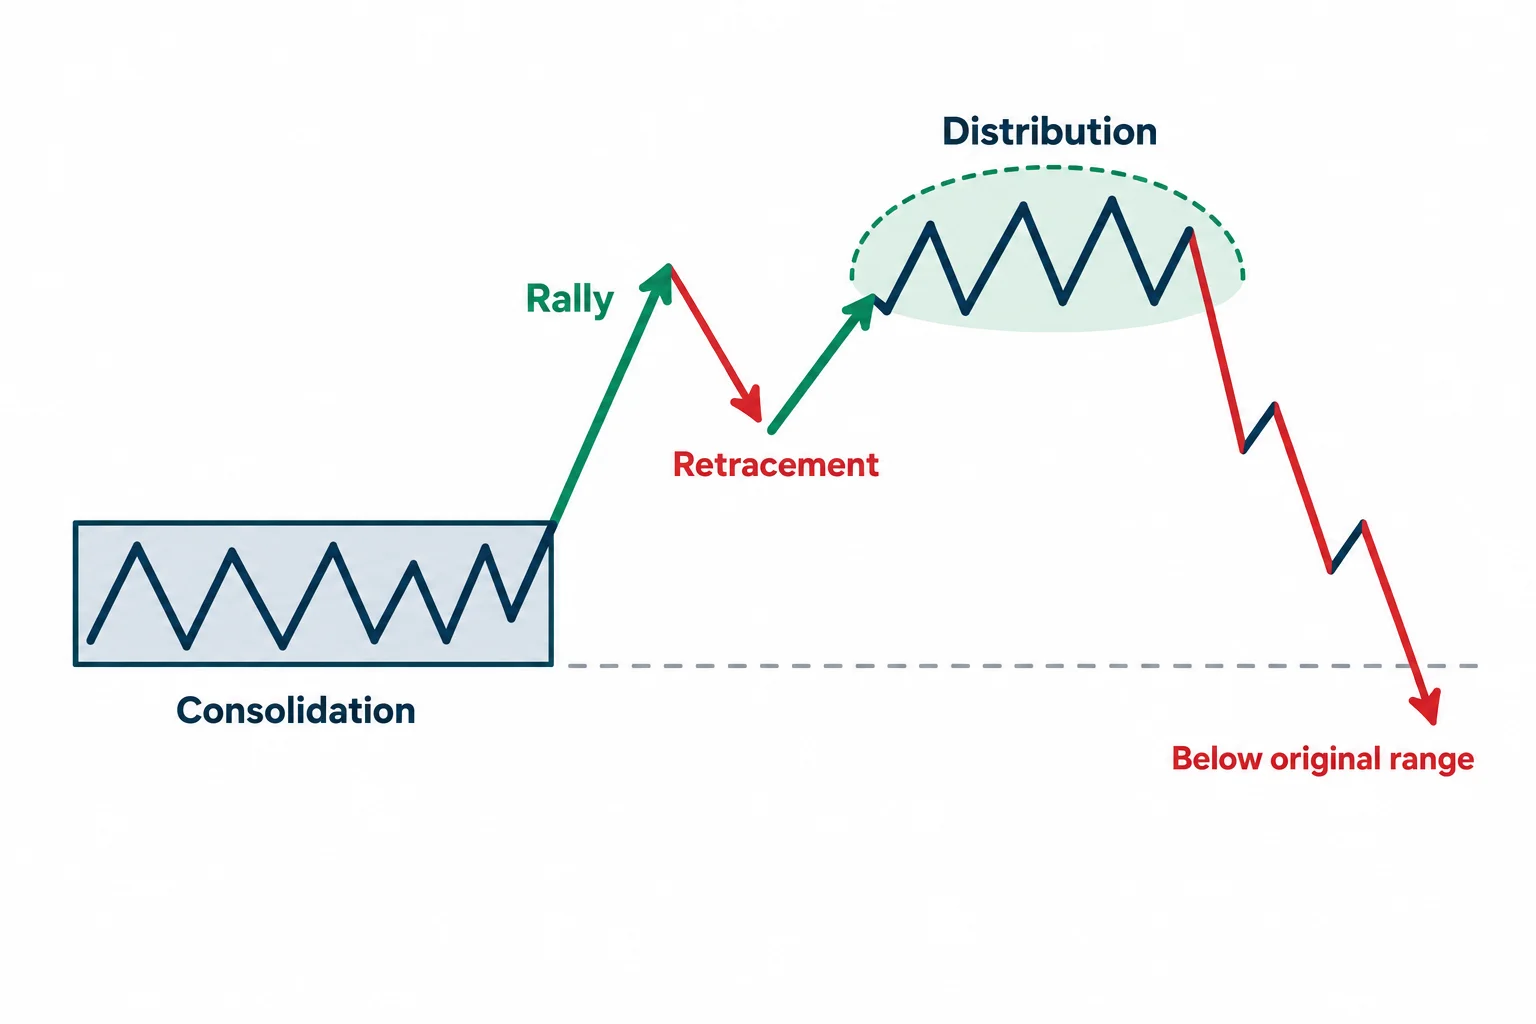
At 2:24, ICT begins with the Dollar Index daily chart. He identifies what he calls an original consolidation, followed by a rally, retracement, distribution and movement below the earlier range. In his framework, that sequence completes a “market maker sell model” and supports a bearish dollar interpretation.
He also notes that the displayed demo-account data may be missing holiday bars and may close earlier than another price feed. That is an important limitation: feed differences can affect candle shapes, highs, lows and the apparent precision of chart levels.
ICT then uses the weaker-dollar thesis as context for foreign currencies quoted against the dollar. This is not treated as a mechanical rule. Later, while discussing USD/CAD, he expressly warns that related markets do not always move in a simple inverse relationship because other influences can disrupt the correlation.
ICT Forex Market Structure for EUR/USD
The most detailed case study begins around 4:48. On the weekly EUR/USD chart, ICT marks a series of down-close candles as a bullish weekly order block. He then carries that higher-time-frame area onto an hourly chart to interpret the week’s lower-time-frame movement.
His explanation combines several elements:
- A bearish Dollar Index bias and corresponding bullish EUR/USD bias.
- A weekly area that he interprets as institutional buying.
- Prior equal highs viewed as a pool of liquidity above the market.
- A low forming early in the week, consistent with his preferred bullish weekly profile.
- Acceleration following the release of ECB monetary-policy minutes.
At 8:43, he turns to the ECB event and describes price moving sharply higher after first retracing into what he labels an optimal trade-entry region. He argues that central-bank-related repricing can produce displacement, shallow pullbacks and compact consolidations rather than orderly, deep retracements.
A second component is what ICT calls SMT divergence. Starting near 13:43, he compares Dollar Index highs with EUR/USD lows at corresponding times. He interprets the pairs’ failure to form perfectly symmetrical extremes as evidence of accumulation in EUR/USD. The captions contain several awkwardly transcribed numbers, so the conceptual comparison is clearer than every quoted price level.
ICT Forex Correlation for GBP/USD
At 21:30, ICT moves to GBP/USD, or “cable.” He begins with weekly context, identifies another bullish order block and treats old highs and lows as potential draws on price.
On the hourly chart, he highlights repeated equal highs. In his framework, these imply buy-side liquidity above the range. He then describes price trading into the weekly order block during the ECB period before moving through those highs. ICT links the concurrent strength in EUR/USD and GBP/USD to dollar weakness and to the close relationship between the two European currency pairs.
Near 26:00, he again uses SMT divergence, this time comparing successive GBP/USD lows with Dollar Index behavior. He interprets the mismatch as accumulation in sterling and distribution in the dollar. He also acknowledges the benefit of hindsight while explaining the sequence, an important qualification when reviewing historical charts.
ICT Forex Correlation Across AUD CAD and JPY
The AUD/USD review begins at 32:48. ICT describes an inverted version of the dollar’s structure: consolidation, a decline, a return toward the original range and an eventual move above it. He calls this a completed market maker buy model and connects it to accumulation he says he had discussed in December.
At 35:06, USD/CAD provides a useful caveat. ICT says dollar weakness alone does not always determine the pair because Canadian-dollar behavior and oil can alter the relationship. This is one of the video’s more broadly useful educational points: correlation is contextual and can break down.
The USD/JPY segment starts near 37:17. ICT marks a bearish breaker, a mitigation area and a retracement he classifies as an optimal trade entry. He offers possible lower objectives but presents them as scenarios dependent on subsequent Dollar Index behavior, not known outcomes.
ICT 2018 Crypto Market Lessons
ICT turns to Bitcoin around 42:58. He interprets its structure as an incomplete sell model and speculates about substantially lower prices. He then gives a similar bearish opinion on Ripple. These were contemporaneous forecasts, and the transcript does not document what happened afterward or establish any trade execution.
The chart review ends at approximately 48:08. From there, the video becomes a long discussion of the mentorship’s expectations, historical enrollment process, demo-account emphasis and restrictions. Those 2018 administrative details should not be treated as current terms.
ICT Market Interpretation
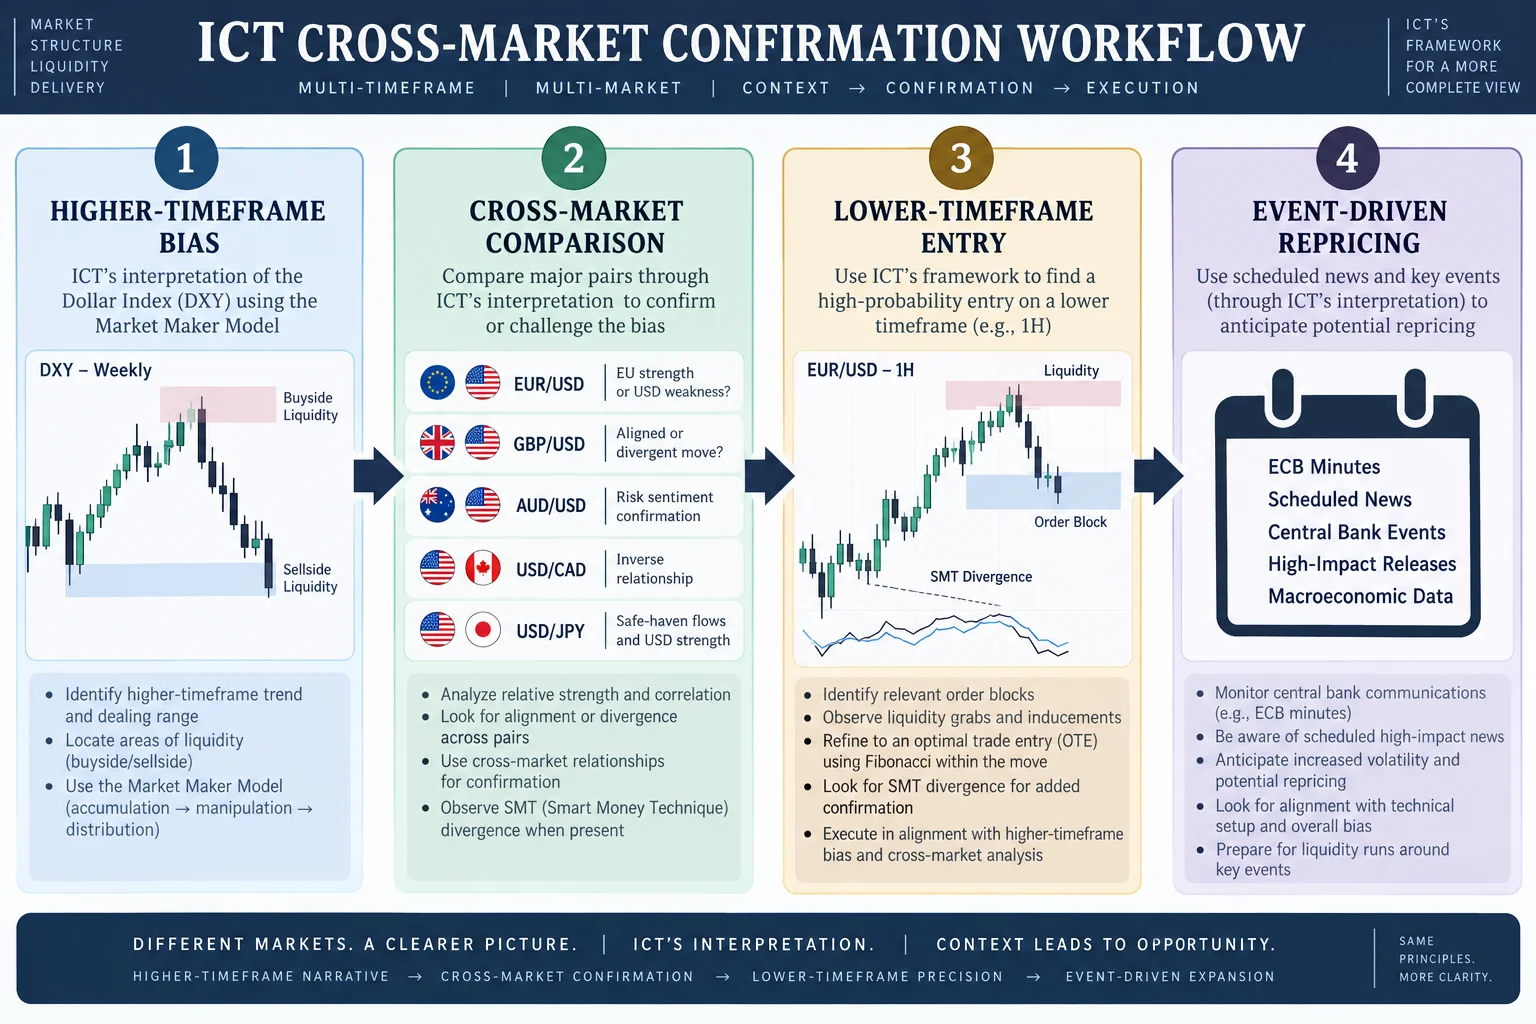
The session illustrates a top-down workflow: establish a higher-time-frame bias, compare correlated instruments, identify prior ranges or repeated highs and lows, and then examine lower-time-frame behavior around scheduled events. A careful viewer should separate that workflow from stronger claims about institutional activity. Candles alone do not verify who traded, why they traded or whether a particular participant was accumulating a position. The material is best studied as ICT’s chart-reading framework rather than proof of market causation or profitability.
Watch the original ICT lesson
Watch the original lesson on YouTube
The video cannot be played inside another website: when its embedded player was opened and clicked on 22 September 2026, the player itself reported “Playback on other websites has been disabled by the video owner.” and settled on a “Watch on YouTube” prompt, with no duration and no playback progress reported. That message is the reason no embed is reserved or left blank here; the recording itself is available directly on YouTube.
Primary source and further reading
- The original Inner Circle Trader lesson: use the timestamp links in this article to compare the explanation with its source.
- YouTube’s embedding documentation: platform guidance relevant to the external watch link above.
- 17 CFR 4.41: disclosures concerning hypothetical performance: a regulatory reference, not a statement that a particular recording or this article meets every legal requirement.
This is independent educational commentary. It is not official ICT material, a tested trading system, or a claim that the discussed framework is profitable or reproducible.



