
Key takeaways
ICT On Institutional Price Levels & New Science Of Fib Use, uploaded November 19, 2017, presents a EUR/USD framework that anchors Fibonacci retracements to standardized 00, 20, 50 and 80 price endings instead of broker-dependent wick extremes.
Read the full summary
ICT On Institutional Price Levels & New Science Of Fib Use, uploaded November 19, 2017, presents a EUR/USD framework that anchors Fibonacci retracements to standardized 00, 20, 50 and 80 price endings instead of broker-dependent wick extremes. The 00 big figure, 50 midpoint and secondary 20 and 80 levels form a predefined grid where ICT observes pauses, overshoots, rejection and momentum, while equal highs and lows are treated as potential stop targets rather than dependable barriers. His preferred anchoring method uses nearby institutional levels instead of absolute wicks or candle-body opens and closes, with examples spanning 1.1700 to 1.1820 for a 62% retracement, 1.1900 to 1.1950 for a 62% optimal trade entry and 1.2000 to 1.1950 for a bearish 70.5% retracement. ICT says traders must establish bullish or bearish bias from valuation, price, time, structure, liquidity and displacement before applying Fibonacci, which he treats as an overbought, oversold and relative-value reference rather than the cause of price movement. The framework reduces endpoint discretion but still requires subjective choices about relevant levels and directional context, and the presentation supplies no controlled testing, complete trade records, order-book evidence or sufficient visual data to verify profitability.
How we researched this article
BestProps used document-based research from primary firm sources, checked September 25, 2026. The complete source list, scope, limitations, and commercial-state record appear near the end of this article.
Watch the source video: ICT On Institutional Price Levels & New Science Of Fib Use (uploaded November 19, 2017)
Playback on other websites has been disabled by the video owner. Click the link to watch on YouTube.
References and Resources
- Primary source: ICT On Institutional Price Levels & New Science Of Fib Use (YouTube)
- The Inner Circle Trader channel (YouTube)
- CFTC Advisory: Fraud Advisory – Foreign Currency Trading Systems (official)
- Investor.gov: Day Trading – Risks and Regulations (official)
In this November 2017 video, ICT presents an alternative way to mark price levels and anchor Fibonacci retracements. Instead of beginning with the precise wick of a conventional swing high or swing low, he proposes starting from standardized price increments that he calls “institutional price levels.” His examples focus on EUR/USD, although the transcript alone cannot verify the chart, its feed, or the subsequent results.
Primary source: ICT On Institutional Price Levels & New Science Of Fib Use, uploaded November 19, 2017.
Understanding ICT Institutional Price Levels
ICT opens by disputing several conventional explanations of market behavior. He characterizes price as non-random and argues that order flow, rather than ordinary support and resistance, should organize a trader’s analysis. These are ICT’s personal market interpretations, not conclusions established by the recording. Indeed, he explicitly describes the framework as his belief near the 2:49.
The practical teaching begins when he asks viewers to notice how price moves around recurring decimal increments. At 15:59, he introduces whole-number “00” levels and halfway “50” levels, later adding “20” and “80.” In the EUR/USD examples described in the audio, these include figures such as 1.1900, 1.1950 and related 20- or 80-point subdivisions.
Four ICT Institutional Price Levels
ICT’s framework gives special attention to four endings:
- 00: the full figure or “big figure.”
- 50: the midpoint or “mid figure.”
- 20 and 80: secondary reference levels within the broader interval.
He describes these increments as mile markers around which price may pause, overshoot, reject, or trade forcefully. At 16:50, he identifies them as the starting mechanics of his algorithmic interpretation. The important point is not that every level must produce a reversal. Rather, ICT looks at how price behaves around a level and whether it leaves that area with apparent momentum.
He also discusses equal highs and equal lows. In his terminology, these can attract runs on clustered stops rather than operate as dependable barriers. Around 18:52, he explains that equal lows may draw attention from traders placing protective stops beneath them. This is an interpretation of chart structure; the transcript does not provide order-book evidence showing who placed orders there.
Anchoring Fibonacci to ICT Price Levels
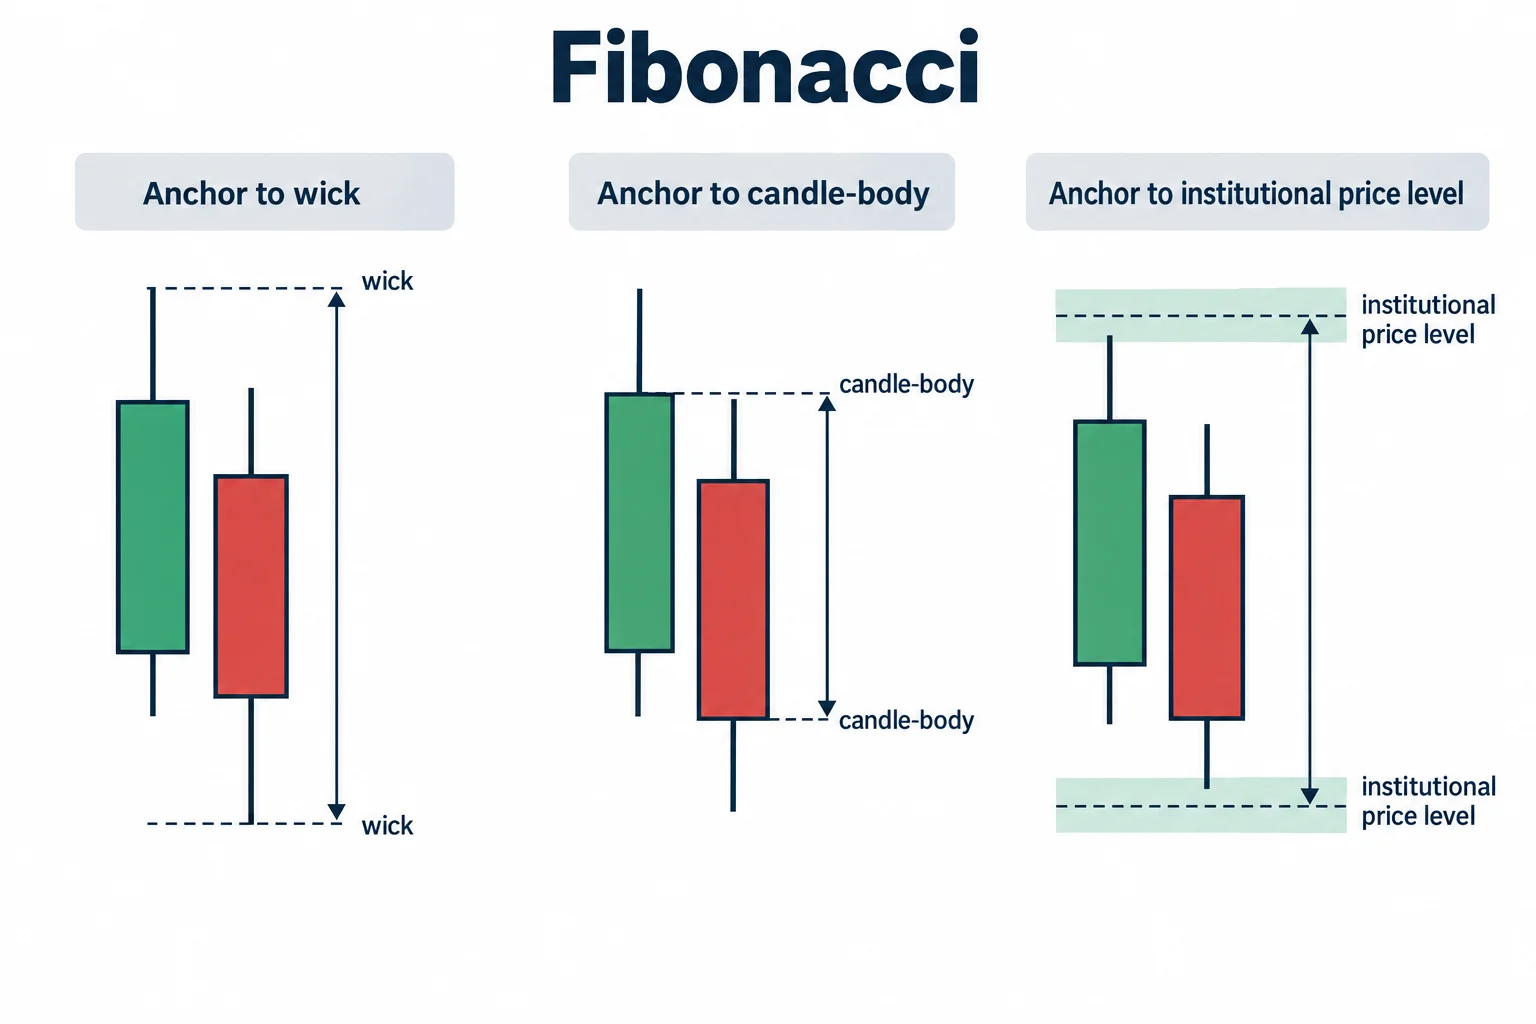
The central lesson starts around 29:57. ICT contrasts three possible Fibonacci anchoring methods:
- Use the absolute wick at a swing high or low.
- Use the highest or lowest candle-body open or close.
- Use the nearby 00, 20, 50 or 80 institutional price level.
His preferred method in this presentation is the third. For example, rather than stretching a Fibonacci tool between whatever wick extremes appear on a broker’s chart, he anchors it between the standardized levels that he believes price was working from and toward. In one narrated example, he frames a move from the 1.1700 big figure to the 1.1820 level and says the resulting retracement aligns with 62% (30:48).
Later, he describes anchoring between 1.1900 and 1.1950 after price has moved forcefully through the 1.1900 figure. Under that construction, he identifies a 62% retracement as what he calls an “optimal trade entry” (38:26). A bearish illustration follows: after price moves from 1.2000 toward 1.1950, he anchors the tool across those two standardized references and highlights the 70.5% retracement (41:41).
Set Price Bias Before ICT Fibonacci Retracements
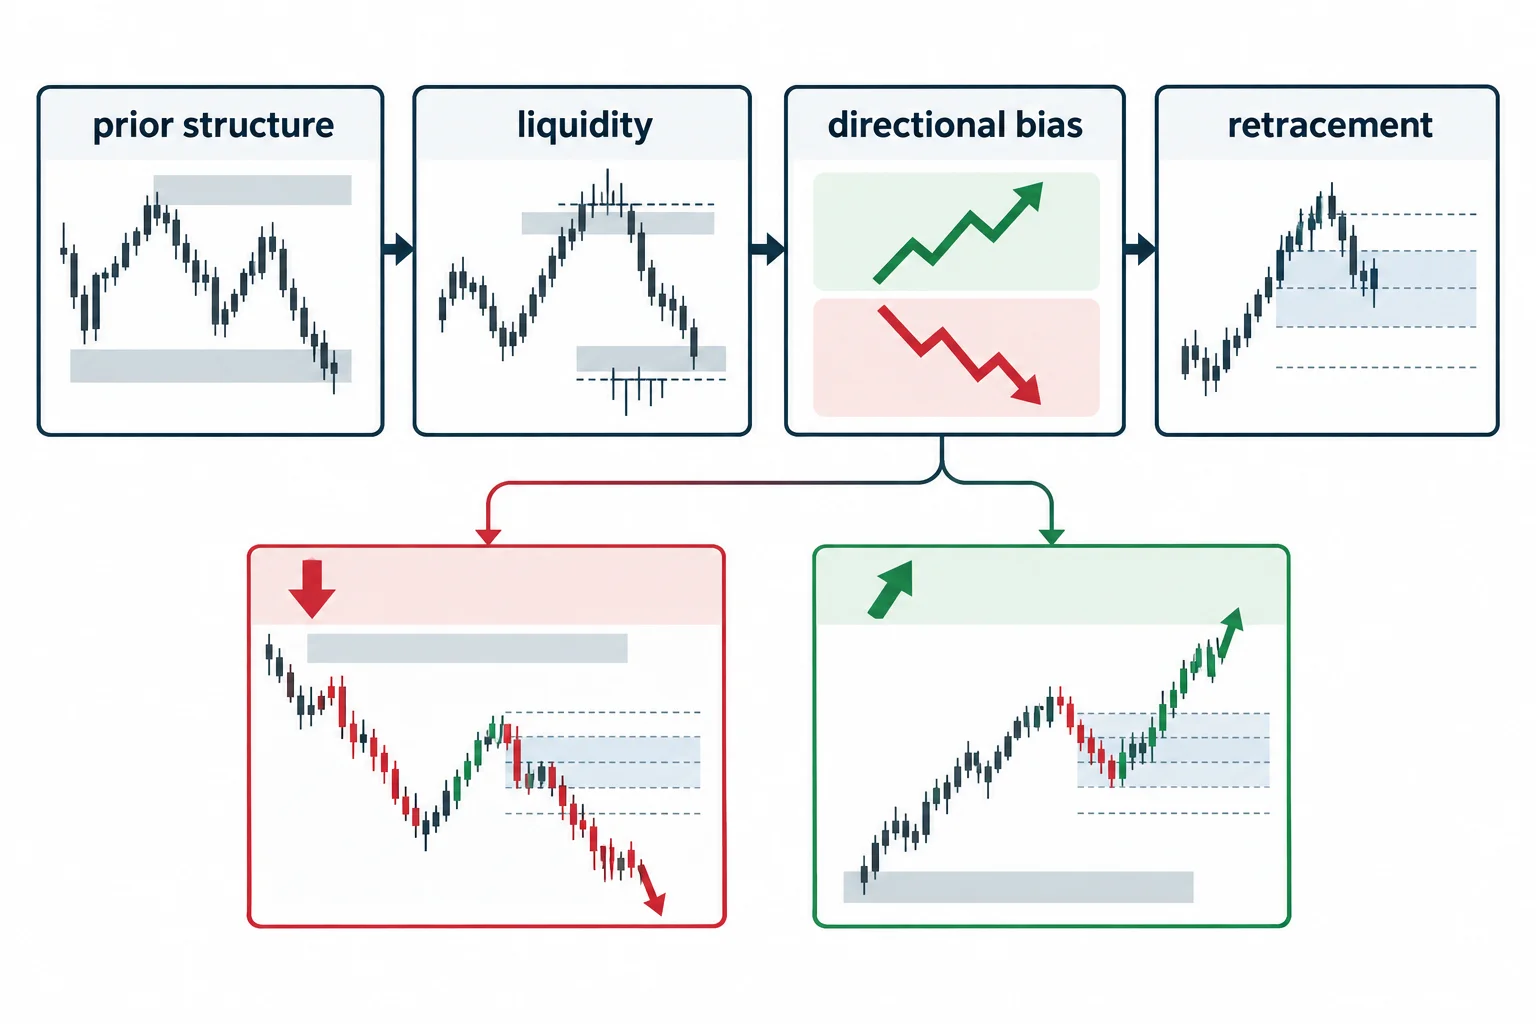
ICT repeatedly says that the Fibonacci placement is not a complete method by itself. The analyst must first decide whether the broader context is bullish or bearish. At 39:58, he emphasizes valuation, price, time and directional bias; shortly afterward, he calls determining whether to be a buyer or seller the harder part of the process.
That qualification matters. A retracement touching 62%, 70.5% or another marked value does not independently establish direction. In ICT’s framework, the same shape can be interpreted differently depending on prior structure, the perceived draw on liquidity and whether price has displaced away from a reference level. Near 54:42, he explains that a break above a short-term high does not automatically make the setup bullish when his broader context remains bearish.
Using ICT Price Levels and Fibonacci Responsibly
A neutral way to study the presentation is to treat the four endings as a predefined grid. That removes some discretion from choosing wick endpoints, but it does not eliminate discretion altogether. The user must still decide which two levels define the relevant move, whether a level was “worked” or “defended,” and what directional context applies.
ICT ultimately describes Fibonacci as a valuation aid for distinguishing relatively expensive and relatively cheap areas, not as the force moving price. Near 57:30, he says he uses it as a reference for overbought and oversold conditions. The video therefore teaches a specific chart-reading framework: establish bias, identify standardized price increments, observe movement away from them, and then grade a retracement between selected increments.
This summary is educational commentary on ICT’s stated methodology. It is not investment advice, and the presentation itself does not supply controlled testing, complete trade records, or enough visual data to establish profitability.



