
Key takeaways
In a just-over-one-minute Nasdaq clip, ICT applies 2022 mentorship concepts to a historical chart: a prior high at 14,096.25 is taken, a swing low defines the dealing range, price moves into a discount area below 13,980, and a fair value gap spans 13,971 to 13,938.75.
Read the full summary
In a just-over-one-minute Nasdaq clip, ICT applies 2022 mentorship concepts to a historical chart: a prior high at 14,096.25 is taken, a swing low defines the dealing range, price moves into a discount area below 13,980, and a fair value gap spans 13,971 to 13,938.75. After a market structure shift, a smaller pink bearish fair value gap appears as a potential short-entry area with the lower gap as the projected target. The video encourages scrubbing through history to study the pattern’s sequence but provides no platform instructions, order details, fills, stops, risk amounts, verified results, or evidence of predictive consistency. Transcript-derived levels are not independently confirmed against the unseen chart.
How we researched this article
BestProps used document-based research from primary firm sources, checked September 25, 2026. The complete source list, scope, limitations, and commercial-state record appear near the end of this article.
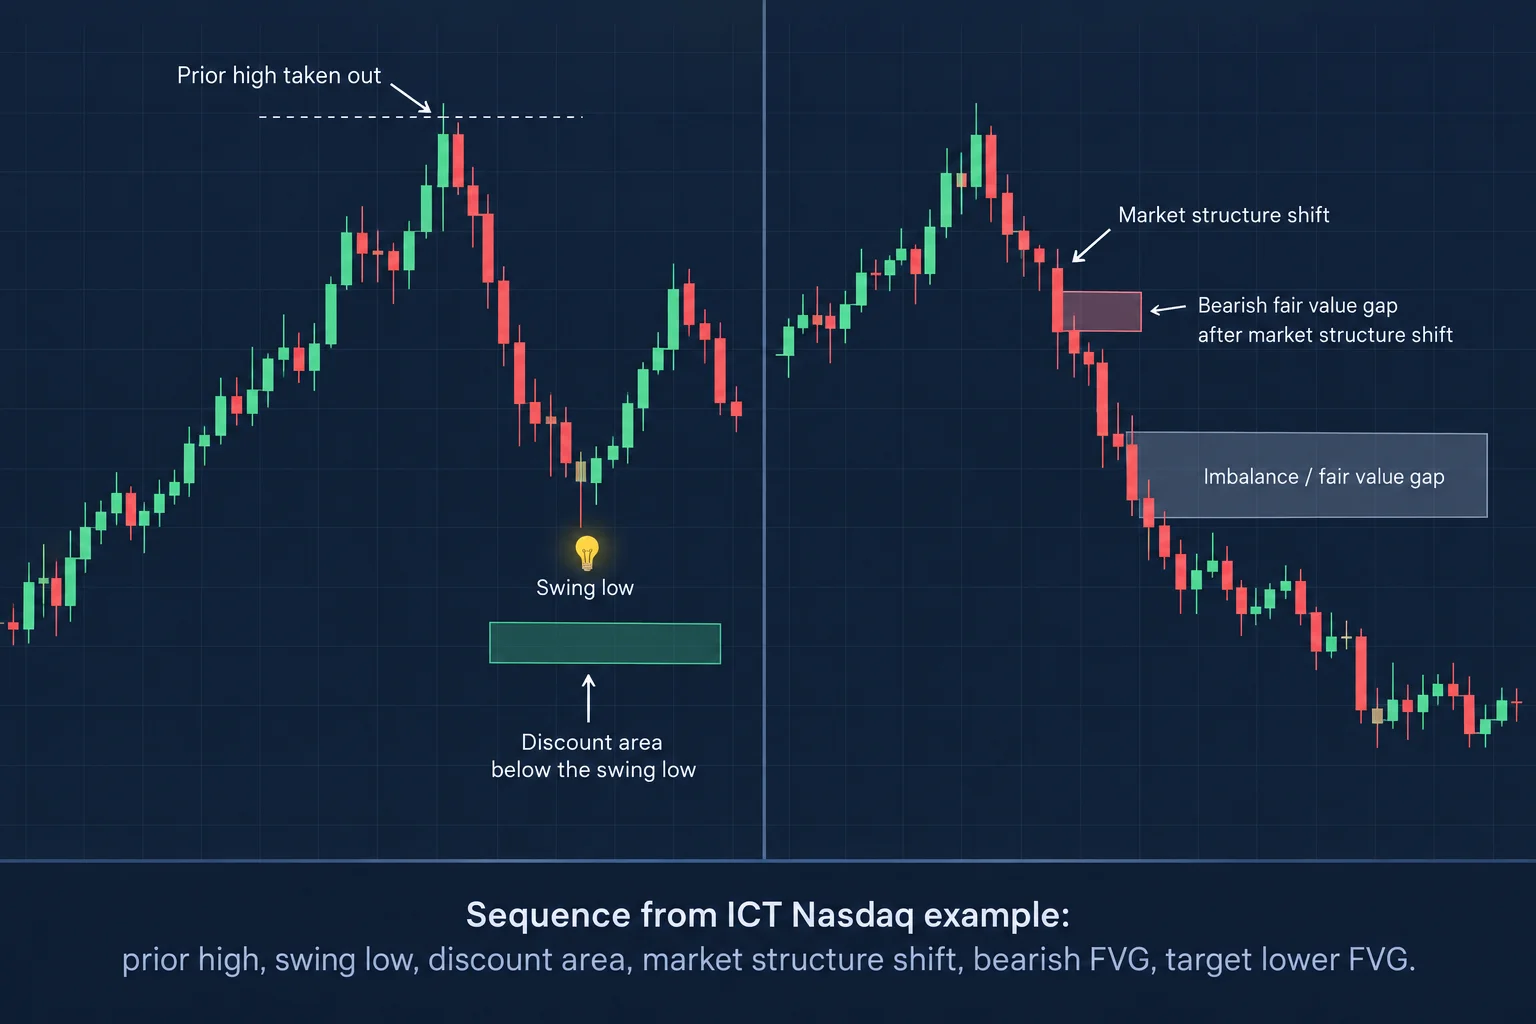
In the short video “History Repeats & History Tab Tutorial – Show It :)”, ICT narrates a historical Nasdaq chart example using concepts associated with the 2022 mentorship. The presentation lasts approximately 73 seconds and focuses on a high being taken, a subsequent market structure shift, and price moving toward an imbalance or fair value gap.
This is a retrospective chart explanation rather than a complete trading tutorial. Although the title mentions a “History Tab,” the transcript only briefly encourages viewers and mentors to scrub through historical data; it does not provide detailed instructions for operating a particular platform’s history feature.
ICT History Repeats Nasdaq Chart Example
At 0:00, ICT introduces the example as a quick look at Nasdaq. He says it comes from the teachings of the 2022 mentorship. The automatically generated transcript recognizes one reference as “ITT mentorship,” but the surrounding context and speaker identity suggest this may be a transcription error for “ICT mentorship.”
At 0:09, ICT identifies a prior high at 14,096.25 and states that high was taken out.
At 0:15, he turns to the swing low preceding the upward run. His explanation frames that low as a reference point for determining when price has entered what he calls a discount portion of the range. A light-bulb icon on the chart marks this level.
Beginning around 0:20, he describes the range that would take price down to a discount below that swing low, placing it just below the 13,980 level (at 0:25). He then gives the boundaries of an imbalance or fair value gap: the high at 13,971 (at 0:28) and the low at 13,938.75 (at 0:33). These numbers are transcript-derived and have not been independently confirmed against the unseen chart.
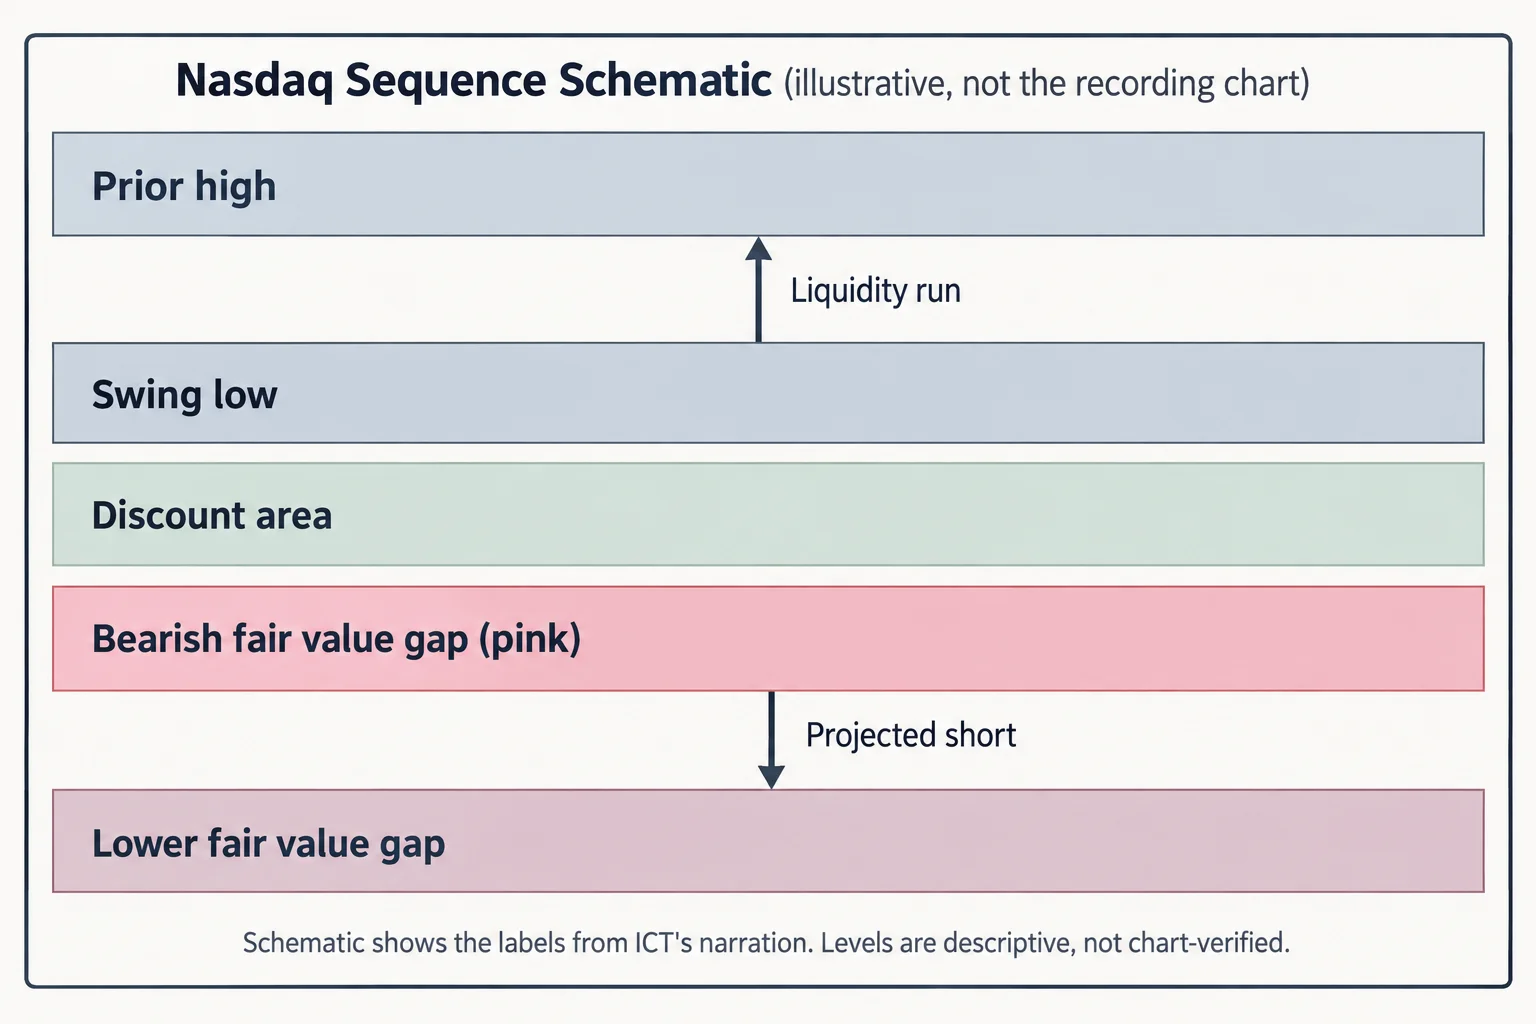
ICT Nasdaq Example With Market Structure and Fair Value Gaps
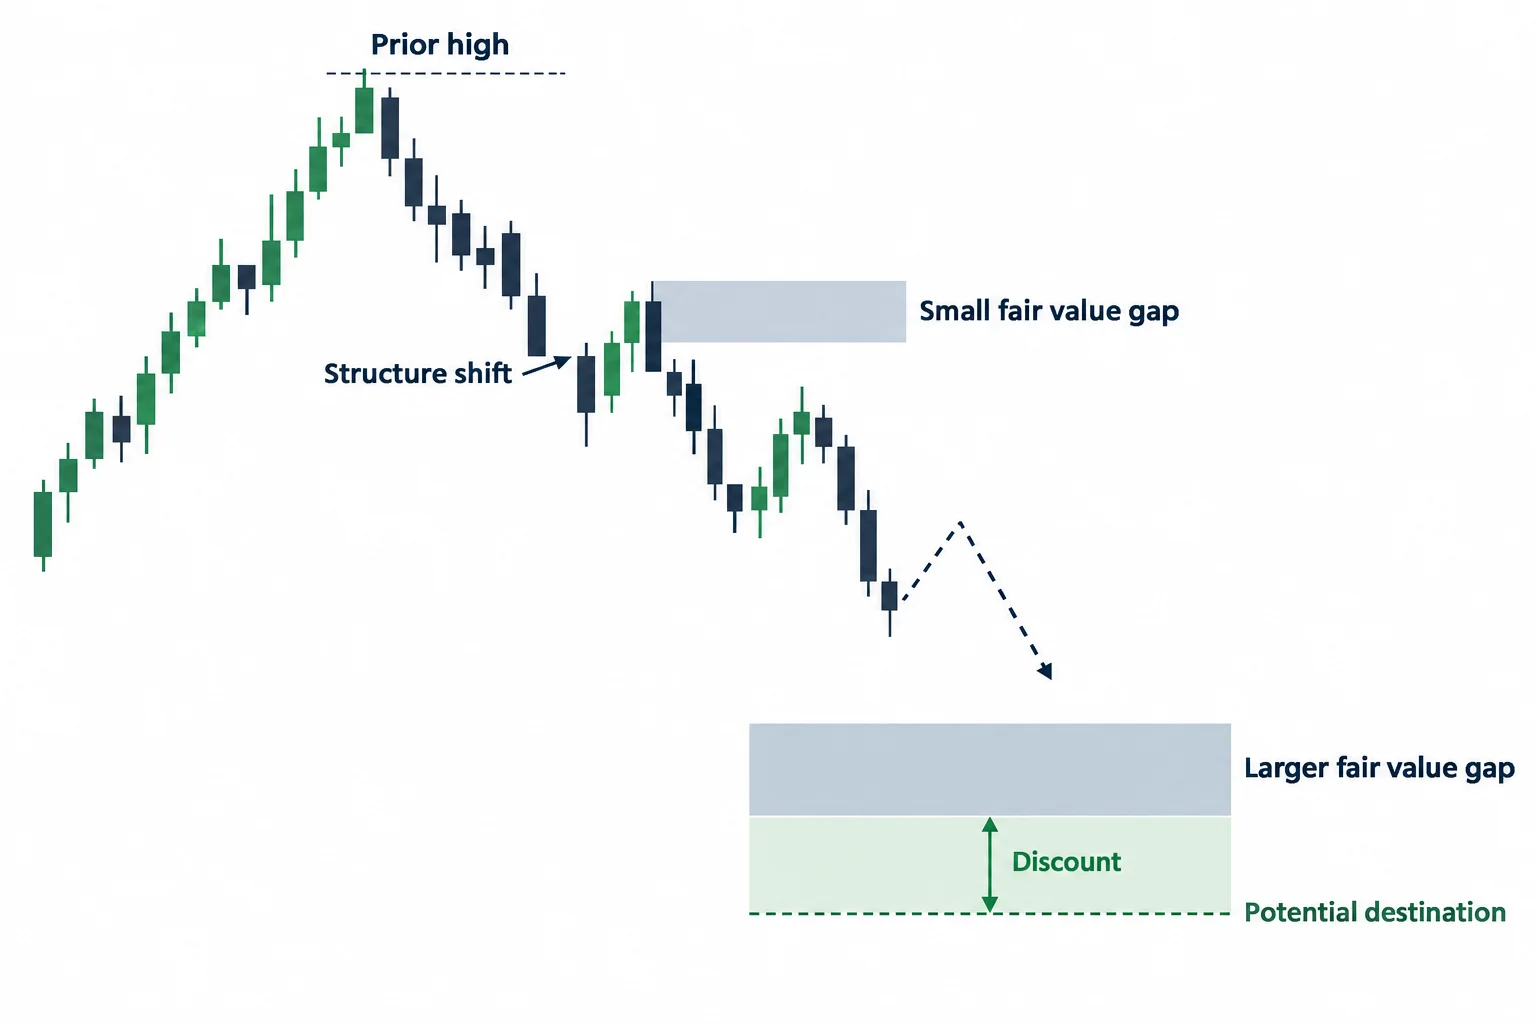
At 0:37, ICT points out another small fair value gap, which he says is highlighted in pink. At 0:40, he places it after what he calls a market structure shift.
At 0:48, the narration connects these elements into a bearish scenario: after the shift, he says a trader following this framework would anticipate a short and a move down into the larger fair value gap.
Within ICT’s interpretation, the sequence is therefore:
- A prior high is taken (0:09).
- The earlier swing low helps define the dealing range (0:15).
- Price moves into the range’s discount area below ~13,980 (0:20-0:25).
- A fair value gap spans 13,971 to 13,938.75 (0:28-0:33).
- A market structure shift is identified (0:40).
- A small pink bearish fair value gap is used as a potential short-entry area (0:37-0:40).
- The lower fair value gap becomes the anticipated destination (0:48).
This list summarizes ICT’s retrospective reading of the chart. The transcript does not document an actual order, fill, stop placement, risk amount, or verified trade result.
What the ICT Tutorial Means by “Show It”
At 0:53, ICT remarks on the historical progression (“almost as if like magic”). At 0:58, he says that when the framework appears to work, it can be demonstrated by scrubbing through history. The emphasis is on using historical playback to illustrate a previously taught pattern instead of relying only on a static, after-the-fact chart annotation.
As a general educational practice, replaying data can help a learner study the order in which chart features appeared. It should not, however, be confused with evidence that a setup is consistently predictive. Historical replay can introduce hindsight and selection bias, especially when the clip does not specify rules for choosing examples or invalidating the idea.
ICT History Tutorial Key Takeaways
The video is a compact demonstration of ICT terminology rather than a full history-tab tutorial. ICT interprets the Nasdaq sequence as a liquidity run above a prior high, followed by a bearish structure change and movement toward a fair value gap in the discount area. Viewers can use the clip to understand how those concepts are linked in ICT’s teaching, while recognizing that the transcript alone cannot verify the chart, any execution, or the outcome of a live trading decision.
This commentary is educational and summarizes the cited primary source. It is not investment advice or a promise of trading performance.
Resources
- ICT – "History Repeats & History Tab Tutorial – Show It :)" (YouTube) — the primary 73-second clip narrated in this article.
- Fair Value Gaps vs Order Blocks – The Inner Circle Traders — companion site describing the FVG three-candle pattern and contrasting it with order blocks. Unofficial, untested third-party tutorial.
- ICT Trading Books and PDF Guide – The Inner Circle Traders — companion-site overview of the 2022 ICT Mentorship series. Unofficial, untested third-party tutorial.
- 2022 ICT Mentorship Episode 18 (YouTube) — primary-source clip from the 2022 ICT Mentorship that walks through fair value gap annotations and market structure.



