
Key takeaways
ICT reviews a simulated GBP/USD long from December 5, 2017, linking a daily bullish bias and presumed sell-stop sweeps below equal lows to London and New York session entries.
Read the full summary
ICT reviews a simulated GBP/USD long from December 5, 2017, linking a daily bullish bias and presumed sell-stop sweeps below equal lows to London and New York session entries. On the 15-minute chart at five minutes eight seconds, he describes buying after price cleared an old low, equal lows, and a double bottom, with roughly five or six pips of adverse movement excluding spread, then retaining one standard lot and removing half of that remainder at six minutes 35 seconds. For the New York setup, he defines a body-based range, measures from the London low to the highest candle body, and identifies a 62% retracement during his New York open kill zone at nine minutes 28 seconds. After missing the initial reaction, he enters on a return to down-close candles labeled a bullish order block, then scales out around Fibonacci-derived target one and target two levels. A small remainder reportedly stayed open, with approximately 1.3480 as an intermediate area, 1.3555 as the broader objective, and 1.3660 conditional on further extension. The review emphasizes higher-timeframe direction, prior highs and lows, separate setup and execution logic, patience during choppy price action, and partial exits, but the chart, fills, demo interface, quoted results, and final outcome cannot be independently verified, so the commentary does not establish a repeatable edge or live performance.
How we researched this article
BestProps used document-based research from primary firm sources, checked September 25, 2026. The complete source list, scope, limitations, and commercial-state record appear near the end of this article.
Watch the source video: ICT – Trade Review GbpUsd & Commentary (uploaded December 5, 2017)
Playback on other websites has been disabled by the video owner. Click the link to watch on YouTube.
References and Resources
- Primary source: ICT – Trade Review GbpUsd & Commentary (YouTube)
- The Inner Circle Trader channel (YouTube)
- CFTC Advisory: Fraud Advisory – Foreign Currency Trading Systems (official)
- Investor.gov: Day Trading – Risks and Regulations (official)
In ICT – Trade Review GbpUsd & Commentary, uploaded on December 5, 2017, ICT reviews a GBP/USD long idea spanning the London and New York sessions. He explains the liquidity-based reasoning he used, identifies a retracement entry during the New York session, and discusses scaling out of a demo position.
This is a retrospective explanation of ICT’s interpretation, not independent evidence that the concepts provide a repeatable trading edge. The transcript also cannot verify the chart, account interface, quoted fills, or eventual outcome of the remaining position.
ICT GBPUSD Trade Rally Logic
After explaining that an antivirus pop-up obscured much of his original screen recording, ICT begins the chart discussion on the daily timeframe at 1:30. He describes GBP/USD as having moved higher and says he expected an attempt to trade above an earlier high.
His intraday bullish thesis rested on what he characterized as repeated failures to sustain moves below prior lows. At 2:40, he notes that earlier declines had moved beneath equal or short-term lows before rallying away. Within ICT’s framework, those lows represented areas where sell stops could be resting.
Moving to an hourly view, he says price first moved slightly through equal lows and later declined more aggressively through additional lows. The transcript records a reference to “exactly 20 pips below” and a level transcribed as 133.88. Because the captions were produced by automatic speech recognition and the chart is not available for verification here, that numerical reference should be checked against the video itself.
ICT GBPUSD London Session Trade Entry
At 5:08, ICT shifts to a 15-minute chart and describes price trading through an old low, equal lows, and a previous double bottom. He says he entered long as price drove into that area after clearing the stops.
ICT reports that the position experienced approximately five or six pips of adverse movement, excluding spread. He also characterizes the subsequent trading as choppy and says patience was necessary. These are the speaker’s retrospective statements; the transcript alone does not establish the precise entry, drawdown, or execution conditions.
During the review, ICT says he retained one standard lot from the London entry before reducing it further. At 6:35, he discusses taking off half of that remaining amount. He explicitly describes the displayed result as demo profit, making this a simulated-account example rather than documented live-account performance.
ICT GBPUSD New York Session Setup
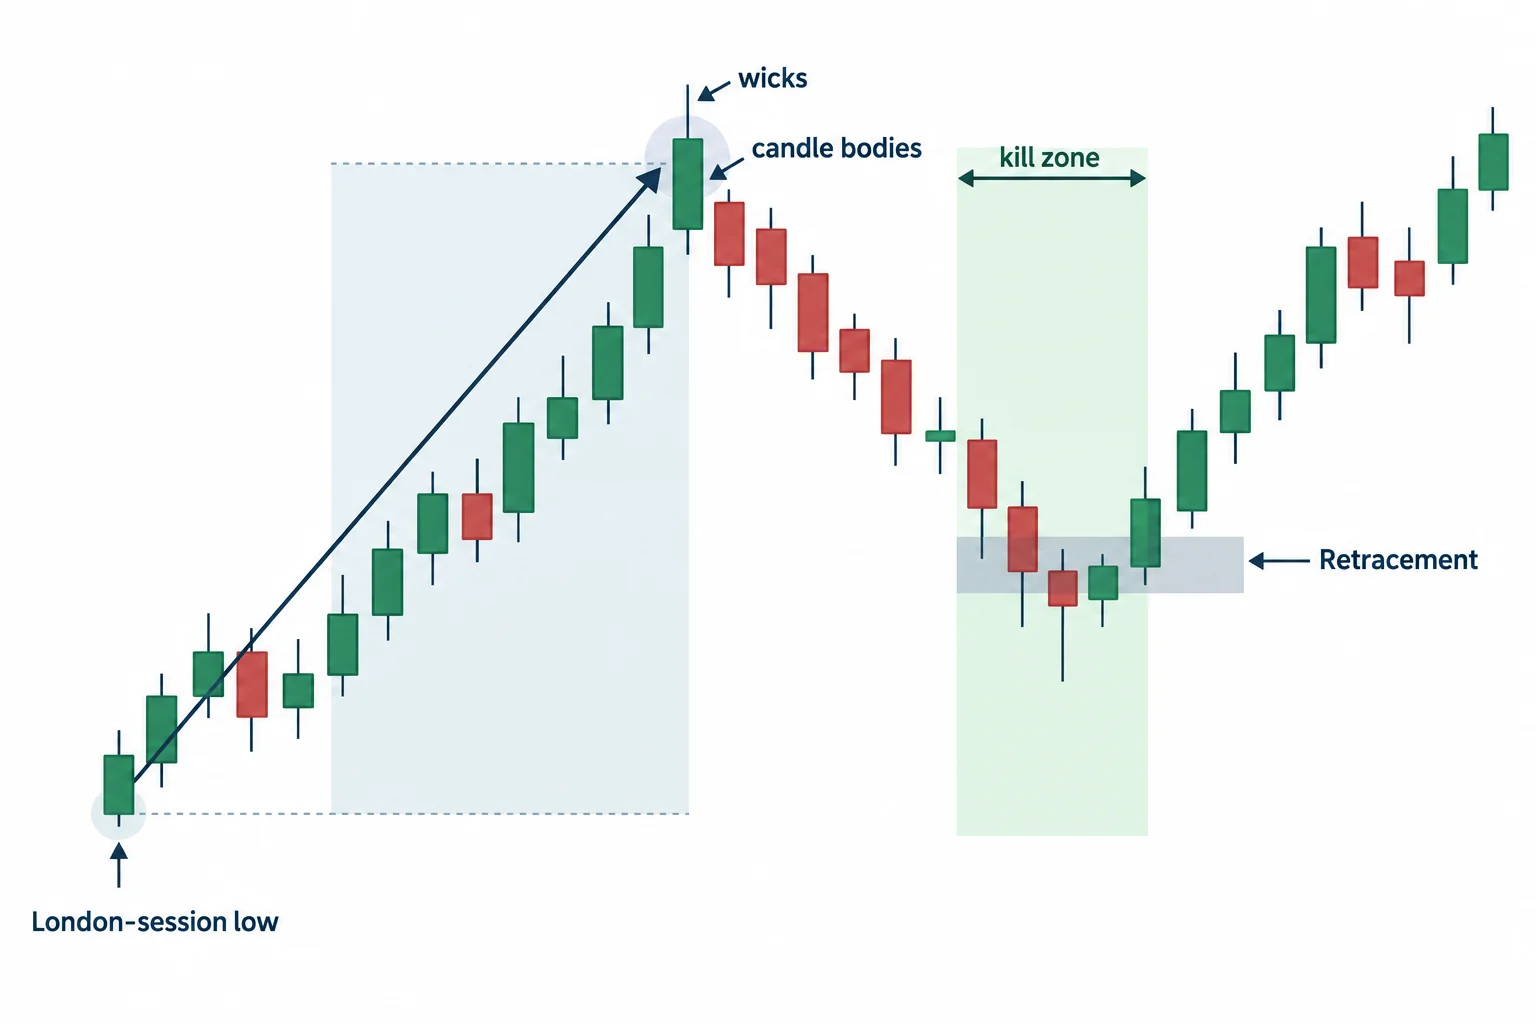
ICT then examines a separate New York-session entry. He defines a range using candle bodies rather than wicks, extending from a lower candle body to a closing reference point. According to his explanation at 7:14, price wicked through part of this range without moving below the underlying low, which he interpreted as support for a possible rally toward what he calls a symmetrical price swing.
GBPUSD Retracement and Order Block Logic
On the five-minute chart, ICT measures a move from a London-session low to the highest candle body. At 9:28, he says price retraced to the 62% level during what he identifies as the New York open “kill zone.” That phrase is ICT terminology for a selected session window, not a guarantee that a setup will occur.
ICT says he did not enter on the initial reaction because price rallied away first. When it returned, he used a group of down-close candles as what he calls a bullish order block and entered while the current candle was bearish. In his account, that order-block interpretation gave him a way to participate after missing the first retracement entry.
ICT GBPUSD Trade Exits and Profit Targets
Rather than describing a single all-or-nothing exit, ICT says he reduced the position at several target areas. At 10:13, he points to multiple profit-taking locations associated with Fibonacci-derived “target one” and “target two” levels. He compares the clustering of exits around those levels to examining a grouping on a target.
Near the end, ICT says a small remainder was still open. He mentions approximately 1.3480 as an intermediate area and 1.3555 as a broader objective, with 1.3660 considered only if price extended further. These were prospective targets in his commentary, not confirmed outcomes. The video ends without establishing whether GBP/USD later reached them or stopped out the residual position.
Key Lessons From the ICT GBPUSD Trade Review
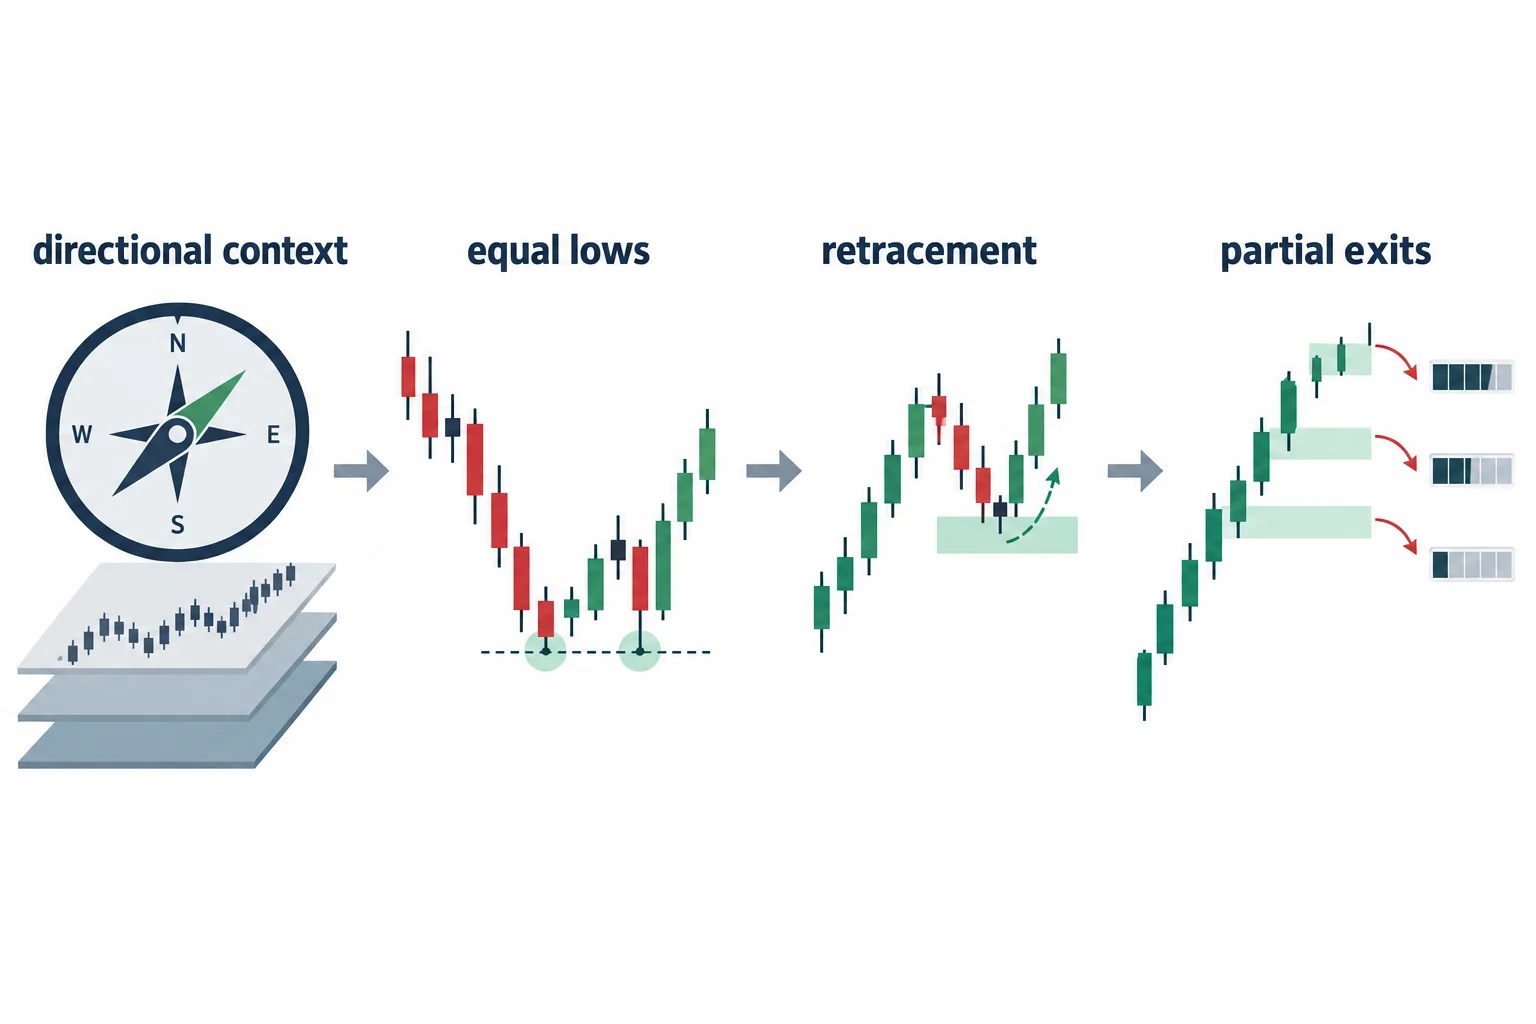
- Begin with directional context: ICT formed a daily-timeframe expectation before discussing lower-timeframe entries.
- Use prior highs and lows as reference areas: His thesis focused on moves through equal lows and the possibility of price later seeking older highs.
- Separate the setup from execution: The London entry followed a sweep of lows, while the New York entry used a retracement and an alleged bullish order block.
- Plan partial exits: ICT describes reducing exposure around predefined target zones instead of relying on one final exit.
- Recognize unresolved outcomes: A trade review can explain the speaker’s process even when a remaining position is still open and its eventual result is unknown.
The most useful aspect of this video is its step-by-step account of how ICT connected higher-timeframe bias, presumed stop liquidity, session timing, retracement levels, and partial exits. These ideas are presented as ICT’s own market interpretation and should be studied critically rather than treated as validated performance claims or investment advice.



