
Key takeaways
ICT argues that one-minute forex charts show the same traded-price sequence as higher intervals rather than meaningless noise, with larger timeframes merely compressing activity into fewer candles.
Read the full summary
ICT argues that one-minute forex charts show the same traded-price sequence as higher intervals rather than meaningless noise, with larger timeframes merely compressing activity into fewer candles. His top-down process uses weekly and daily charts for directional bias, one-hour and four-hour charts for setups, five-minute and 15-minute charts for execution, and the one-minute chart only to illustrate precision. In a demo-account GBP/USD example beginning around 28 minutes 28 seconds, he interprets consolidation, a move below a prior low, a return to an order block, upward displacement through buy-side liquidity, a market maker sell model, trading around the 1.23 big figure, a market-structure break, and equal lows as a short target. Buy-side liquidity is framed as breakout buys and short stops above highs, while sell-side liquidity includes long stops and other sell orders below lows. ICT treats round numbers and ten-pip increments as layered liquidity rather than merely psychological levels, but the transcript provides no order-book evidence, independently verifiable fills, representative performance test, or proof of profitability. The practical framework is to establish higher-timeframe direction, mark highs, lows and consolidations, infer where orders and stops may cluster, watch for decisive displacement, and save before-and-after charts to reduce hindsight bias. Related terminology guides are available at theinnercircletraders.com.
How we researched this article
BestProps used document-based research from primary firm sources, checked September 25, 2026. The complete source list, scope, limitations, and commercial-state record appear near the end of this article.

In Is Forex Intraday Really Just “Noise”?, uploaded on August 27, 2019, ICT disputes the idea that very short-term forex charts contain nothing but random, unusable movement. His central argument is that the same price appears across every chart interval; changing the timeframe changes its visual presentation, not the underlying sequence of traded prices.
The presentation uses a one-minute GBP/USD chart as an example. Because the transcript cannot show the chart itself, the annotations, order placement and displayed account information cannot be independently inspected here. ICT also states that the illustrated fills came from a demo account, so the video should be read as a lesson in his interpretation of price action, not as verified evidence of live profitability.
ICT’s Argument Against Forex Intraday Noise
ICT introduces his thesis near the beginning: what some observers call noise can instead be interpreted as a price-delivery narrative. He acknowledges that he once accepted the noise argument himself, but says he later rejected it after changing how he studied price action. This framing begins at approximately 1:13.
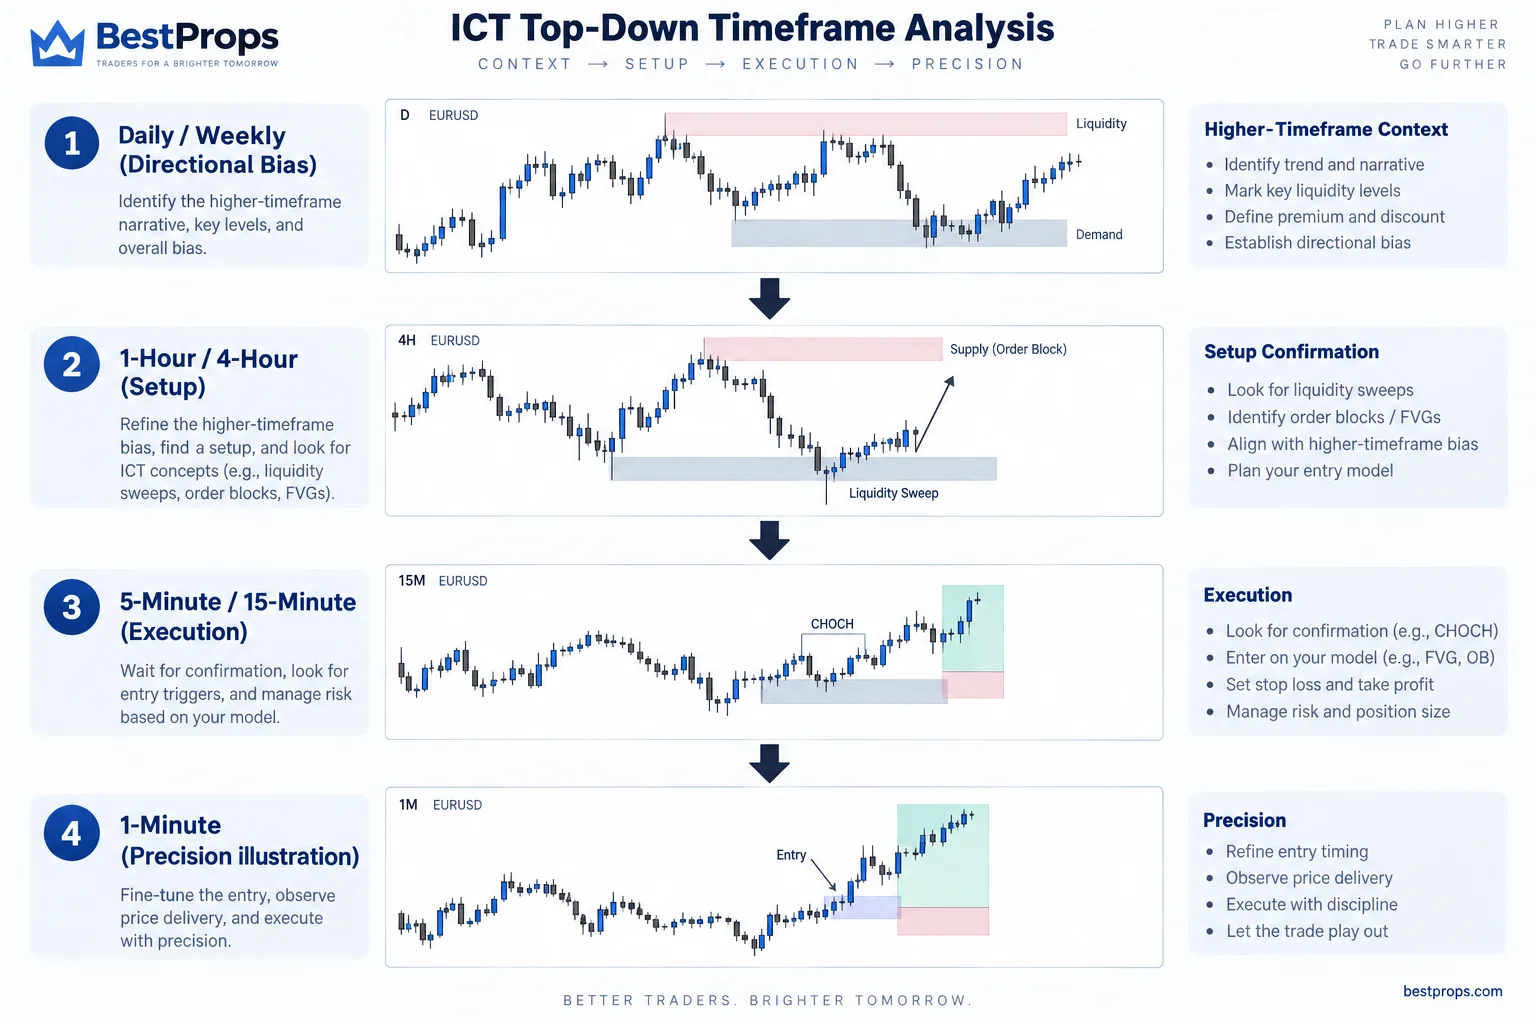
Importantly, ICT does not say that he normally develops an entire trade idea from a one-minute chart. At 4:52, he explains a top-down process:
- Directional bias is usually derived from the daily chart, often with reference to the weekly direction.
- A setup is generally identified on the one-hour or four-hour chart.
- Execution commonly occurs on a five- or 15-minute chart.
- The one-minute chart is used in this video to make a point about price precision, not to prescribe one universal execution interval.
This distinction matters. His case is not simply that traders should move to the smallest chart available. It is that lower-timeframe movement may remain interpretable when placed inside a higher-timeframe thesis.
ICT Forex Price Action in GBP/USD
Beginning around 28:28, ICT describes a sequence on a one-minute GBP/USD chart. In his terminology, price first consolidates, trades below a prior low, returns to an “order block,” and then displaces upward through what he calls buy-side liquidity.
His definitions in this section are straightforward even if a viewer does not accept the broader theory:
- Buy-side liquidity refers to buy orders that may collect above a visible high, including breakout entries and protective stops on short positions.
- Sell-side liquidity refers to sell orders that may collect below a visible low, including protective stops on long positions.
- Equal highs or lows are treated as conspicuous areas where such orders may cluster.
- Displacement describes a relatively forceful movement away from a consolidation.
ICT labels the overall formation a “market maker sell model.” He describes selling near a rally, buying back around the earlier consolidation, taking a long position, and later selling above the 1.23 “big figure.” He then describes another short after what he calls a break in market structure, targeting the equal lows below. The transcript supports this account of what he says he did, but it does not independently establish the precise fills or permit visual verification of the chart.
Why Liquidity Shapes ICT Forex Price Action
At approximately 39:59, ICT explains his version of “reading the tape.” Rather than treating a wick, double bottom or breakout as a self-contained pattern, he asks where other participants may have placed entries and protective stops. In the example, he interprets stops above a prior high as potential counterparties for exiting a long and initiating a short.
He also rejects the conventional description of round numbers as merely psychological levels. Around 41:26, he instead characterizes prices such as 1.23 and nearby ten-pip increments as areas of layered liquidity.
These are ICT’s market interpretations. The video does not provide independent order-book data demonstrating that the described participants or orders were present. It also contains much broader claims about central banks, algorithmic price delivery and market manipulation that are asserted rather than established with evidence in the transcript.
How Timeframes Change Forex Intraday Price Action
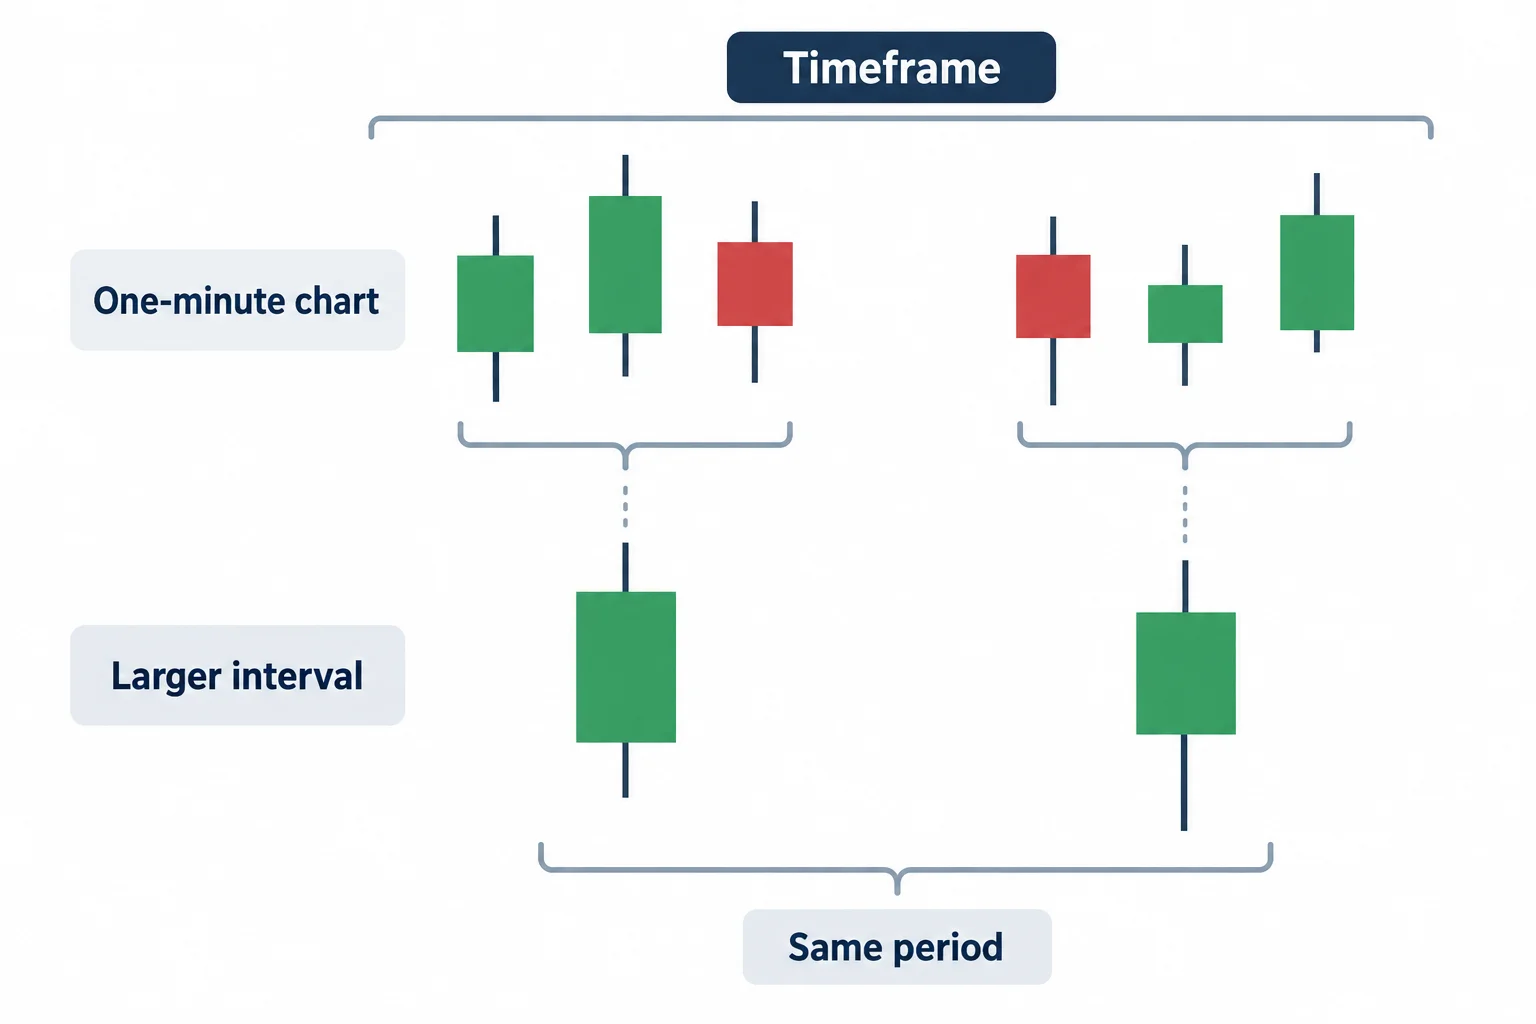
ICT returns to the core question at 50:04. In his view, a one-minute chart stretches a formation across many candles, while a larger interval compresses the same period into fewer candles. The timeframe is therefore a display window: it shows where current price stands relative to previously traded prices.
Near 57:10, he summarizes the point more directly: price remains price regardless of whether it is displayed on a one-minute, 15-minute or daily chart. He notes that broker feeds and spreads can create small differences, but argues that searching for a secret institutional timeframe misses what he considers the more important question, where orders and liquidity may be concentrated.
Practical Lessons From ICT Forex Intraday Price Action
A cautious takeaway is not that every one-minute fluctuation can be forecast. Rather, the video offers a structured way to examine intraday movement:
- Begin with a higher-timeframe directional premise.
- Mark obvious prior highs, lows and consolidations.
- Consider where breakout orders and protective stops might plausibly cluster.
- Observe whether price moves decisively away from or back into those areas.
- Save before-and-after chart captures so that analysis is not reconstructed solely with hindsight.
That framework can be studied descriptively without accepting ICT’s strongest claims. The video presents one educator’s interpretation of a chart and a demo-account illustration; it does not test the method over a representative sample, establish profitability or remove the substantial risks of short-term currency trading.
ICT Forex Intraday Video
ICT Forex Intraday Resources
- The Inner Circle Trader (official site) ICT's own website and mentorship portal.
- What is ICT Trading? (theinnercircletraders.com) A structured introduction to the ICT framework and terminology.
- Understanding Buy-Side and Sell-Side Liquidity (theinnercircletraders.com) Detailed explanation of the liquidity concepts referenced in the video.
- ICT Order Block Guide (theinnercircletraders.com) Covers the order block concept used in the GBP/USD example.




