
Key takeaways
ICT’s October 11, 2017 YouTube video Pattern Recognition Failed OTE and FOMC Mitigation Example reviews a GBP/USD long where the first Optimal Trade Entry was stopped out, but the bullish thesis remained intact and a second OTE used the same 62% to 79% retracement range.
Read the full summary
ICT’s October 11, 2017 YouTube video Pattern Recognition Failed OTE and FOMC Mitigation Example reviews a GBP/USD long where the first Optimal Trade Entry was stopped out, but the bullish thesis remained intact and a second OTE used the same 62% to 79% retracement range. ICT expected price to run above the prior day’s high and intraday equal highs, viewing them as potential buy-stop liquidity, then reduced risk by moving the stop above entry and scaling out as price advanced around the FOMC announcement. At eight minutes 13 seconds, he says the first scale-out nearly offset the original loss and later exits more than covered it. He cited 1.3242 as the upside objective, a session high of 1.3237, and exits near 1.3234 to 1.3235 rather than demanding a perfect target fill. The core lesson is to distinguish entry invalidation from thesis invalidation, re-enter only with a fresh stop and defined risk, and mitigate losses through risk reduction and partial exits rather than widening the failed trade’s stop. The account relies on an automatically generated transcript, so charts, executions, order details, liquidity claims, and reported performance were not independently verified, while FOMC slippage and reversal risk remain material.
How we researched this article
BestProps used document-based research from primary firm sources, checked September 25, 2026. The complete source list, scope, limitations, and commercial-state record appear near the end of this article.
In the video Pattern Recognition – Failed OTE & FOMC Mitigation Example, uploaded October 11, 2017, ICT reviews a GBP/USD long idea in which an initial Optimal Trade Entry (OTE) was stopped out before he re-entered using the same basic pattern. The lesson is less about a setup working perfectly than about how he separated his directional thesis from a failed entry.
This account is based on an automatically generated transcript. The recording’s charts, order ledger, prices and executions have not been independently verified.
ICT Pattern Recognition Before FOMC
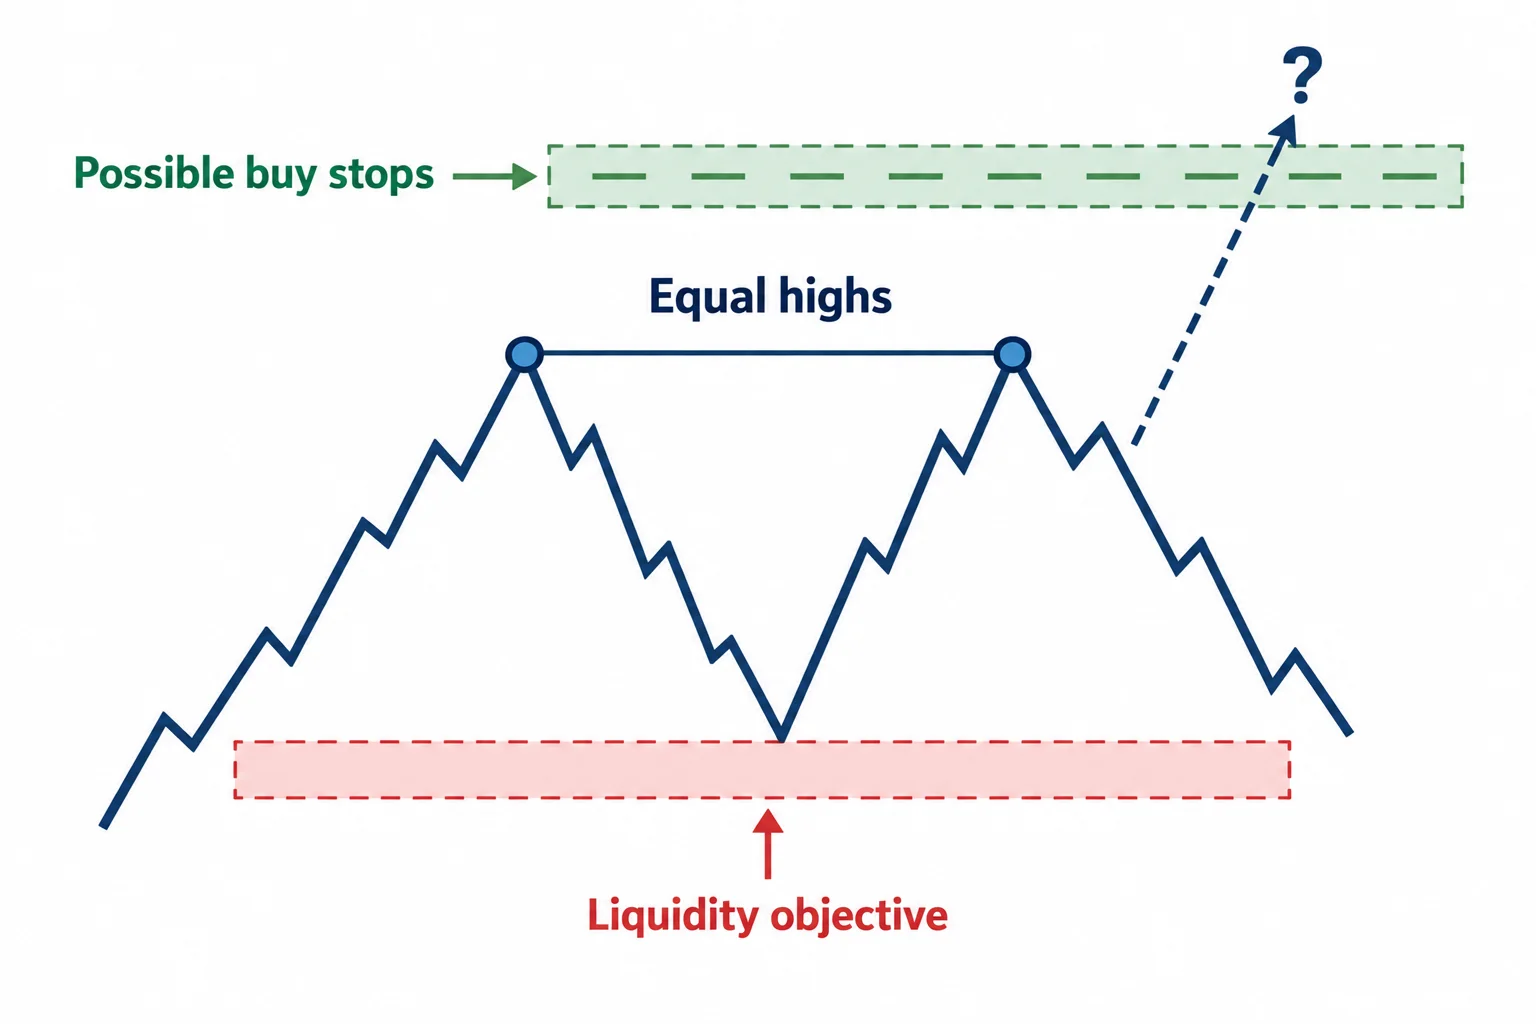
At 0:07, ICT introduces the segment as an FOMC example involving mitigation of an earlier loss. He says he is long GBP/USD after re-entering at what he calls an OTE.
His directional expectation was that price would run above the prior day’s high. He treated the current intraday high and the previous day’s high as effectively equal highs. In ICT’s interpretation, traders viewing that formation as a double top could place buy stops above it, making the area a potential liquidity objective. This is ICT’s market framework, not independently established evidence that orders were actually concentrated there or that a particular class of participant controlled the move.
As price advanced, ICT says he moved his stop above entry so that the re-entry no longer carried its original downside risk. Around 2:07, he explains that he had entered while the market appeared to be breaking down. He interpreted the rapid decline as a move toward sell-side stops rather than as confirmation that his bullish premise had failed.
FOMC Entry and Trade Mitigation
The footage was sped up as the FOMC announcement approached. At approximately 2:49, ICT notes that the announcement is about four minutes away. Price then spikes through the prior day’s high and the equal-high area.
ICT says he had wanted to reduce part of the position above those highs but did not act quickly enough while moving between screens. After the spike and pullback, he tightened his stop. He also reports that part of the position had already been removed, although the transcript alone cannot confirm the displayed executions.
At 4:04, he discusses price consolidating near a high after the announcement. He expected that high to be exceeded and contrasts his analysis with a simple bearish reading of the long-wick FOMC candle. His broader point is that a single candlestick should not automatically override the surrounding liquidity and directional context in his model.
Why the ICT OTE Entry Failed
The chart review begins around 6:09. ICT says his first long entry was based on a price swing retracing into an OTE region. He describes his stop as relatively tight and acknowledges that he incorrectly expected a level associated with the high from two days earlier not to be revisited after several tests. Price returned to that area and, according to his narration, stopped him out.
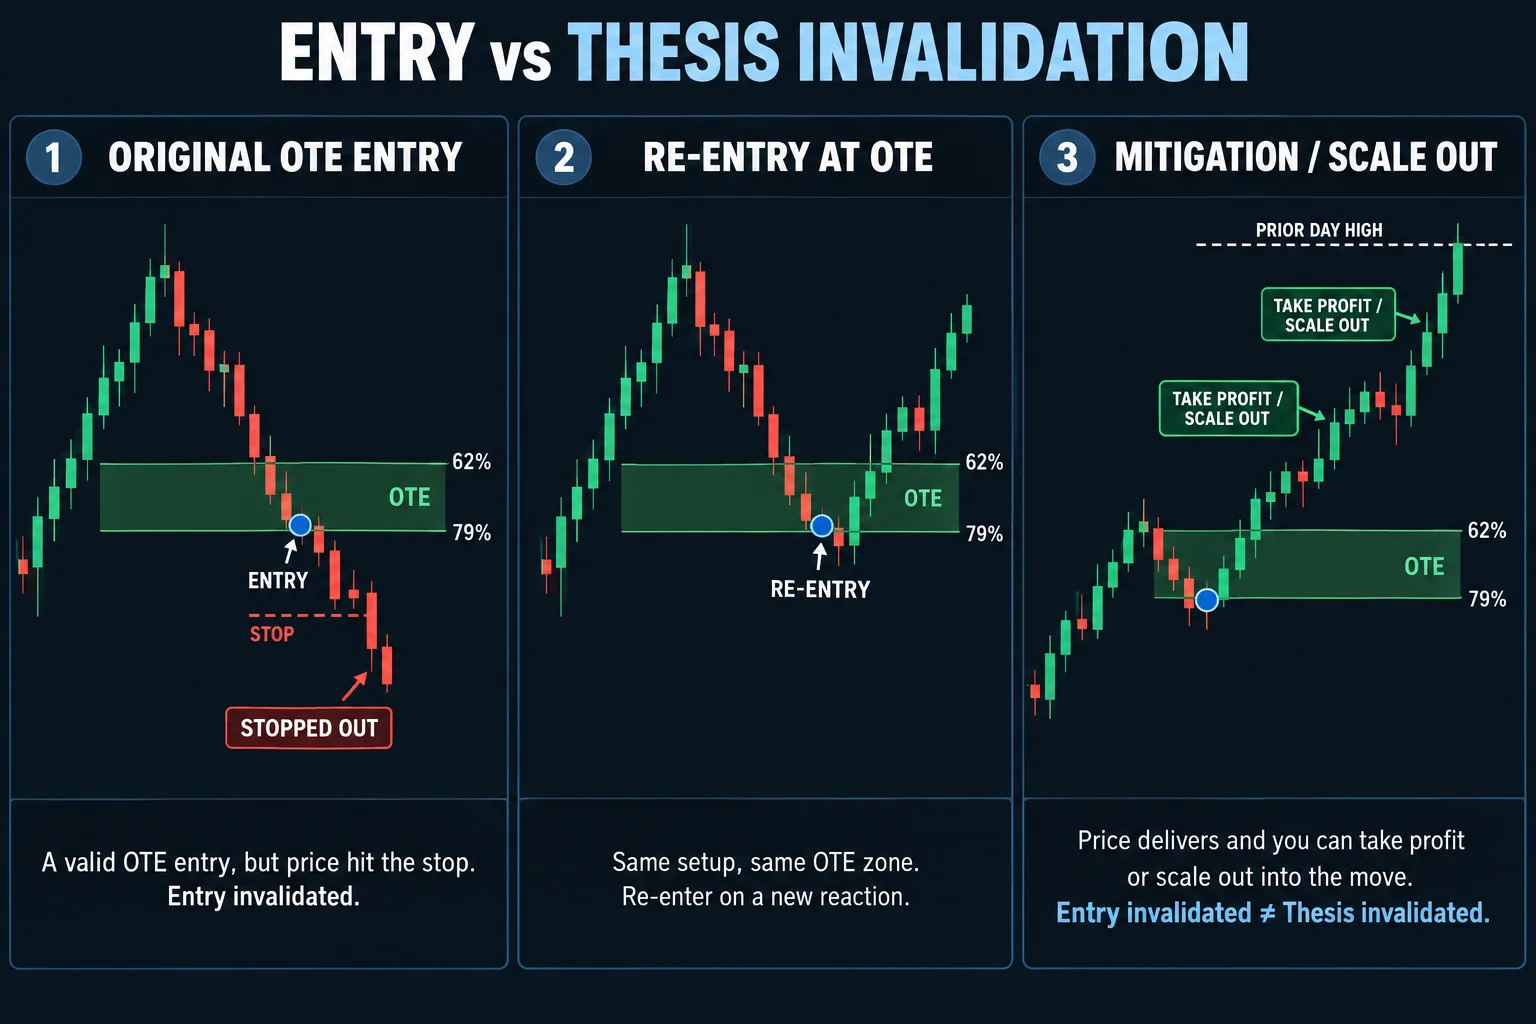
After that run through the level, he entered again. At 7:06, he explains that the second attempt used the same price structure and an OTE between the 62% and 79% retracement levels. He openly identifies the stop-out as a break in the anticipated pattern, but says it did not change his broader expectation that price would trade above the previous day’s high.
This distinction is central to the lesson:
- Entry invalidation: The first stop indicated that the timing or risk placement for that specific entry had failed.
- Thesis invalidation: ICT did not believe the failed entry had disproved his larger directional idea.
- Re-entry: He waited for another retracement into the same defined OTE range rather than widening the original stop.
- Risk reduction: Once the second attempt moved favorably, he says he tightened risk and scaled out instead of demanding the maximum target.
How FOMC Mitigation Worked in This Example
ICT uses mitigation here in the practical sense of recovering an earlier trading loss through the management of a later position. At 8:13, he says the first scale-out nearly offset the prior loss and that the remaining exits more than covered it. Those performance statements are his own account and cannot be validated from an audio transcript.
He later identifies 1.3242 as an upside objective previously posted to his social account and says he preferred exiting before that target rather than insisting on a perfect fill at the projected level. The transcript records him citing a session high of 1.3237 and exits near 1.3234–1.3235, but these figures should be checked against the original chart because the captions were produced by automated speech recognition.
ICT Pattern Recognition Lessons From the Failed OTE
The most transferable idea is not that every failed retracement entry deserves another attempt. Rather, the example shows the value of defining separately what invalidates an entry and what invalidates the underlying analysis. A stopped position can reveal poor timing without necessarily resolving the larger directional question, but re-entry still creates fresh risk and requires its own invalidation point.
The video also illustrates event risk. FOMC releases can coincide with abrupt movement, slippage and rapid reversals, none of which can be assessed fully from the transcript. ICT’s reported outcome is one historical example, not evidence that OTE re-entries or liquidity-based interpretations are consistently profitable. This commentary is educational and is not investment advice.
Watch the ICT FOMC Example
The full clip is available on YouTube at Pattern Recognition – Failed OTE & FOMC Mitigation Example. The uploader has disabled embedding for this video, so it is served as a watch card rather than an inline player.
More ICT Pattern Recognition Resources
- The Inner Circle Trader Official ICT resource library and mentorship overview.
- The Inner Circle Trader – YouTube channel The primary source of ICT's mentorship lectures.
- ICT Index Wiki A community-maintained index of ICT study paths and playlists (unofficial).




