
Key takeaways
ICT’s September 22, 2021 EUR/USD lesson presents a bearish OTE framework that starts with an eight-hour directional bias and sell-side liquidity beneath prior or approximately equal lows, defines a dealing range from swing high to swing low, and seeks a short on a retracement into the upper range at a minimum 62% level near 1.1755,…
Read the full summary
ICT’s September 22, 2021 EUR/USD lesson presents a bearish OTE framework that starts with an eight-hour directional bias and sell-side liquidity beneath prior or approximately equal lows, defines a dealing range from swing high to swing low, and seeks a short on a retracement into the upper range at a minimum 62% level near 1.1755, with 70.5% described as the midpoint between rounded 62% and 79% levels. Confluence includes a bearish order block formed by up-close candles, an hourly sweep above nearby highs interpreted as buy-side liquidity collection, rejection from the highest 15-minute candle, and FOMC volatility. ICT says he entered short and took partial exits lower through an execution displayed on TradingView, but the transcript cannot verify the chart levels, fills, size, account, or result. He recommends checking economic calendars, accepting losses, using stops and money management, avoiding high trade frequency, and waiting for roughly one preferred setup per week rather than expecting OTE daily, while the article stresses that OTE is ICT’s interpretation rather than a validated edge and requires historical and simulated testing.
How we researched this article
BestProps used document-based research from primary firm sources, checked September 25, 2026. The complete source list, scope, limitations, and commercial-state record appear near the end of this article.
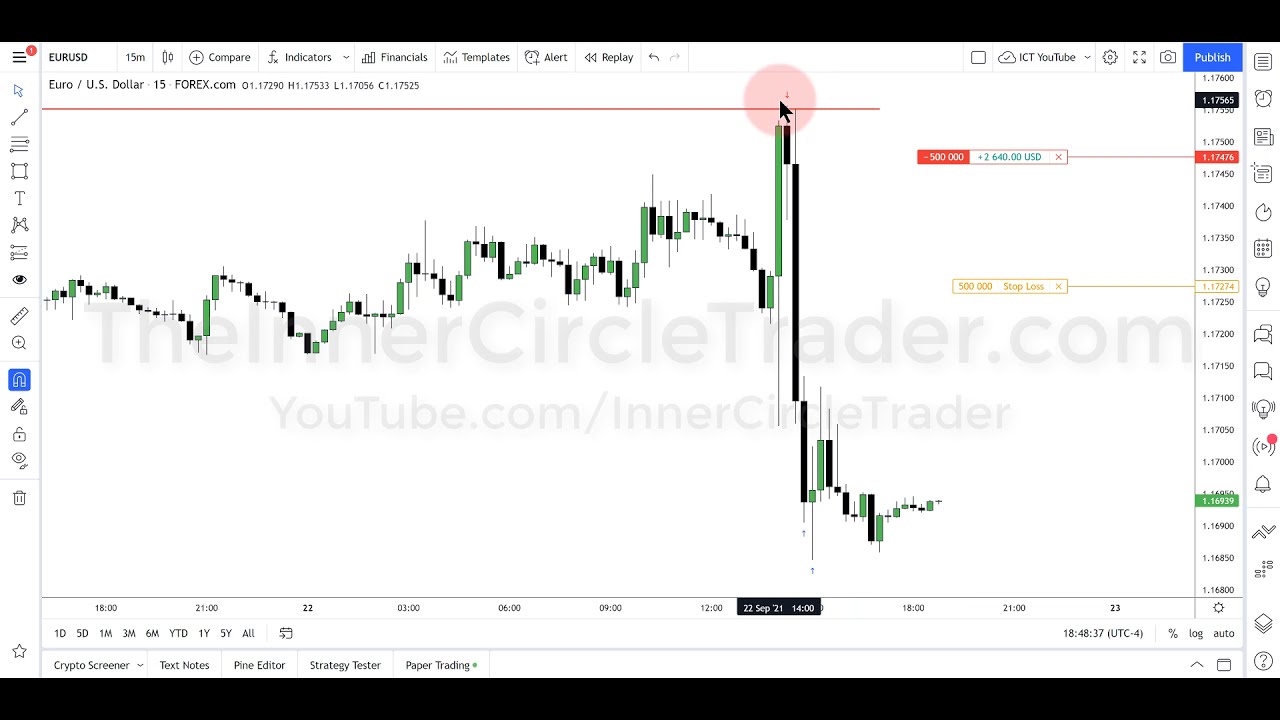
Watch on YouTube — ICT Forex OTE lesson
In Forex Price Action Lesson – OTE Fiber 09/22/21, ICT reviews a bearish EUR/USD setup associated with the September 22, 2021 trading session. The lesson connects directional bias, liquidity, a dealing range, Fibonacci retracement levels, a bearish order block and scheduled FOMC-related volatility.
The presentation reflects ICT’s interpretation of price action rather than an independently established trading edge. Because the source transcript was produced by automatic speech recognition and the chart itself is not available here for verification, the discussion can explain his framework but cannot confirm every displayed level, order or result.
ICT Forex Bearish Bias and Liquidity Target
ICT begins on EUR/USD by contrasting his analysis with what he describes as a conventional retail view of support. At 0:48, he points to a price swing and asks where a retail trader might expect support. In his account, buyers entering at that support would commonly place protective sell stops beneath it.
He therefore treats the low (and potentially the area just beneath it) as an objective for declining price. This leads him to frame EUR/USD as bearish rather than looking for a bounce. The important educational distinction is that his directional premise comes before the entry pattern: he is not using a Fibonacci retracement by itself to decide direction.
On the eight-hour chart, ICT identifies prior or approximately equal lows as what he calls a “draw on liquidity” (3:11). Under his terminology, sell-side liquidity is expected to rest beneath those lows because that is where sell stops may be clustered. This lower area becomes the proposed destination for the bearish scenario.
ICT OTE Dealing Range and Entry Zone
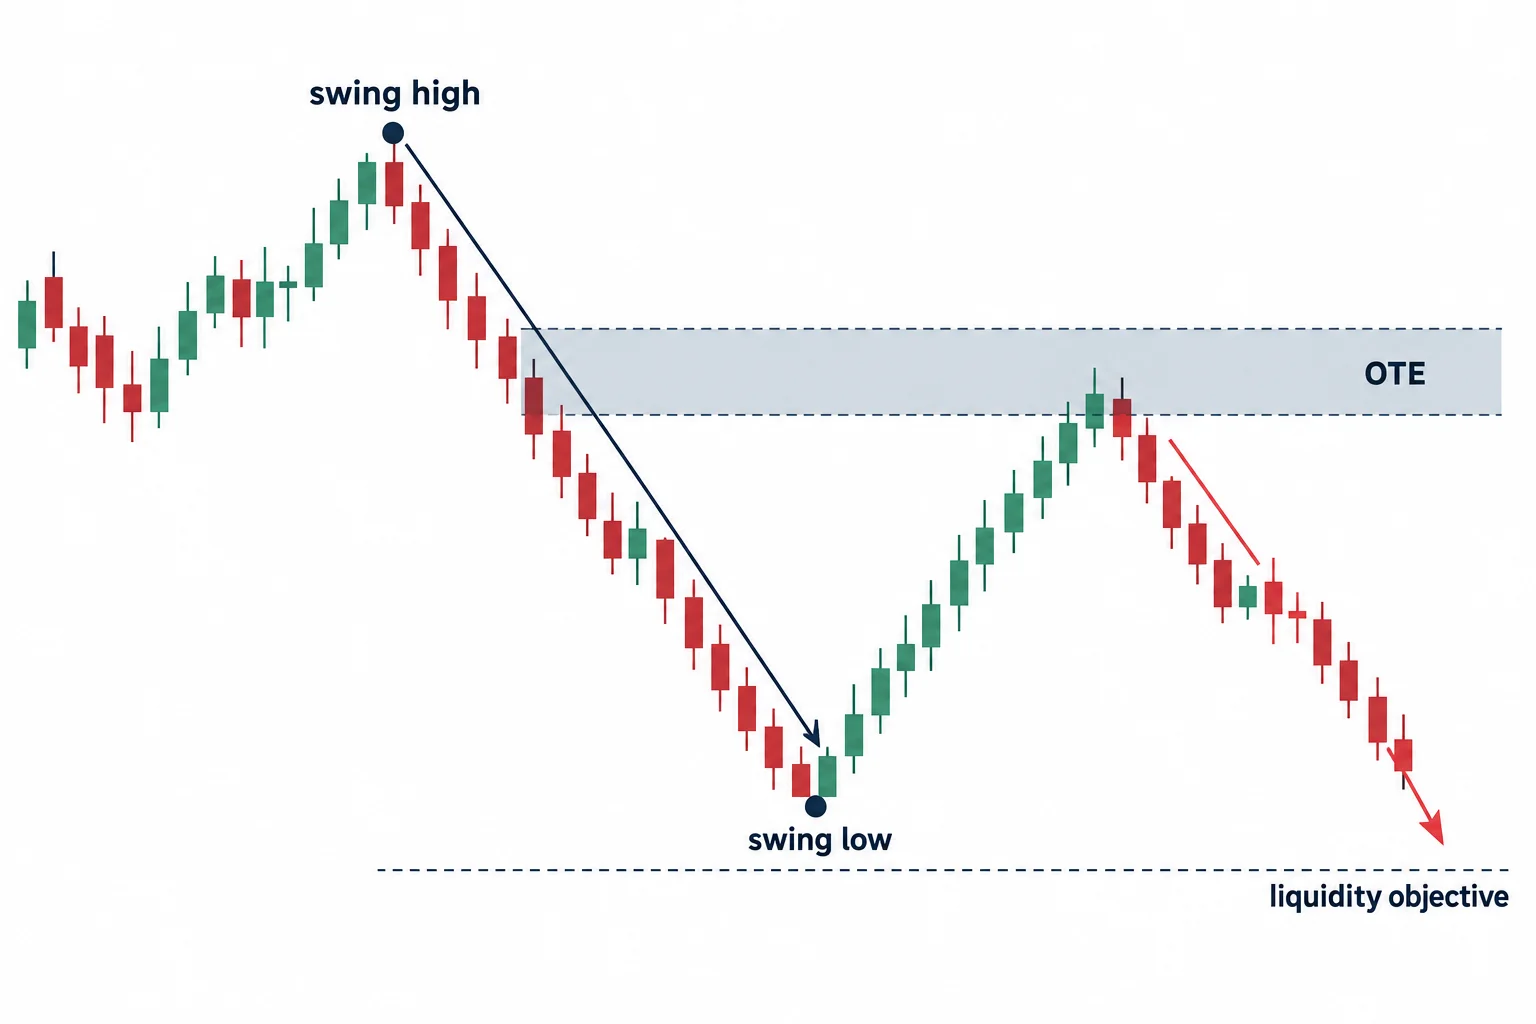
ICT next defines a dealing range from a visible high down to a subsequent low. He applies a Fibonacci retracement from that high to the low and describes a retracement back into the upper portion of the range as a potential selling opportunity.
At 3:50, he outlines the central OTE sequence:
- Identify a bearish dealing range from a swing high to a swing low.
- Measure the retracement back toward the range’s upper portion.
- Treat the 62% retracement as his minimum level of interest for a short.
- Also monitor the 70.5% area, which he describes as the midpoint between his rounded 62% and 79% levels.
- Seek alignment with bearish context and a downside liquidity objective.
“OTE” refers to ICT’s “optimal trade entry” pattern. Despite the name, the transcript does not establish that the zone is objectively optimal or profitable across a tested sample. It is best understood here as the label for his preferred retracement framework.
ICT cites a 62% retracement near 1.1755 and says the relevant candle moved only a few “pipettes” beyond it (5:05). Those figures depend on the unseen chart and may be imperfectly rendered by speech recognition, so they should not be treated as independently verified price data.
ICT Price Action and Bearish Order Block
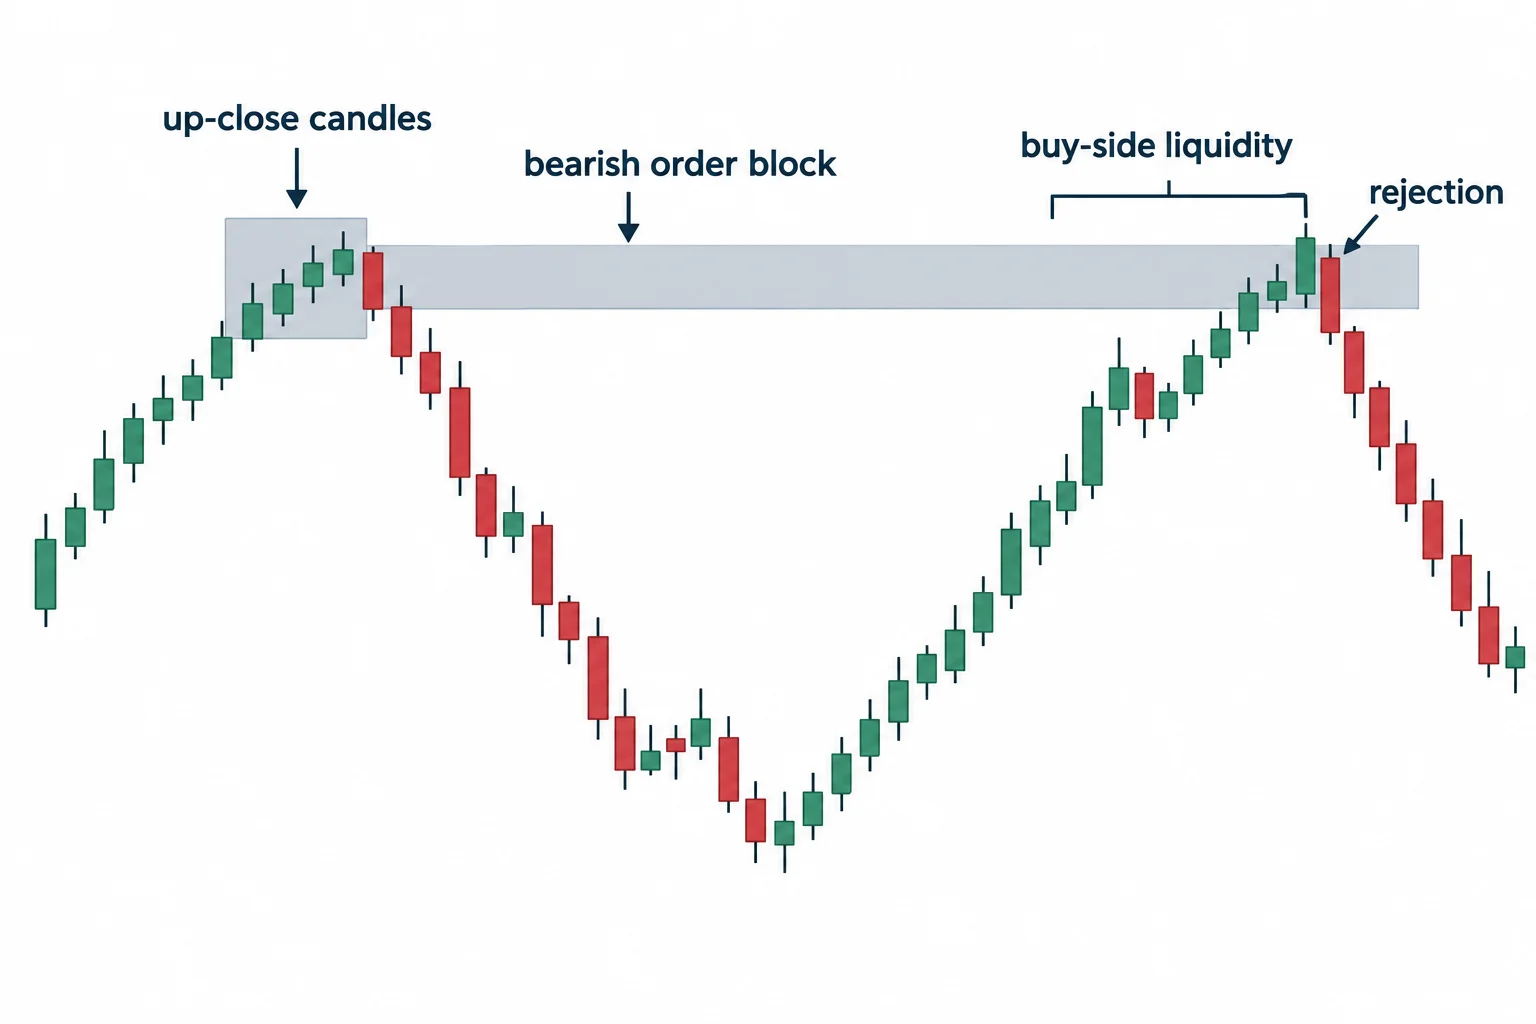
The next layer is what ICT labels a bearish order block. Around 5:29, he identifies a group of up-close candles as the relevant block. His setup therefore combines several elements rather than relying on one signal:
- a bearish higher-time-frame bias;
- lower lows serving as the proposed liquidity target;
- a retracement into the OTE area;
- a bearish order block near that retracement; and
- a scheduled event capable of increasing volatility.
Moving to the hourly chart, he says price traded above nearby highs, where he expected buy stops to rest, and then rejected the area (6:16). In ICT’s reading, that movement collected buy-side liquidity before the anticipated decline. This is his market interpretation; the transcript alone cannot establish who placed orders there or why price moved.
Forex Price Action During FOMC Volatility
ICT links the setup’s timing to the FOMC monetary-policy event on September 22. At 7:47, he characterizes the move as manipulation occurring around high-impact news. More generally, he recommends using an economic calendar to identify when a chosen market may experience a volatility injection.
His practical workflow is to establish a directional idea first, identify the market and liquidity objective, and then note when scheduled medium- or high-impact events may concentrate activity. He compares the economic calendar to an old television guide: it does not determine the outcome, but it tells the trader when an important event is scheduled (9:18).
That does not make news-driven trading predictable. Announcements can produce rapid movement, slippage and invalidation in either direction. The transcript also does not provide a complete, reproducible rule set for entries, stops, sizing or exits.
ICT Trade Entry and Lesson Guidance
ICT says he entered short as price moved away from the highest 15-minute candle and took partial exits lower (8:18). He also says the video displays an execution through TradingView. A transcript cannot authenticate the account, fill prices, position size or realized result, so these remain the speaker’s claims rather than independently confirmed performance.
The broader lesson is selective preparation rather than constant trading. ICT explicitly says the pattern should not be expected in every session or every day. He urges students to study multiple playlists, review lessons repeatedly and develop a model compatible with their own temperament. He also acknowledges that losses are unavoidable and mentions stop-loss use and money management at 15:40.
Near the end, ICT warns against high trade frequency and suggests waiting for one preferred setup per week in the conditions he perceived at that time (21:41). That warning was specific to his September 2021 commentary, not a verified description of current market risk.
ICT Forex Lesson Takeaways
The lesson’s core idea is confluence: begin with a higher-time-frame directional thesis, mark a likely liquidity destination, define a dealing range, wait for a retracement into ICT’s OTE and order-block area, and pay attention to scheduled volatility. Students evaluating the concept should separate chart description from causal claims and test clearly defined rules on historical and simulated data before drawing conclusions. This summary is educational commentary, not investment advice or a promise of results.
Resources
- ICT Forex Price Action Lesson – OTE Fiber 09/22/21 on YouTube — Full original video
- TradingView — Platform used throughout this lesson for chart analysis and execution display
- FX Street Economic Calendar — ICT references using economic calendars to identify high-impact volatility events
- ICT Forex Trading Series on YouTube — Broader ICT forex framework



