
Key takeaways
ICT’s Bitcoin Review Community Post Call, uploaded November 17, 2021, retrospectively explains a November 15 YouTube Community chart as an educational study of directional bias, market structure and liquidity rather than a live trade or Bitcoin recommendation.
Read the full summary
ICT’s Bitcoin Review Community Post Call, uploaded November 17, 2021, retrospectively explains a November 15 YouTube Community chart as an educational study of directional bias, market structure and liquidity rather than a live trade or Bitcoin recommendation. ICT says he had never traded Bitcoin with real money and had used only paper trading, while finding crypto less consistent than futures and foreign exchange. At 3 minutes 5 seconds he identifies a bearish breaker within a high, low and higher-high sequence, and at 5 minutes 20 seconds says the post’s eyeball icon directed students toward a possible decline rather than a short entry. On daily and hourly charts he interprets moves above an April 2021 high as buy-side liquidity sweeps and priming, then treats relative equal lows as sell-side liquidity that could draw price downward. The 15-minute chart contains an optimal trade entry area and bearish order block, but ICT prioritizes determining where price may go and why before seeking precise entries. His process combines higher-time-frame bearish structure with lower-time-frame execution possibilities, filters out longs when the bias is bearish, and uses London and New York session scenarios without assuming every candle must follow the broader direction. He recommends historical review and repeated hindsight practice while acknowledging that breaker, order block and liquidity-draw labels do not prove positioning, future direction or profitability, and the recording provides no verified fills, complete chart data or order-book evidence.
How we researched this article
BestProps used document-based research from primary firm sources, checked September 25, 2026. The complete source list, scope, limitations, and commercial-state record appear near the end of this article.
In “Bitcoin Review – Community Post Call”, uploaded November 17, 2021, ICT reviews the reasoning behind a Bitcoin chart he says he shared through his YouTube Community tab on November 15. The lesson is primarily about forming a directional bias from market structure and liquidity, not about presenting a live trade or recommending a Bitcoin position.
ICT repeatedly limits the scope of his commentary. He says that he had never traded Bitcoin with real money and had only practiced through paper-trading tools. He also describes crypto as less consistent with the behavior he looks for in futures and foreign exchange markets. Those qualifications matter because the video is a retrospective explanation built around chart screenshots, not verified evidence of an executed trade or a generally reliable forecasting method.
Why ICT Highlighted Bitcoin in the Community Post
At 3:05, ICT begins describing the chart structure behind his Community post. He identifies a sequence of a high, a low and then a higher high. In his terminology, a particular down-close candle within that structure becomes a bearish “breaker.” He distinguishes that candle from the nearby swing low and treats a later return into the candle’s range as an area where selling might emerge.
He says the Community post was intended to direct students’ attention rather than tell viewers to enter a short position. At 5:20, he explains that an eyeball icon was his way of indicating where students should focus. According to ICT, the implied study question was whether price would decline toward a lower level shown on the chart.
ICT Bitcoin Bearish Breaker and Liquidity Outlook
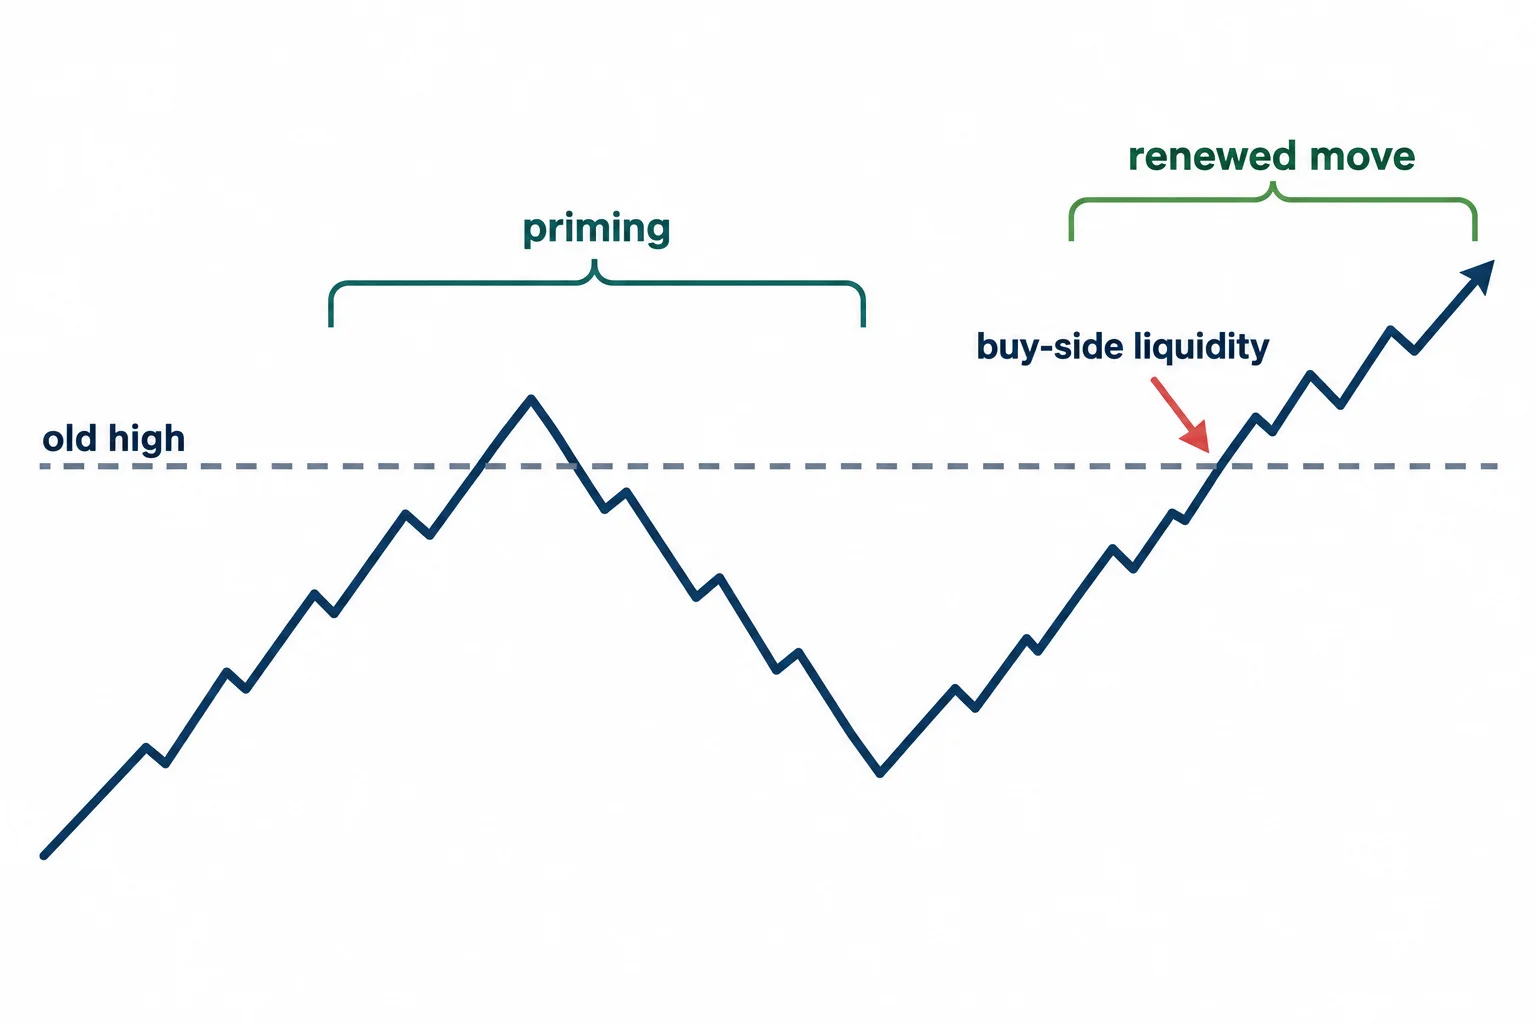
ICT expands the review to a daily chart at 6:29. His interpretation centers on an older April 2021 high. He says Bitcoin later moved above that high, fell back, and subsequently made another move higher. He characterizes this activity as the removal of short sellers and the triggering of buy-side liquidity above an old high.
At 10:16, ICT calls the initial move above the old high followed by a decline “priming.” In his framework, that sequence can encourage traders to believe a major reversal has already formed, attract short positions below, and then expose their stops to a later rally. He interprets the renewed move above the old high as offering bears a higher-price opportunity before another decline.
This is ICT’s market narrative, not a demonstrated fact about who held positions or why Bitcoin moved. A price chart alone does not reveal the identities, intentions or profitability of market participants.
ICT Bitcoin Equal Lows and Liquidity Targets
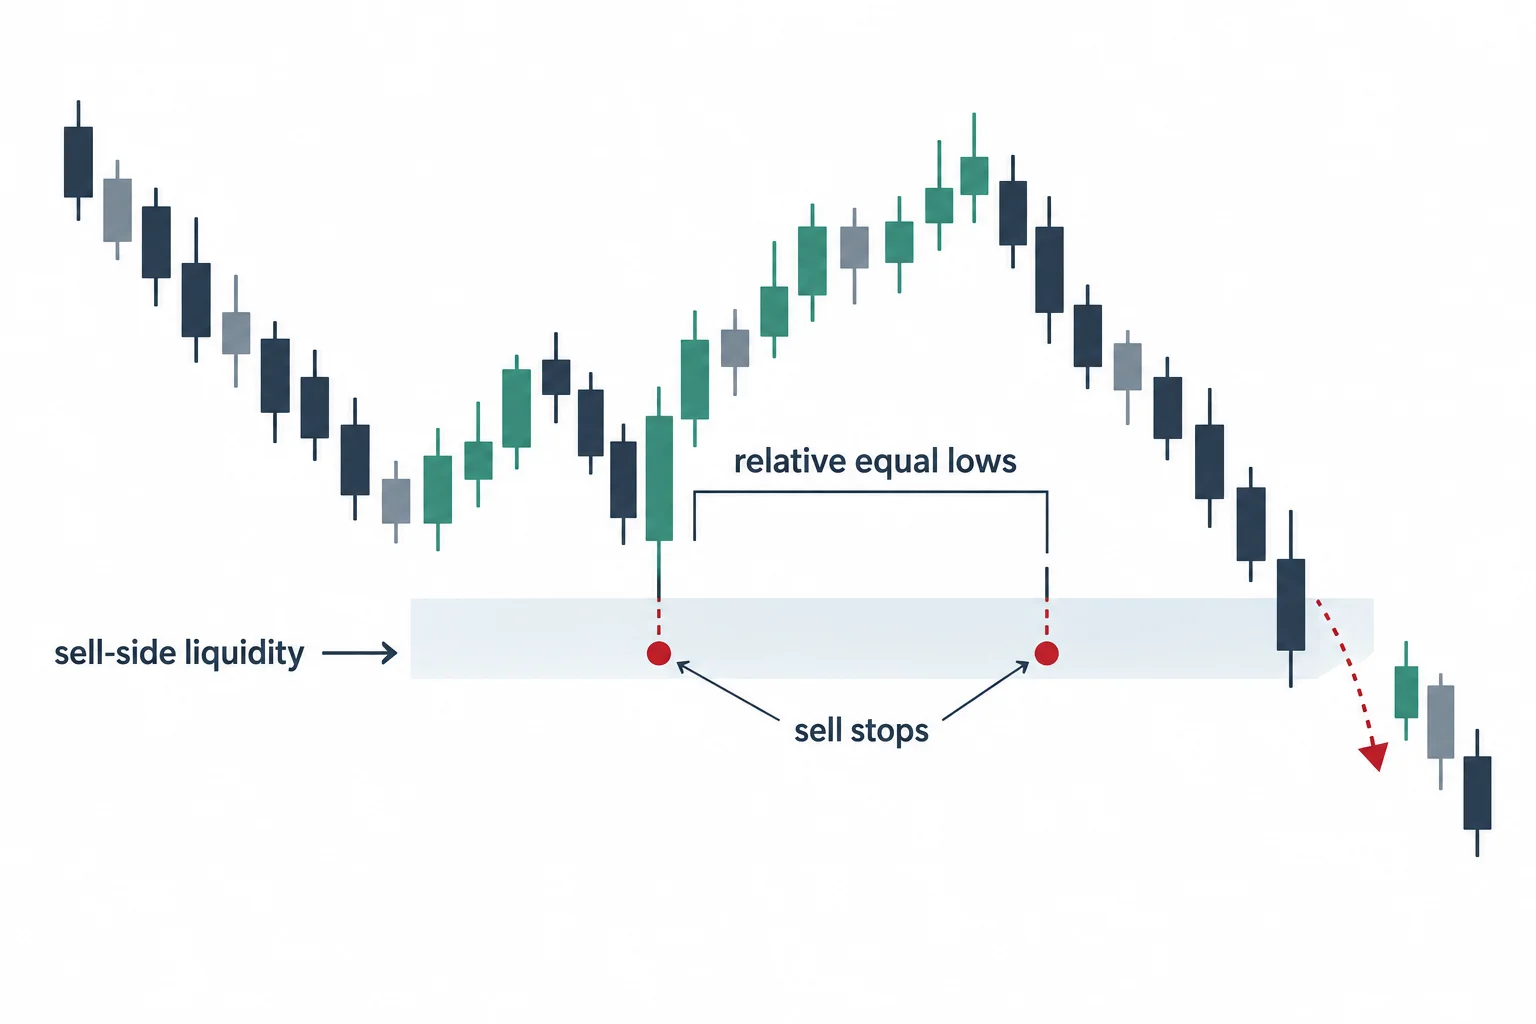
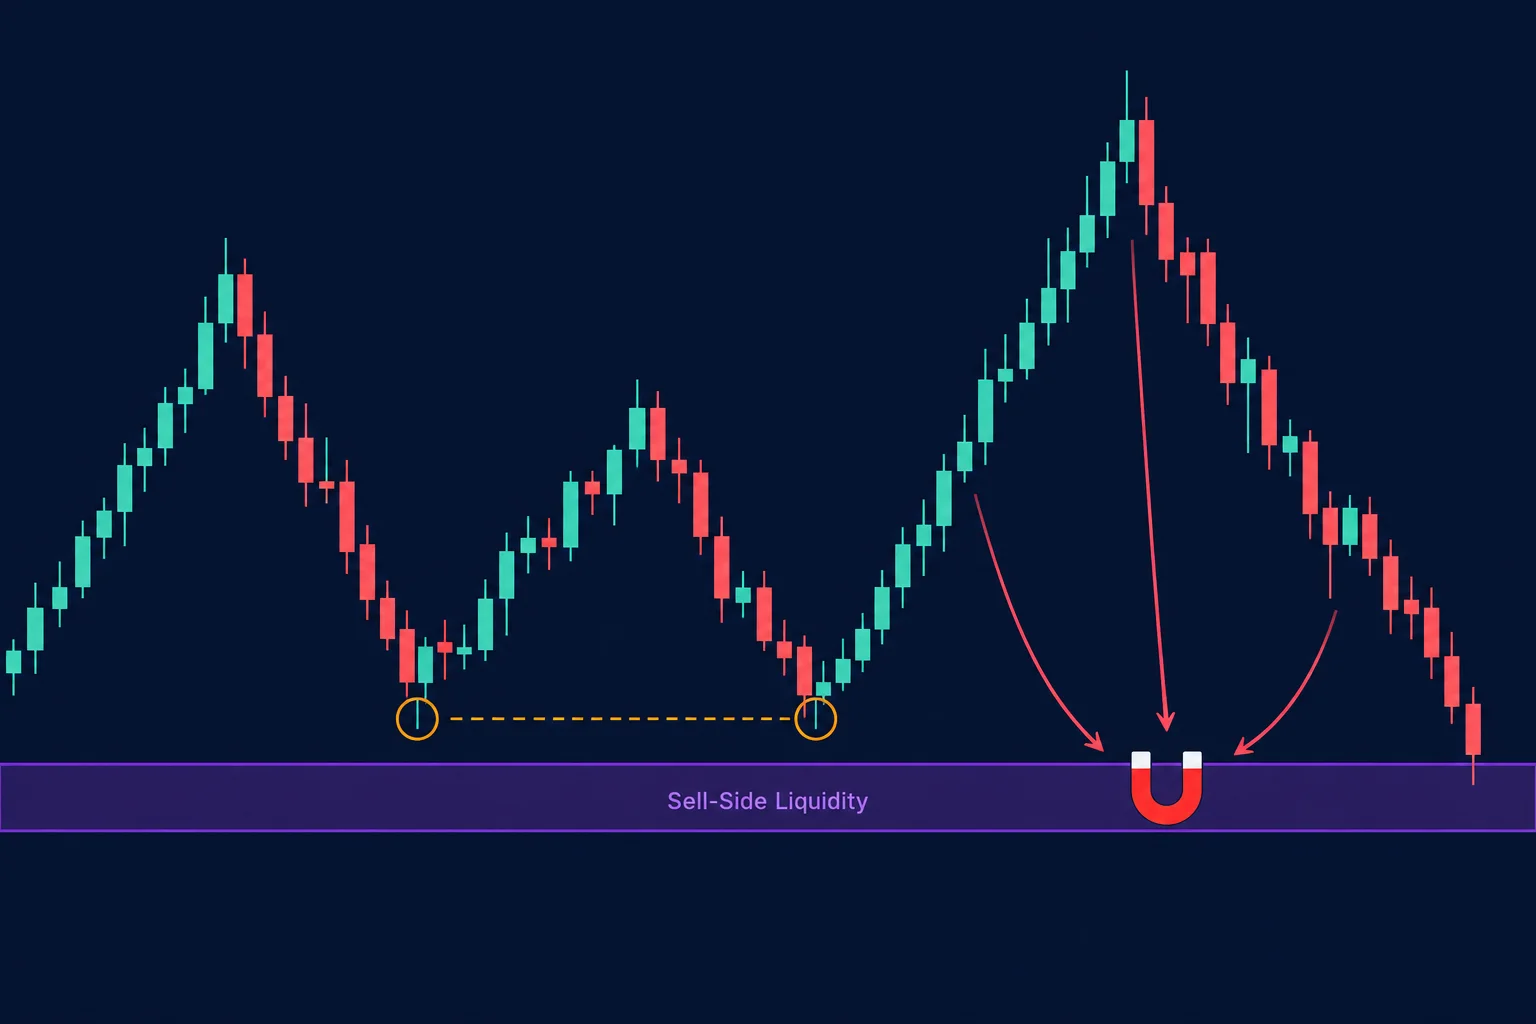
The central teaching begins around 11:51, where ICT moves to an hourly chart. He identifies another bearish breaker and then points to two lows he describes as “relative equal lows.” Under his model, sell stops may accumulate beneath such lows. He calls that area sell-side liquidity and treats it as a potential destination for price.
At 12:52, he compares the liquidity level to a magnet and the intervening candles to paperclips. The analogy expresses his thesis that price would be drawn below the lows to encounter resting orders. He also proposes that conventional support traders might buy near those prior lows and place protective sell stops underneath them, adding to the pool of orders.
ICT then describes the opposite side of the transaction: traders who sold short at higher prices would need to buy to close their positions. In his narrative, sell orders below the old lows could provide counterparties for that buying. This explanation should be understood as part of ICT’s analytical model; the transcript supplies no order-book evidence confirming the proposed positioning.
ICT Bitcoin Bias Before Breaker Entries
On a 15-minute view, ICT says the bearish breaker contained what he calls “optimal trade entry” areas and a bearish order block. Yet the broader lesson is that students should not begin by chasing highly precise entries or extremely small stops.
At 16:05, he frames two questions as more important:
- Where is the market likely to go?
- Why should it get there?
For this case study, ICT’s answer was that the higher-time-frame structure appeared bearish and the relative lows supplied a possible draw on liquidity. That bias led him to filter out long setups and concentrate on bearish scenarios. Around 17:58, he argues that understanding the proposed destination can offer multiple possible entries, reducing the fixation on capturing the entire move with minimal adverse movement.
How to Study the ICT Bitcoin Liquidity Model
ICT closes by connecting higher-time-frame bias with potential intraday behavior, including London- and New York-session scenarios. He cautions that a bullish or bearish higher-time-frame view does not mean every daily candle must move in the same direction.
At 24:34, he summarizes the process as identifying a draw on liquidity and constructing a narrative for why price might seek it. He recommends reviewing historical moves and practicing the construction of possible narratives with hindsight. He also explicitly says neither he nor a student should expect perfection and that pattern recognition takes repetition and time.
Lessons from the ICT Bitcoin Community Call
The video’s most useful general lesson is methodological: begin with a higher-time-frame hypothesis, identify the level that would invalidate or support it, and only then examine lower-time-frame execution ideas. Traders studying the recording should keep hypothesis and evidence separate. Labels such as breaker, order block and liquidity draw are components of ICT’s framework; they do not by themselves verify future direction, hidden institutional activity or profitability.
This review is educational commentary on the transcript, not investment advice. The recording does not provide verified trade fills, complete chart data or evidence that the same framework will perform consistently in other Bitcoin conditions.




