Key takeaways
ICT’s January 28, 2020 AUD/USD lesson argues that traders should map potential liquidity rather than automatically buy old support or apply broken-support-becomes-resistance rules.
Read the full summary
ICT’s January 28, 2020 AUD/USD lesson argues that traders should map potential liquidity rather than automatically buy old support or apply broken-support-becomes-resistance rules. At one minute he prioritizes locating clustered orders, and from four minutes 23 seconds he says patterns, Fibonacci relationships, order blocks, demand zones, and wave counts require a broader narrative. At 15 minutes 15 seconds he defines open float as buy-side liquidity above old highs, including short stops and breakout-long entries, and sell-side liquidity below old lows, including long stops and weakness-driven short entries. Using an old daily low at the origin of a major rally, he anticipates a move beneath it to reach protective sell stops, then examines relative equal highs and the daily level on a 15-minute chart around 19 minutes. At 22 minutes 18 seconds, offset distribution describes shorts opened near buy-side liquidity being closed through purchases from sell orders activated below the daily low. At 25 minutes 58 seconds, a kill zone is defined as a period when an important intraday turn is more likely, though not necessarily the day’s absolute high or low. Equal highs, equal lows, and repeated passes through support require context, while risk limits and invalidation remain independently necessary. The transcript supplies no order-book confirmation, verified fills, complete account records, subsequent performance, or proof of repeatable advantage.
How we researched this article
BestProps used document-based research from primary firm sources, checked September 25, 2026. The complete source list, scope, limitations, and commercial-state record appear near the end of this article.
In Forex Price Action Discussion – AudUsd, uploaded on January 28, 2020, ICT presents a liquidity-based reading of an AUD/USD chart. His central argument is that traders should not treat an old support level as an automatic place to buy. Instead, he asks viewers to consider the orders that may be clustered around the level and how price might move through those orders.
This article summarizes the framework taught in the video. Statements about algorithms, institutional behavior and “smart money” are ICT’s interpretations; the transcript does not independently establish them as market facts or demonstrate a repeatable trading advantage.
AUDUSD Price Action Through a Liquidity Lens
ICT opens by asking viewers to temporarily set aside the familiar rule that broken support becomes resistance and broken resistance becomes support. At 1:00, he introduces what he considers the more important question: where is liquidity likely to be resting?
His objection is not merely to drawing horizontal levels. It is to assuming that a previous reaction explains what price must do when it returns. In his presentation, a chart pattern, Fibonacci relationship, order block, demand zone or wave count has limited value unless it is placed inside a broader narrative. He develops that point beginning around 4:23.
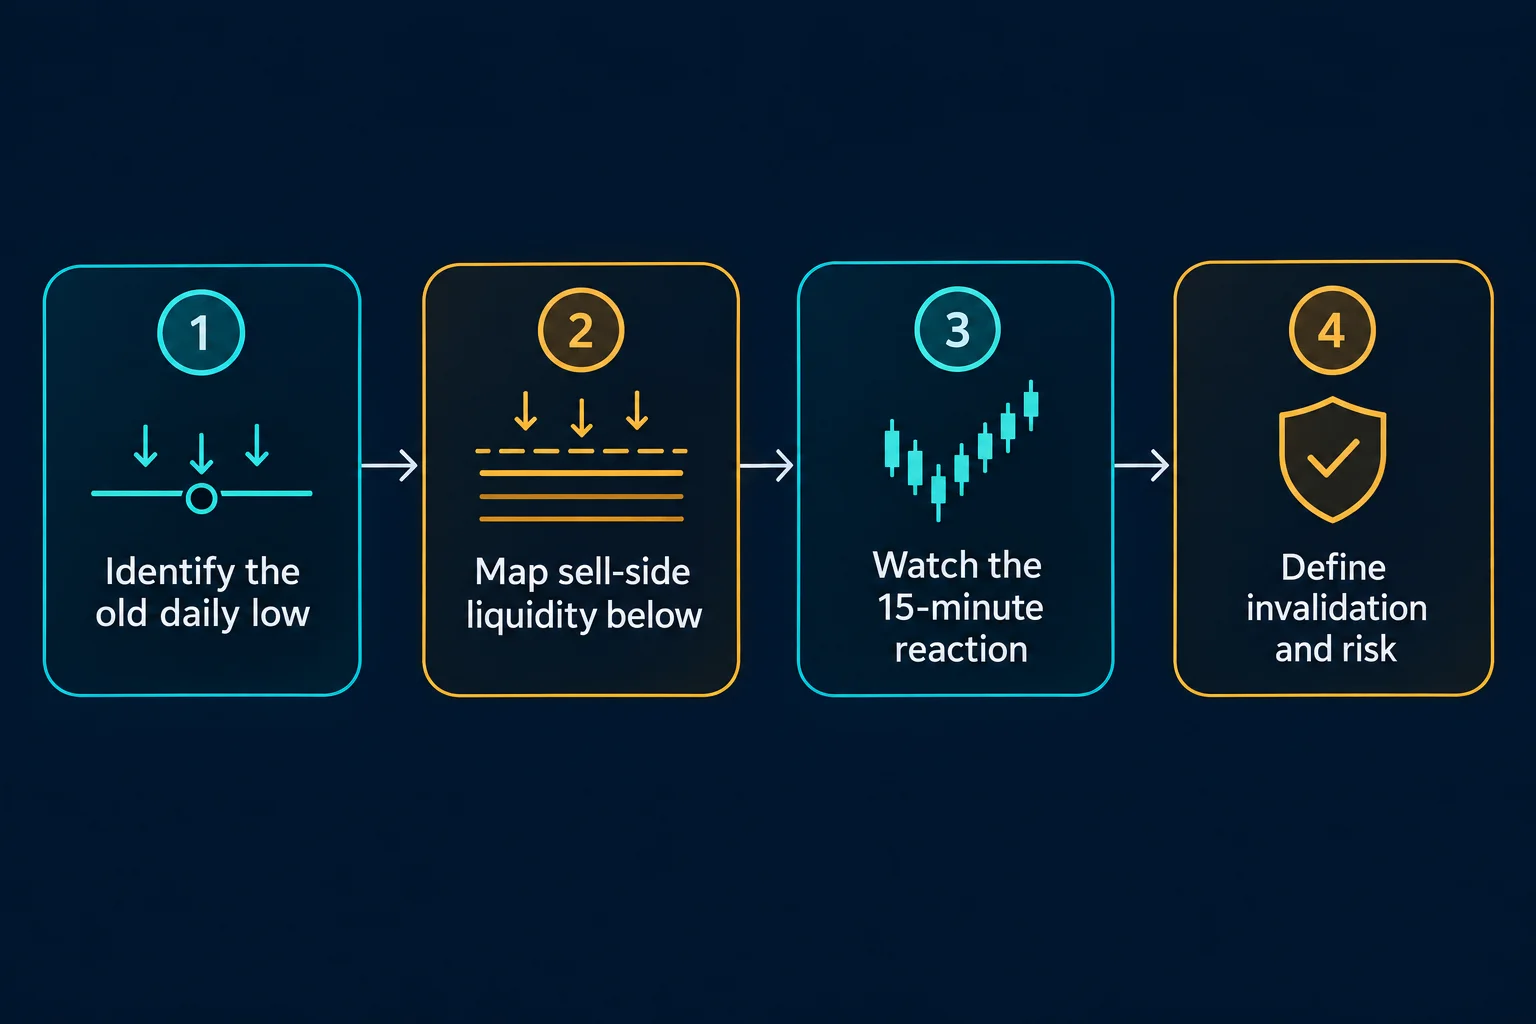
The practical reframing is:
- Do not ask only whether an old low is “support.”
- Ask which orders may sit above or below that low.
- Identify the larger price swing that makes the level relevant.
- Use lower time frames to study how price behaves around the selected level.
ICT Forex Buy-Side and Sell-Side Liquidity
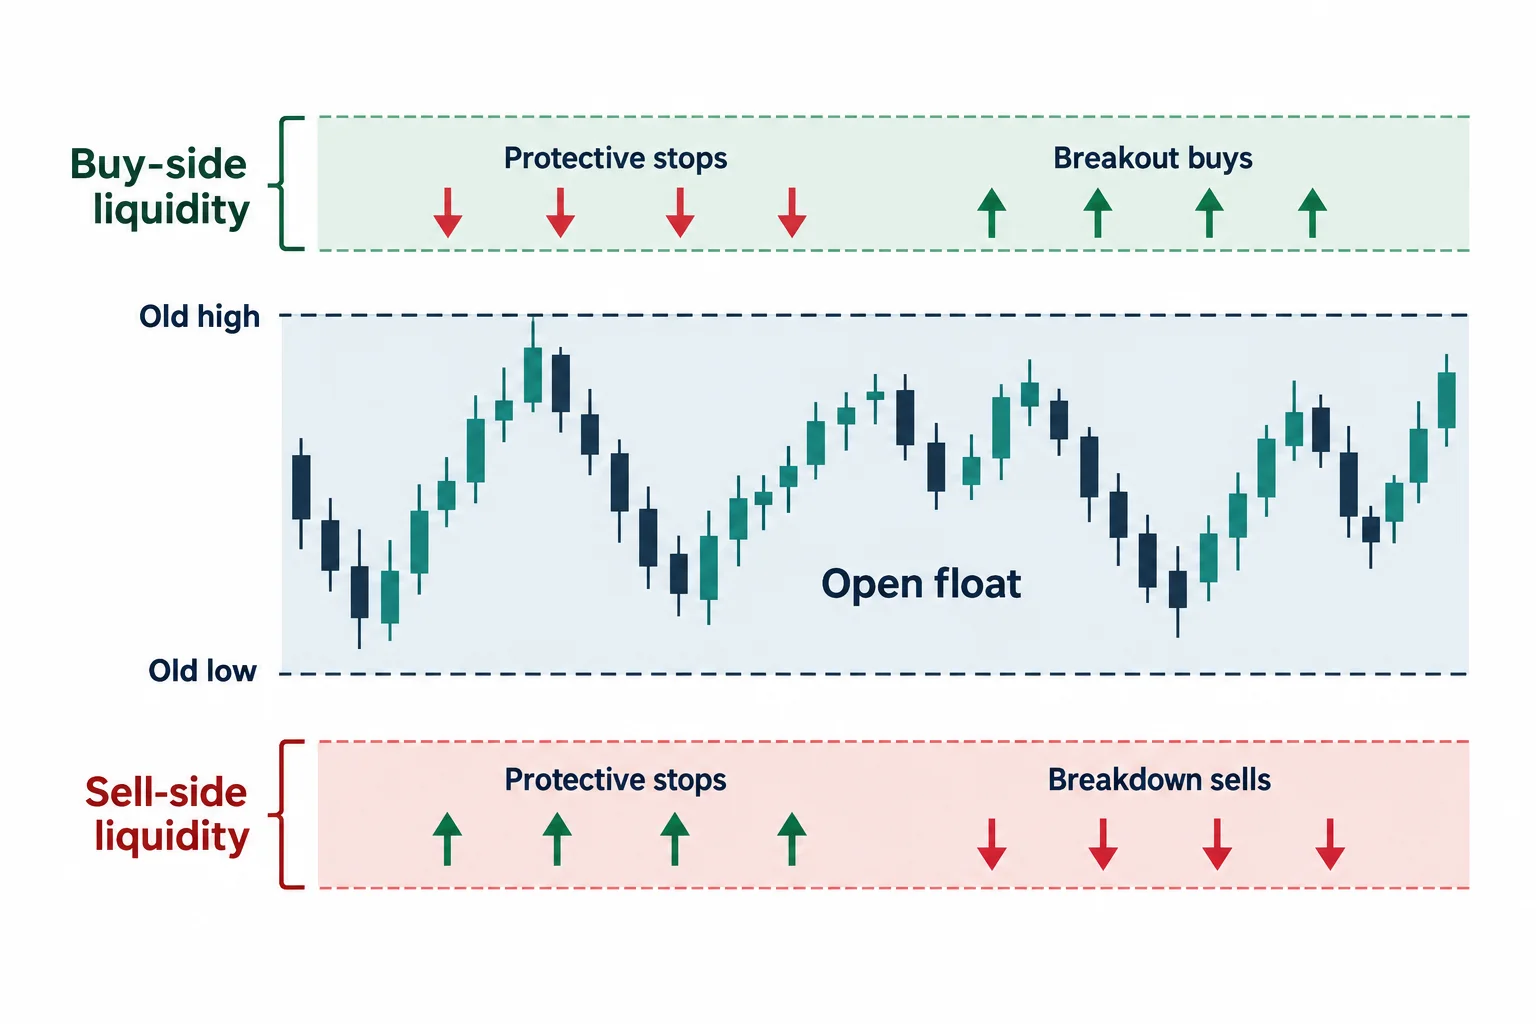
At 15:15, ICT defines “open float” through two order groupings. Above an old high, he places buy-side liquidity, which can include stops protecting short positions and stop orders intended to enter long on a breakout. Below an old low, he places sell-side liquidity, including protective stops on long positions and orders intended to enter short on weakness.
In the AUD/USD example, his attention is on an old daily low at the origin of a substantial prior rally. He reasons that longer-term long positions could leave a pool of protective sell stops beneath that low. Therefore, rather than expecting the level to produce another bounce automatically, he anticipates price reaching beneath it.
This is a conceptual map of possible order locations, not a count of actual orders. The video transcript provides no order-book data capable of confirming the size, ownership or precise composition of the proposed liquidity pool.
AUDUSD Daily Price Action on the 15-Minute Chart
Around 19:00, ICT shifts from the daily chart to a 15-minute AUD/USD chart. He keeps the old daily low marked as the central reference point and discusses relative equal highs above price.
Under his interpretation, a move above those highs reaches buy stops. He describes willing buyers entering at the higher prices while other participants take the opposite side by selling. Subsequent retracements are then framed as opportunities within a bearish path toward the old daily low.
Once price reaches and moves around that daily level, ICT argues that two conventional groups can become involved:
- Traders buying because they view the old low as support.
- Traders selling after a break because they view former support as new resistance.
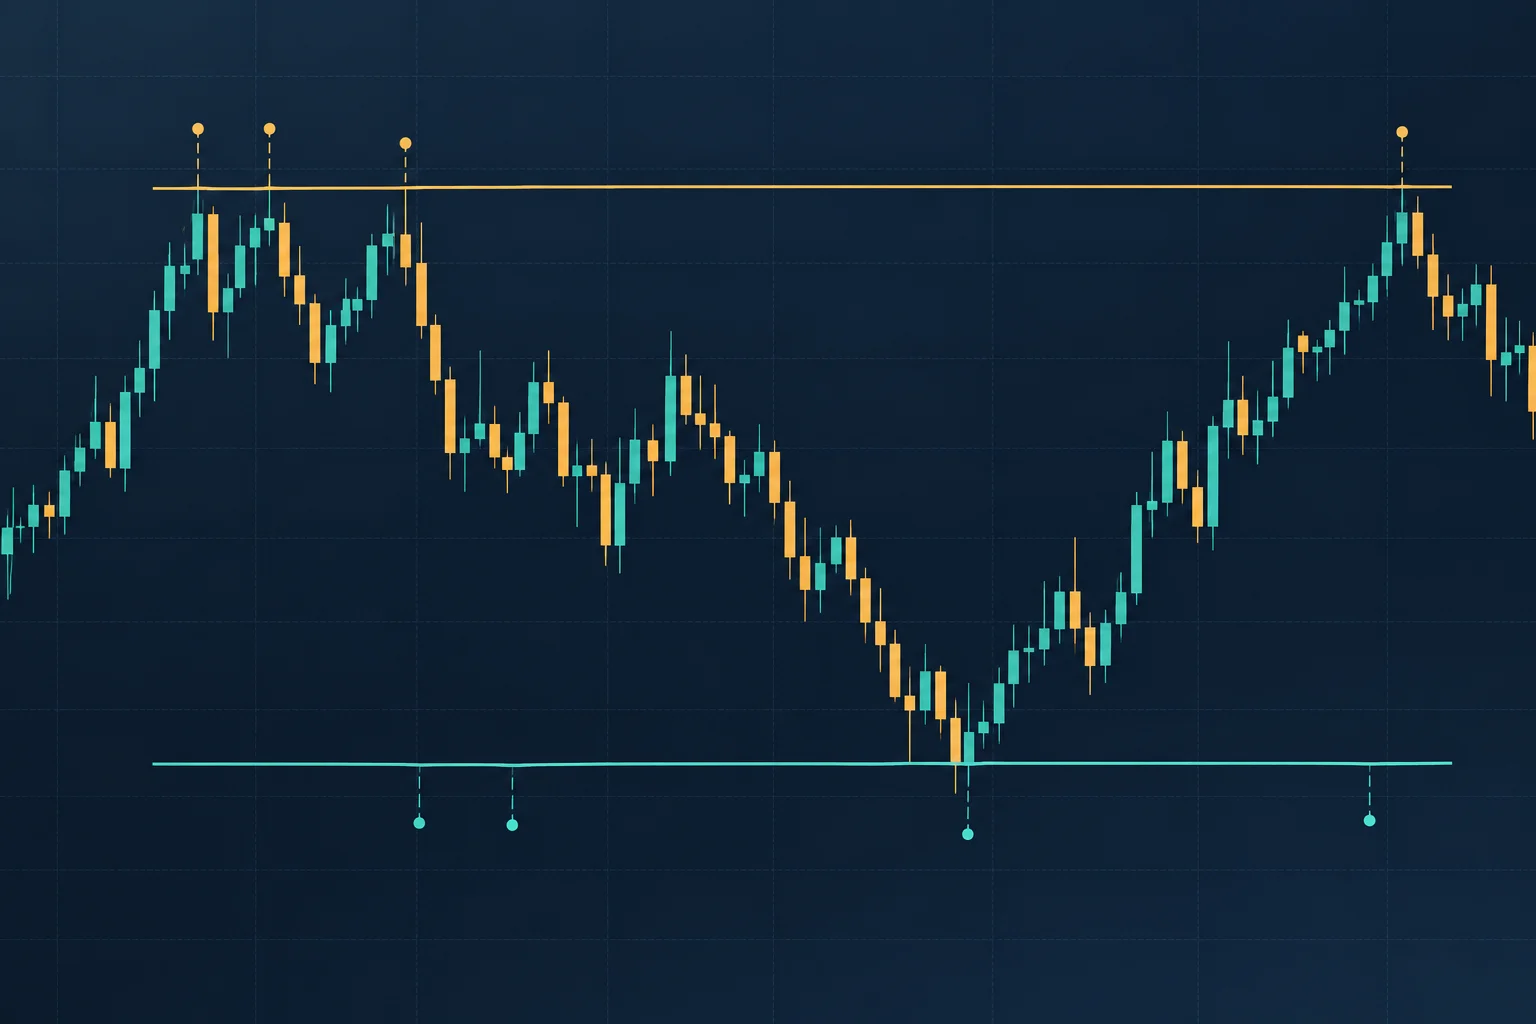
He interprets repeated movement on both sides of the level as the market accessing liquidity created by those competing expectations. His discussion near 30:00 emphasizes that price can make progressively deeper passes below the old low and then return above it, frustrating traders who apply a rigid support/resistance rule.
ICT Offset Distribution in AUDUSD Price Action
At approximately 22:18, ICT uses the term “offset distribution.” In his explanation, traders who sold near buy-side liquidity can close those shorts by buying from participants whose sell orders are activated below the old daily low.
The educational point is that exiting a short requires a purchase. ICT therefore asks viewers to think about where sufficient opposite-side orders might become available. The label is his terminology in this presentation; the transcript alone does not verify his broader claim about how interbank trading operates.
AUDUSD Liquidity Around Equal Highs and Lows
ICT also introduces his “kill zone” concept at 25:58. He defines it as a segment of the trading day in which he expects an important intraday turning point to be more likely. He cautions that such a turn need not become the day’s absolute high or low.
Later, he notes that equal highs and equal lows should not be traded mechanically. Similar-looking formations can precede either a reversal or a continuation, so he says context is necessary. That caveat is important: the lesson does not provide a standalone rule saying every cluster of equal highs or lows must be swept and reversed.
ICT Forex Price Action Lessons for Traders
The most transferable lesson is to separate a chart label from a decision. Calling a line “support” does not explain who might transact there, where invalidation orders could be concentrated or what larger directional context is being assumed.
A structured chart review inspired by the video might therefore document the relevant daily swing, mark old highs and lows, note potential stop locations, and observe lower-time-frame behavior without assuming an outcome. Risk limits and invalidation conditions would still need to be defined independently. The transcript shows ICT’s retrospective chart explanation and references earlier social-media commentary, but it does not provide verifiable fills, complete account records or subsequent performance for this AUD/USD example.