
Key takeaways
ICT’s 47-minute Advanced IPDA lesson uses TradingView and a 15-minute EUR/USD chart, with hourly and four-hour context, to define an interbank dealing range between recent buy-side and sell-side liquidity runs, mark its 50% equilibrium, classify prices above it as premium and below it as discount, and reassess the range when newer liquidity events appear.
Read the full summary
ICT’s 47-minute Advanced IPDA lesson uses TradingView and a 15-minute EUR/USD chart, with hourly and four-hour context, to define an interbank dealing range between recent buy-side and sell-side liquidity runs, mark its 50% equilibrium, classify prices above it as premium and below it as discount, and reassess the range when newer liquidity events appear. Under the bearish example, ICT combines premium pricing with weekly bias, timing, market structure, an hourly rejection block and fair value gap rebalancing rather than selling every move above equilibrium. He cites 1.1740 as a prior EUR/USD downside objective and claims a bearish week forms its high on Tuesday 70% of the time, though the lesson supplies no supporting dataset or verified trade record. Fair value gaps are one-way delivery imbalances that may be revisited, while balanced price ranges have experienced delivery in both directions, but neither structure guarantees a reversal or fill. Williams %R appears only as a comparison to show that overbought or premium describes location, not a complete setup. The framework is ICT’s interpretation rather than independently validated proof of algorithmic market behavior, and visible prices, entries, fills and outcomes are not verified.
How we researched this article
BestProps used document-based research from primary firm sources, checked September 25, 2026. The complete source list, scope, limitations, and commercial-state record appear near the end of this article.
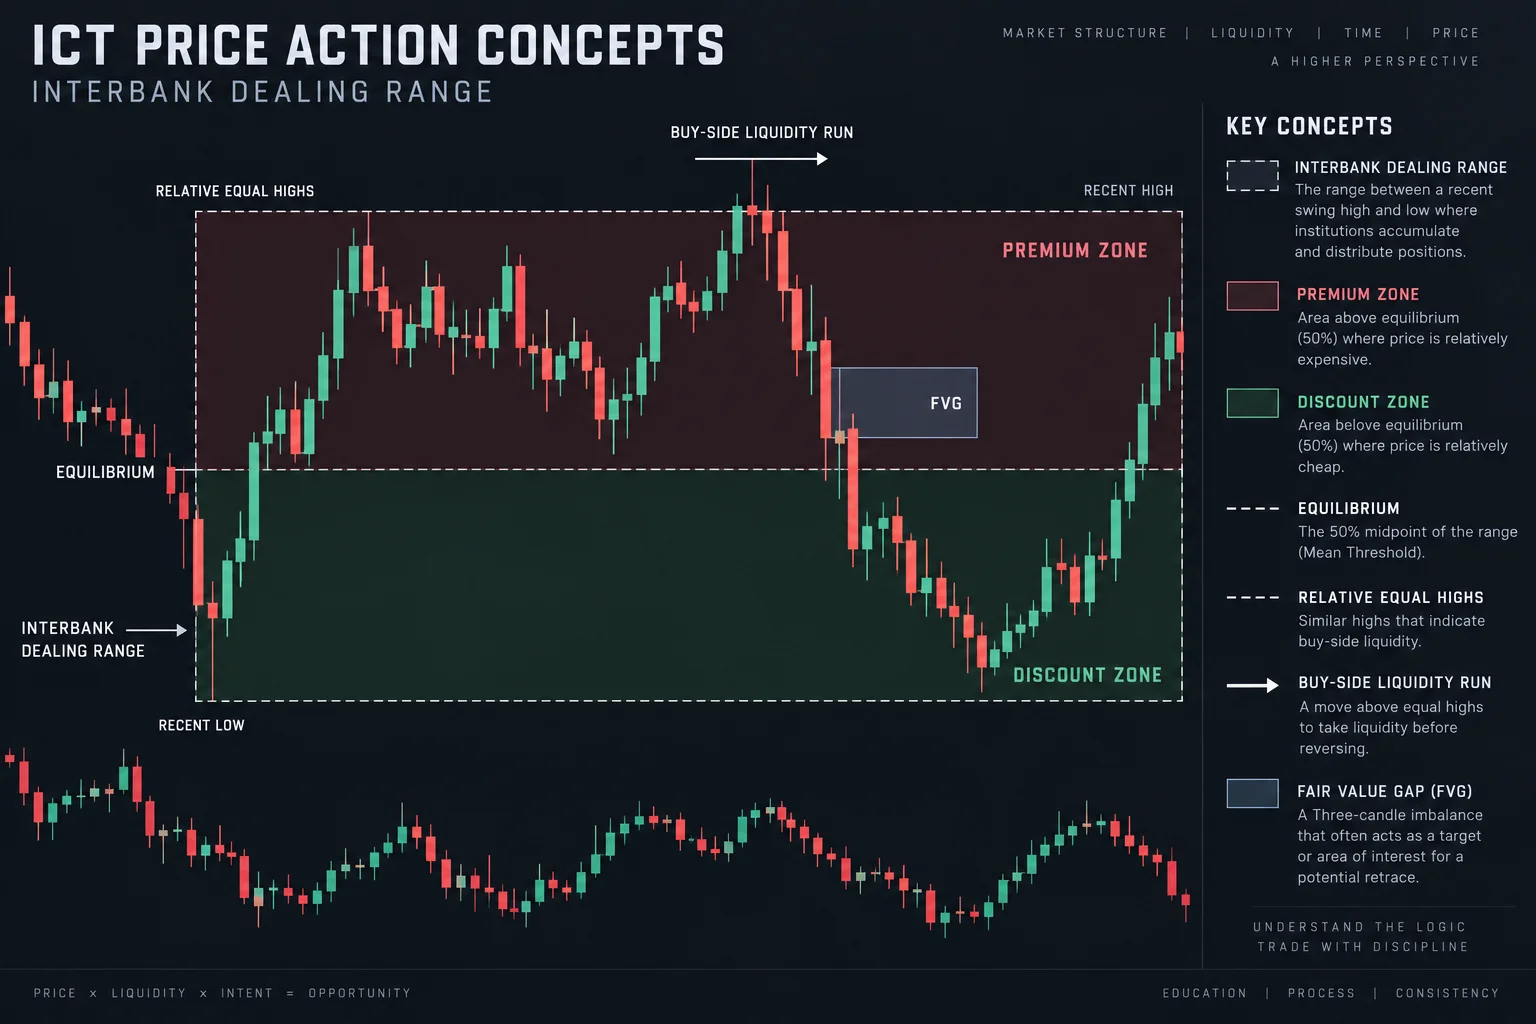
In ICT Forex Price Action Lesson: Advanced IPDA Insights, ICT presents a price-action framework built around liquidity, dealing ranges, fair value gaps and a weekly directional narrative. The lesson uses a 15-minute EUR/USD chart as its main example, later referring to hourly and four-hour candles for additional context.
This is an explanation of ICT’s interpretation, not independent proof that markets follow a particular algorithm. The transcript also cannot verify the chart’s visible prices, entries, fills or later results.
Advanced IPDA Dealing Ranges and Liquidity
ICT introduces the lesson’s main concepts at 00:41: the interbank dealing range, internal and external range liquidity, weekly “Power of Three,” and what he calls efficient price delivery. He argues that these ideas can be read directly from price rather than derived from conventional overbought and oversold indicators.
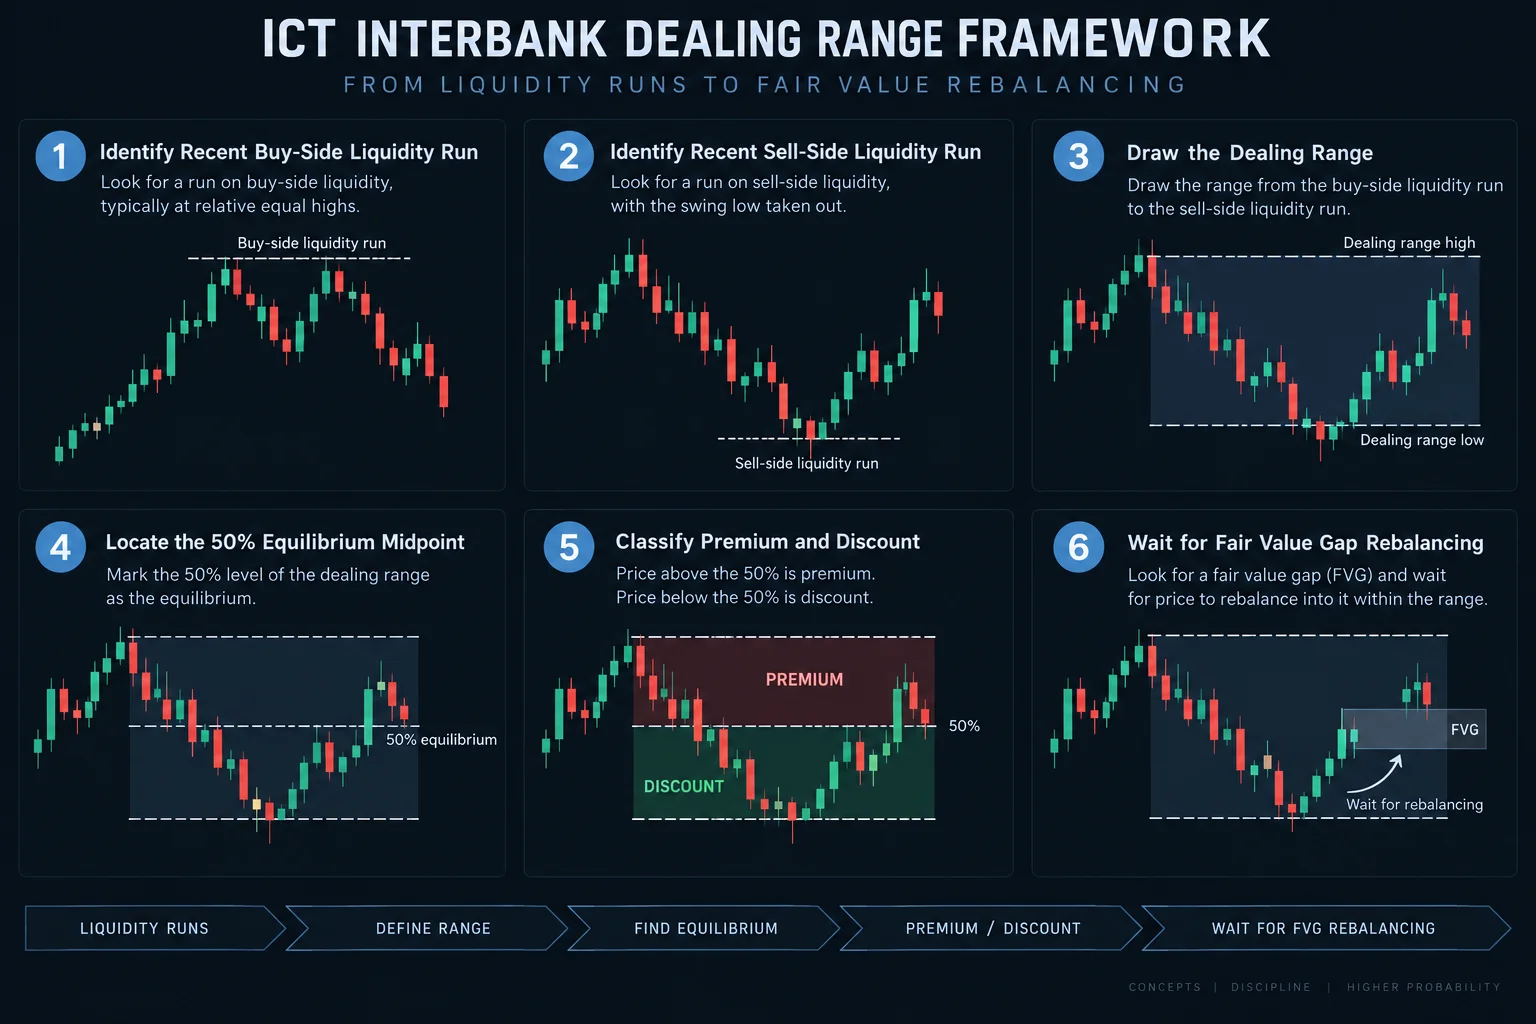
On the EUR/USD example, ICT first identifies relative equal highs as potential buy-side liquidity and a prior low as potential sell-side liquidity. At 07:52, he describes price as having moved above the highs and below the low. Those two liquidity events become the reference points for a new dealing range.
His practical summary is:
- Find the recent high associated with a run above buy-side liquidity.
- Find the recent low associated with a run below sell-side liquidity.
- Treat the span between those points as the current dealing range for the selected timeframe.
- Recalculate the framework when newer liquidity events establish a different relevant range.
ICT stresses near 09:02 that either side can be taken first. In his example, buy-side liquidity is reached before sell-side liquidity, but the sequence itself is not presented as a universal rule.
IPDA Price Range Premium and Discount
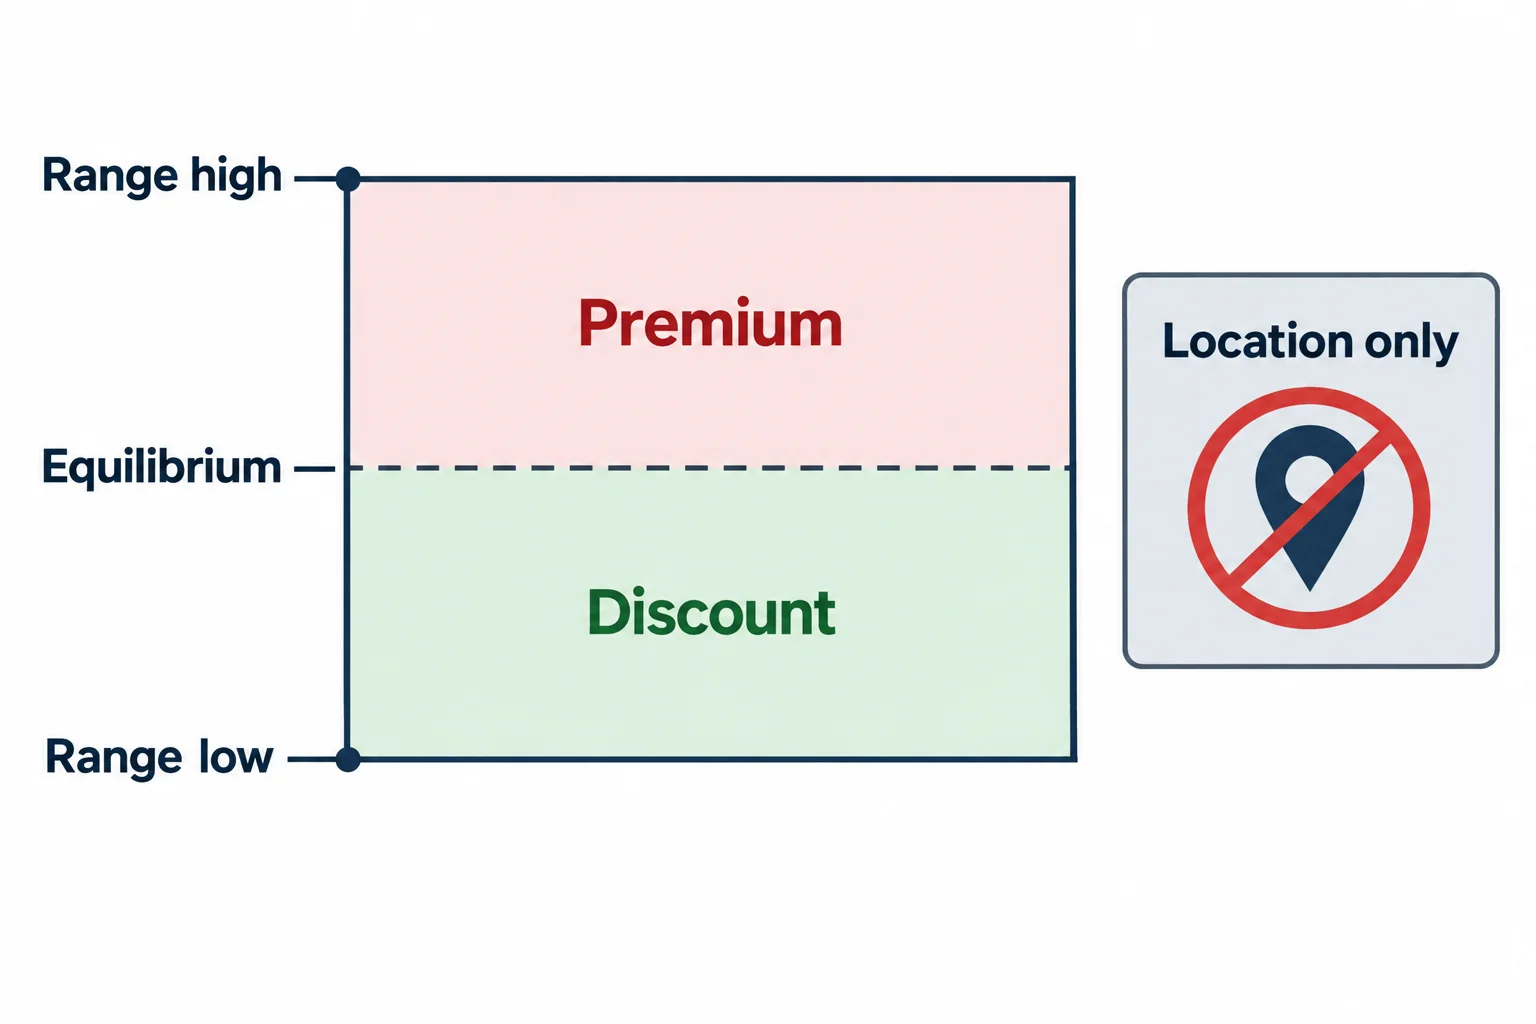
ICT places particular importance on the dealing range’s 50% midpoint, or equilibrium. He says a Fibonacci tool can be used simply to locate that midpoint, rather than to project a large collection of Fibonacci ratios. His explanation begins around 12:38.
Within the defined range, trading above equilibrium is described as being at a premium, while the implied opposite side is a discount. For a bearish narrative, ICT looks for potential short setups in the premium portion. However, he explicitly cautions that crossing above the midpoint is not a setup by itself. Price can remain above equilibrium and continue higher, just as an oscillator can remain overbought.
Under ICT’s framework, the midpoint becomes relevant only when combined with other elements, such as a directional bias, day of the week, time of day and a specific price feature inside the range. This qualification is important: the lesson does not provide a mechanical rule to sell every move above 50%.
ICT Forex Weekly Price Action Narrative
The worked example is organized around ICT’s then-bearish view of EUR/USD and modestly bullish view of the US dollar. He says he had previously identified 1.1740 as a downside objective. In this video, that level is discussed retrospectively; the transcript alone does not verify the earlier forecast or an executed trade.
At 16:58, ICT connects the dealing range to his weekly profile. He claims that in a bearish week, the weekly high forms on Tuesday 70% of the time, with Wednesday as another potential opportunity. No dataset or test is supplied in this lesson, so that percentage should be treated as ICT’s unsupported teaching claim rather than an established statistic.
The sequence he describes is an opening phase, a potential weekly high on Tuesday, and lower trading during Wednesday through Friday toward sell-side liquidity. On the displayed example, he interprets a Tuesday move into a premium area and an hourly “rejection block” as supporting the bearish narrative. A subsequent break of a swing low is then treated as confirmation of lower delivery.
ICT Price Action Gaps and Efficient Rebalancing
From 24:32, ICT shifts to fair value gaps. In a fast decline, he identifies a price interval between surrounding candles that was traversed in only one direction. He calls this an imbalance and argues that a later retracement may revisit the interval to provide delivery in the opposite direction.
His paint-roller analogy at 28:12 illustrates the idea: a rapid directional move can leave a thinly covered pocket, and a return move fills or “rebalances” it. In the bearish example, retracements into such gaps are interpreted as possible short-entry locations when they agree with the broader narrative.
Importantly, the video does not establish that every gap must be filled immediately, or at all. ICT’s own discussion shows that a retracement can stop short, move somewhat beyond a marked area or create drawdown before continuing. A fair value gap is therefore presented as a contextual reference, not a guaranteed reversal boundary.
ICT Balanced Price Ranges and Liquidity Levels
A related concept appears around 33:40. ICT calls a segment balanced after price has delivered through it in both directions. He then distinguishes this structure from the generic retail description of “broken support becoming resistance.”
In his interpretation, an old low becomes more meaningful when price has first traded down through a range, returned upward through it, and then moved below it again. A later rally toward that area may act as resistance, but ICT attributes the reaction to prior two-way delivery and an overshoot rather than to a horizontal line alone.
Why ICT Uses a Price Action Oscillator
Near 41:14, ICT adds Williams %R. He explains that the oscillator is shown for comparison, not as the basis of his analysis. His contention is that both an oscillator and his range framework can identify an overbought condition, but the dealing range supplies a more specific narrative about which price span matters.
The broader educational takeaway is to separate condition from setup. “Premium” or “overbought” describes location; it does not independently determine direction, timing or risk. Even within ICT’s framework, the proposed setup requires alignment among liquidity, range position, market structure, timing and a directional objective.
Advanced IPDA Price Action Insights
ICT closes by summarizing the dealing range at 45:13: locate the two recent markers associated with buy-side and sell-side liquidity, then apply that range on the timeframe being traded. He notes that a 15-minute, hourly and four-hour chart can each produce a different dealing range.
The video is best understood as a detailed walkthrough of ICT’s own market model. It offers a vocabulary for organizing price action (liquidity runs, equilibrium, premium, fair value gaps and balanced ranges), but it does not supply independent testing of its algorithmic or predictability claims. These concepts require careful chart review and risk controls; they are not assurances of a trade outcome.
ICT Forex Price Action Lesson Resources
- Primary source: ICT Forex Price Action Lesson: Advanced IPDA Insights (YouTube) The full 47-minute lesson referenced with timestamped citations throughout this article.
- TradingView The charting platform ICT uses for the EUR/USD 15-minute walkthrough in this lesson (unofficial third-party tool; not independently tested by BestProps).
- EUR/USD live chart (Investing.com) The trading pair used throughout the lesson's examples (third-party financial data; not independently verified by BestProps).
- BabyPips (School of Pipsology) Free educational coverage of market structure and liquidity concepts referenced elsewhere in the ICT framework (third-party education site).



